Abstract
Mucopolysaccharidoses (MPS) are a group of lysosomal storage disorders that affect regulation of glycosaminoglycan (GAG) processing. In MPS, the lysosomes cannot efficiently break down GAGs, and the specific GAGs accumulated depend on the type of MPS. The level of impairment of breakdown varies between patients, making this one of the many factors that lead to a range of clinical presentations even in the same type of MPS. These clinical presentations usually involve skeletal dysplasia, in which the most common feature is bone growth impairment and successive short stature. Growth impairment occurs due to the deposition and retention of GAGs in bone and cartilage. The accumulation of GAGs in these tissues leads to progressive damage in cartilage that in turn reduces bone growth by destruction of the growth plate, incomplete ossification, and imbalance of growth. Imbalance of growth leads to various skeletal abnormalities including disproportionate dwarfism with short neck and trunk, prominent forehead, rigidity of joints, tracheal obstruction, kyphoscoliosis, pectus carinatum, platyspondyly, round-shaped vertebral bodies or beaking sign, underdeveloped acetabula, wide flared iliac, coxa valgus, flattered capital femoral epiphyses, and genu valgum. If left untreated, skeletal abnormalities including growth impairment result in a significant impact on these patients’ quality of life and activity of daily living, leading to high morbidity and severe handicap.
This review focuses on growth impairment in untreated patients with MPS. We comprehensively describe the growth abnormalities through height, weight, growth velocity, and BMI in each type of MPS and compare the status of growth with healthy age-matched controls. The timing, the degree, and the difference in growth impairment of each MPS are highlighted to understand the natural course of growth and to evaluate future therapeutic efficacy.
Keywords: growth impairment, mucopolysaccharidoses, glycosaminoglycans, lysosomal storage disorders, short stature
2. Introduction
Mucopolysaccharidoses (MPS) are a series of lysosomal disorders caused by deficiency of enzymes that are required for the breakdown of complex carbohydrates This lack of degradation leads to the build-up of chondroitin sulfate (CS), dermatan sulfate (DS), heparan sulfate (HS), or keratan sulfate (KS) in the lysosomes located in tissues all over the body, resulting in clinical complications in many different tissues While MPS is usually not apparent at birth, signs and symptoms of MPS develop in early childhood as GAGs start to accumulate. Symptoms include neurological problems (depending on the type of MPS), corneal clouding, hearing loss, coarse facial features, sleep apnea, loud snoring, heavy breathing, respiratory infections, short hands, heart disease, skeletal dysplasia, short stature, progressive joint stiffness, and hepatosplenomegaly.
Growth impairment in young children can be caused by a variety of diseases, but for MPS patients, growth impairment begins when the accumulation of GAGs impairs function of cartilage and bone cells, resulting in progressive and permanent damage in bone and cartilage. However, other organs may still grow normally, resulting in apparent overgrowth relative to the skeletal system. In MPS, this imbalance of growth leads to a prominent forehead, dwarfism with short neck and short trunk, spinal cord compression, tracheal obstruction, and hepatosplenomegaly.
Monitoring of height is a critical measurement in the assessment of disease progression and therapeutic efficacy in MPS. If the patient is old enough and can stand without difficulty, height is measured while standing up straight on a flat surface. However, for infants or patients immobilized by their growth impairment, height can be measured as length while laying down on a flat surface.
MPS IVA is the most severe in terms of growth impairment, followed by MPS VI, MPS VII, MPS II, and lastly MPS III with the mildest growth limitation. Neufeld et al. reported a final height of 110 cm for patients with Hurler syndrome [1], but this only incudes patients with the most severe form of MPS I. Attenuated forms of MPS I, Hurler-Scheie, and Scheie, typically have lower growth retardation than Hurler patients. Lack of comprehensive growth charts for all forms of MPS I preclude accurate categorization of MPS I.
This systematic review of growth impairment in MPS compares and contrasts the common and unique growth patterns of each type of MPS.
3. MPS I
3.1. Natural history of MPS I
MPS I is a multisystem disorder that progresses in severity that ranges from attenuated to severe and is caused by a deficiency in the enzyme alpha-L-iduronidase [2, 3]. This deficiency further leads to the accumulation of GAGs, DS and HS. MPS I is further broken down into three classifications; Hurler syndrome (severe), Hurler-Scheie syndrome (intermediate), and Scheie syndrome (attenuated) [2, 3]. Patients with attenuated MPS I do not present with clinical symptoms until aged between three and ten years [2]. They usually have normal psychomotor development and show normal neurological development in their first few years of life, but learning disabilities may become apparent as they become older [2]. The least affected attenuated patients have few complications and subsequent near-normal lifespan. By contrast, dysostosis multiplex, hearing loss, and intellectual disabilities are widespread in severe MPS I [2]. Death for these patients occur within the first decade of life, typically due to cardiorespiratory failure [2].
3.2. Growth impairment in MPS I
Most patients with MPS I exhibit short stature related to defective growth plate due to GAG accumulation [3]. A longitudinal growth study that took place between 1989 and 2009 at Children’s Memorial Health Institute (CHMI) in Poland highlights this growth impairment [3]. Sixteen male patients with Hurler Syndrome were included in this study, with the mean age being 2.2 years [3]. All patients were carried to the full term of pregnancy, and the diagnosis of MPS I was confirmed by molecular/biochemical analyses, with the median age of diagnosis being 1–2 years of age [3]. None of the patients received enzyme replacement therapy (ERT) before or during this study. Mean birth length and weight for patients with Hurler syndome were 55.3 ± 3.7 cm (+1.1 SD compared with normal male newborns) and 3.43 ± 0.7 kg (−0.7 SD), respectively (52.2 ± 2.8 cm and 3.50 ± 0.6 kg at birth in normal male newborns) [3]. Until the age of 24 months, the average height Z scores for Hurler patients were above Polish reference charts (with the range being 0.02 to 1.71) [3]. Above 2 years of age, height velocities decreased in patients when compared to controls. At 12 years of age, Z score for height decreased to −7.8.
4. MPS II
4.1. Natural history of MPS II
MPS II (Hunter syndrome) is an X-linked recessive multisystem disorder as a result of a iduronate-2-sulfatase (I2S) deficiency [3]. The GAGs that accumulate with this disorder are DS and HS. MPS II is an X-linked trait that chiefly affects males. Female carriers of the disorder do not display any symptoms [3]. MPS II incidence ranges from 0.6 to 1.3 per 100,000 live male births [4]. However, there are a few cases of females with MPS II, albeit with an attenuated form [5]. Rather than completely lacking the iduronate-2-sulfatase enzyme as seen in males, females have low I2S activity [5]. Patients with attenuated MPS II are diagnosed between 4 and 8 years of age and may have normal intelligence [6]. All patients with severe phenotypes have CNS involvement, severe learning problems, psychomotor issues, and a degrading neurological status [4, 5]. Death for these patients typically happens during their second decade of life from cardiac or respiratory disease [5].
4.2. Growth impairment in MPS II
In 2012, Tomatsu et al. first described that for MPS II, the birth height and weight of patients were indistinguishable from unaffected controls although MPS II patients tend to be taller and heavier than unaffected individuals up to the age of 5 years old [6, 7]. By the age of 10 years, all growth has more or less stopped [6]. It is noteworthy that height and weight of patients with attenuated MPS II are indistinguishable from patients with severe MPS II at any age [6].
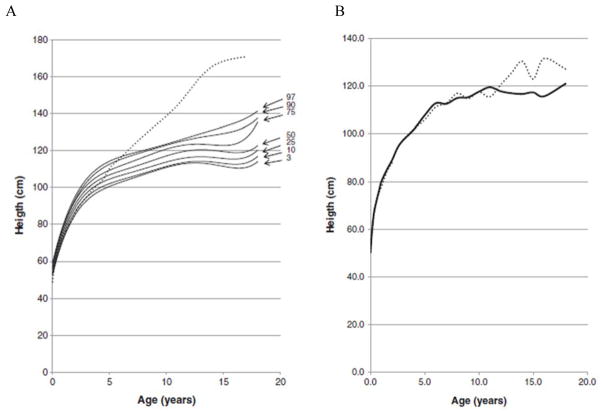
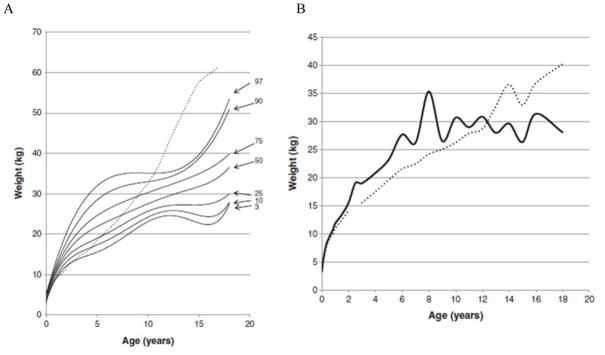
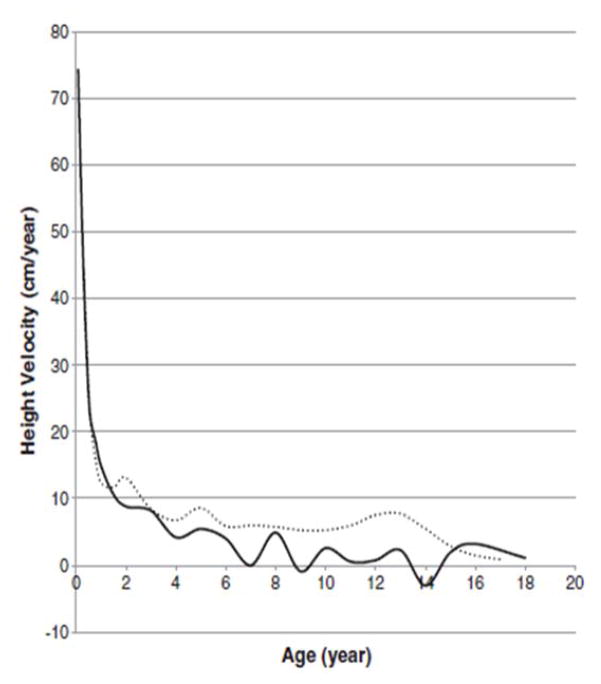
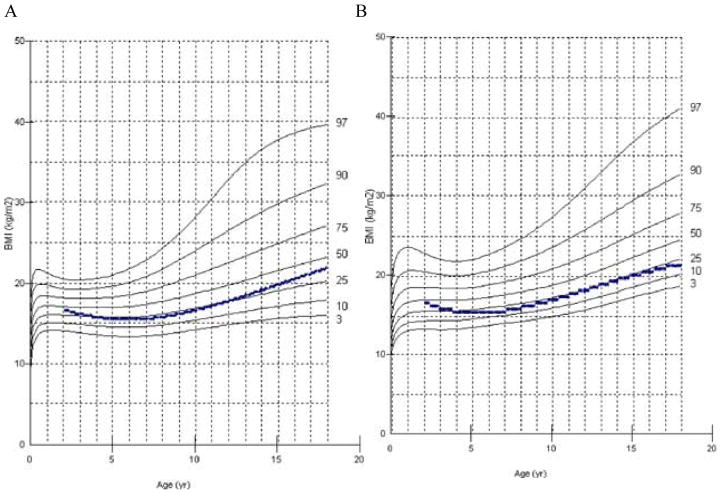
In 2013, a longitudinal study performed on 111 Japanese males with MPS II collected data on height, weight, and BMI of these patients and matched those values to age-matched controls [8]. The mean birth weight of these patients was 3.35 ± 0.39 kg (+0.35 SD) and the mean birth length was 50.31 ± 1.42 cm (+1 SD), while the healthy controls had a mean birth weight of 3.0 kg and a mean birth length of 49.0 cm (Figs. 1A and 4) [8]. The mean final weight of these patients at and above 18 years of age was 37.18 ± 8.72 kg, and the mean final height was 125.63 ± 9.09 cm (Figs. 1A and 3A) [8]. This is significantly lower, compared to age-matched controls; the mean final weight is 25.89 kg less than that in the controls (63.07 kg), and the mean final height is 46.40 cm less than that in the controls (172.03 cm) (Figs. 1A and 3A) [8]. In terms of BMI, the mean birth BMI was 13.2 ± 3.29 kg/m2 (control was 12.5 kg/m2) while the mean BMI at and above 18 years of age was 29.41 ± 6.15 kg/m2 (Fig. 4) [8]. As seen in previous studies, heights of attenuated and severe forms of MPS II were indistinguishable at any age (Fig. 1B) [8]. Accelerated growth in MPS II was detected in infants compared to controls while growth velocity was less than age-matched controls after the first year of life (Fig. 2) [8].
Figure 1.
Growth chart for patients with MPS II from birth to 18 years old, and comparison of mean height between the attenuated and severe phenotype. In Fig. 1A, the dotted line shows the mean height for healthy males and the solid line shows heights for MPS II patients. In Fig. 1B, the dotted line shows the mean height for patients with the attenuated phenotype and the solid line shows the mean height for patients with the severe phenotype. Arrows point to their respective percentile curve. Adapted from Patel et al. (Mol Genet and Metab Rep 1; 2014, 5–18) [8]
Figure 4.
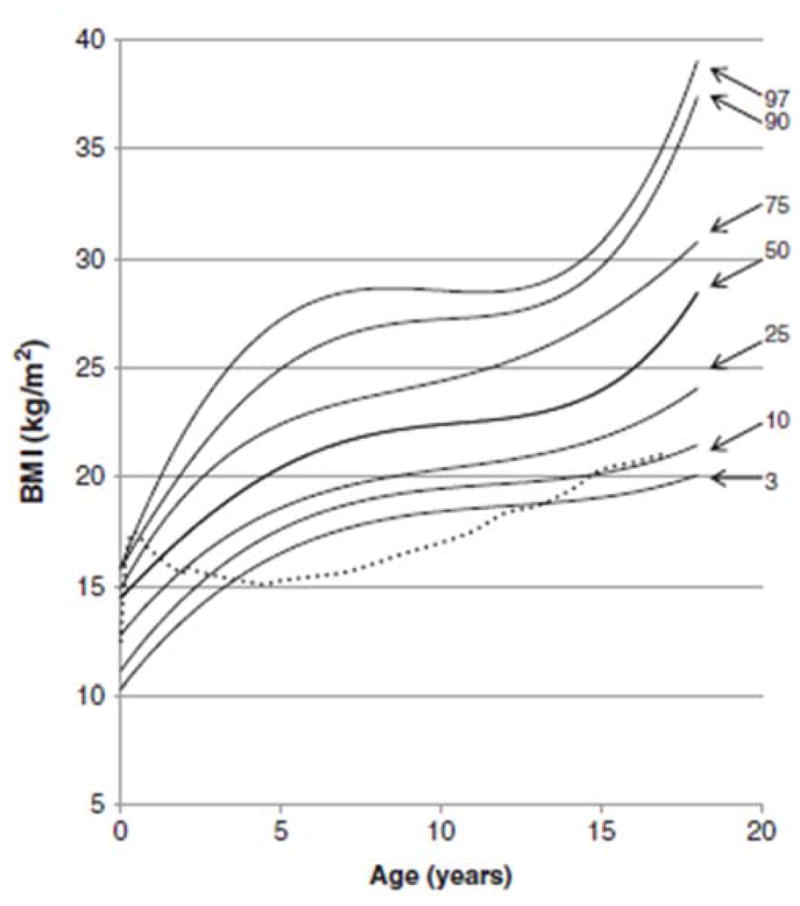
BMI curve for patients with MPS II from birth to 18 years of age. The dotted line shows the mean BMI for healthy males. The solid line shows BMIs for patients with MPS II. Arrows point to their respective percentile curves. Adapted from Patel et al. (Mol Genet and Metab Rep 1; 2014, 5–18) [8].
Figure 3.
Weight curve for patients with MPS II from birth to 18 years of age. In Fig. 3A, the dotted line shows the mean height for healthy males and the solid line shows weights for patients with MPS II. In Fig. 3B, the dotted line shows the mean weight for patients with the attenuated phenotype and the solid line shoes the mean weight for patients with the severe phenotype. Arrows point to their respective percentile curves. Adapted from Patel et al. (Mol Genet and Metab Rep 1; 2014, 5–18) [8].
Figure 2.
Growth velocity from birth to 18 years of age in patients with MPS II. The dotted line shows the growth velocity of the normal control. The solid line shows the mean height velocity for patients with MPS II. Adapted from Patel et al. (Mol Genet and Metab Rep 1; 2014, 5–18) [8]
In 2014, a study on 32 Korean males with MPS II measured the heights of patients before ERT was administered [9]. The authors divided the patients into three groups: Group 1 contained 14 patients under 6 years old, Group 2 contained 11 patients from 6 to 10 years of age, and Group 3 contained 7 patients from 10 to 20 years of age [9]. None of the patients in group 1 had short stature compared with the age-matched controls (less than −2 SD). The median height in this group was 106.3 cm, with the range being from 78 cm to 119.4 cm [9]. Six of the eleven patients in group 2 were categorized as having short stature (more than 2 SD lower than controls), with a median height of 116.2 cm, and range from 98 cm to 122.5 cm [9]. Five of the seven patients in group 3 were categorized as having short stature compared to age-matched control with a median height of 127.7 cm, and a range from 116.7 cm to 142.4 cm [9]. There was no relationship between short stature and cognitive impairment [9].
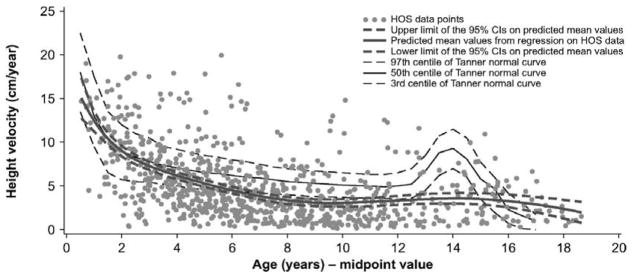
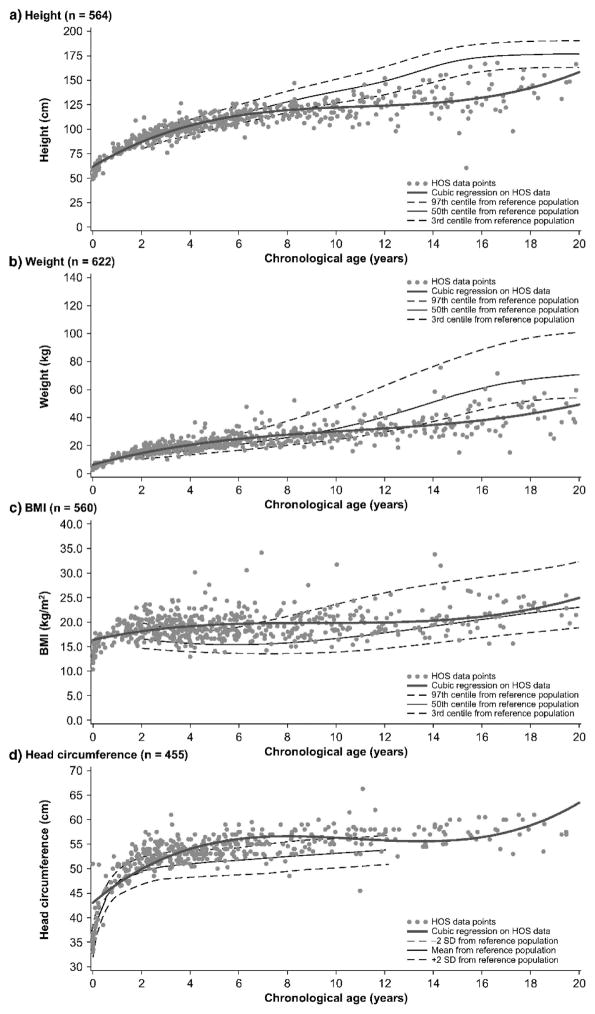
In 2016, natural history data were collected from the Hunter Outcome Survey registry that followed 676 males from all over the world. These patients did not receive any treatment before entering the study [10]. The average patient had short stature at ages of 8 years, and older and male patients did not go through a typical pubertal growth spurt (Fig. 6) [10]. Prior to age 8 years of age, weight, and BMI were more than controls, and at all ages, head size was larger than controls (Fig. 5) [10]. The median Z scores for patients 2–4 years old for height, weight, and BMI were 0.5, 1.7, and 2.0, respectively; whereas the median Z scores for patients 16–20 years old for height, weight, and BMI were −4.5, −3.7, and 0.4, respectively [10]. An increase of weight, BMI, and head size was associated with the severity of mental disabilities, but there was no correlation between height and mental disabilities, as seen previously in Japanese patients [10, 11]. There was also no correlation between height and MPS II severity. Thus, all 3 independent studies show that growth impairment does not correlate with cognitive impairment for MPS II.
Figure 6.
Analysis of height velocity in untreated patients or before the start of ERT in boys with Hunter syndrome. Adapted from Parini et al. (Mol Genet and Metab Rep 1; 2014, 5–18) [10].
Figure 5.
Descriptive analysis of first measurements of height, weight, BMI and head circumference in untreated patients or before start of ERT in boys with Hunter syndrome. Adapted from Parini et al. (Mol Genet and Metab Rep 1; 2014, 5–18) [10].
5. MPS III
5.1. Natural history of MPS III
MPS III (Sanfilippo syndrome) is a rare autosomal recessive disorder known for its advanced neurodegeneration accompanied by deteriorating cognition, while physical characteristics are attenuated [12]. The GAG affected is HS. Attenuated symptoms include macrocephaly, mild coarsening of facial features, hepatomegaly, inguinal/umbilical hernias, and osteonecrosis of the hip [12]. Four subtypes of MPS III exist (categorized into A, B, C, or D) depending on which enzyme is lacking [12]. The lacking enzyme creates a build-up of HS, which causes progressive neurodegeneration in the forms of cognitive decline, behavioral issues, and motor impairment [12]. This ultimately causes the death of the patient in the 2nd or 3rd decade of their life.
5.2. Growth impairment in MPS III
In 2013, growth charts for MPS III were reported in The Netherlands [12]. Height, weight, BMI, and head circumference were measured for 118 MPS III patients [12]. Patient birth weights and lengths that were in normal ranges (mean birth length; 50.6 ± 1.7 cm, mean birth weight; 3.5 ± 0.582 kg, mean birth BMI; 13.7 kg/m2) when compared to the healthy controls [12]. Before the age of 6 years, weight and height were in normal ranges, compared with age-matched controls. However, short stature was significant in severe type patients more than 6 years old [12]. The mean height, weight, BMI, and head circumference of adult males with MPS III were 169.7 ± 9.3 cm (−2.0 SD), 60.1 ± 9.9 kg (−1.6 SD), 20.4 ± 2.2 kg/m2, and 57.8 ± 2.1 cm (+0.1 SD) [12]. The mean height, weight, BMI, and head circumference for adult females with MPS III were 165.4 ± 9.9 cm (−0.84 SD), 61.1 ± 11.6 kg (+0.22 SD), 20.2 ± 2.7 kg/m2, and 57.1 cm (+1.0 SD) [12]. For MPS III, disease severity correlated with adult height and neurological impairment.
6. MPS IVA
6.1. Natural history of MPS IVA
MPS IVA (Morquio A syndrome) is an autosomal recessive disease associated with a deficiency in N-acetylgalactosamine-6-sulfate sulfatase (GALNS). The lack of this enzyme causes the build-up of GAGs, chondroitin-6-sulfate (C6S) and keratan sulfate (KS), leading to systemic bone involvement [13]. Patients with MPS IVA appear normal at birth but develop clinical signs of the disease within a few years [13]. However, a formal diagnosis is often not made until 4–5 years of age, even though 70% of affected patients begin to exhibit symptoms within 2–3 years of age [13]. Patients with the severe form of MPS IVA typically survive until their second or third decade of life, while patients with the attenuated form may survive until their seventh decade of life [13]. To enhance the quality of life of the patients, surgical interventions are often needed, beginning when the patients reach their 5th year [14]. By the age of 10, patients have usually received extensive operations in areas such as the neck, hip, knee, and leg [14].
6.2. Growth impairment in MPS IVA
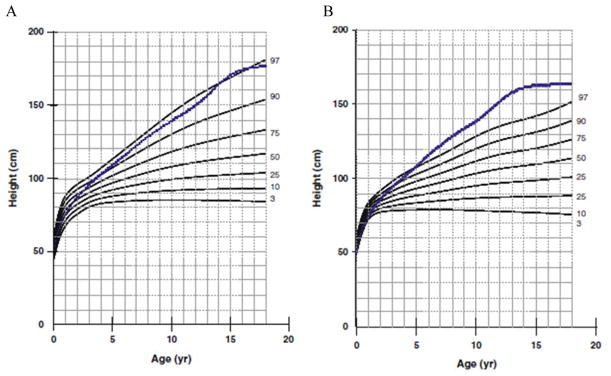
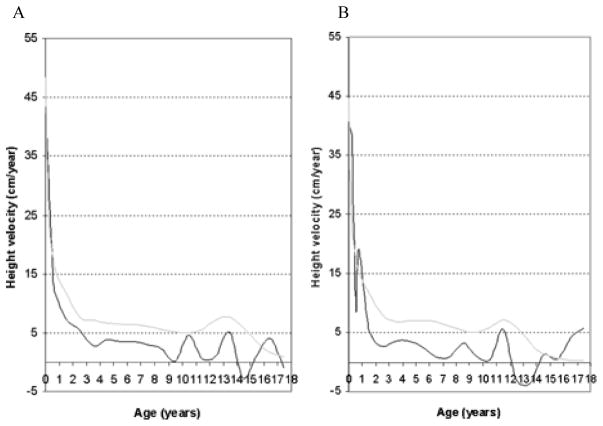
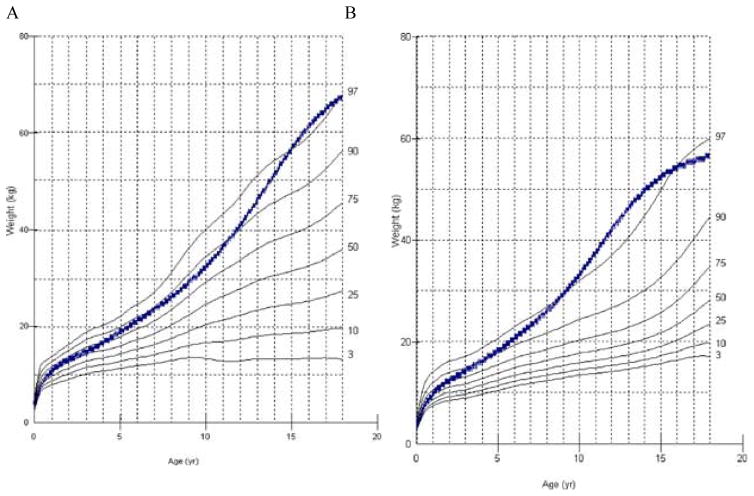
Short stature is more prominent in MPS IVA than other forms of MPS. During early childhood, growth is already diminished, and by the age of 7 or 8 years, growth usually stops [6, 13]. A few patients with the attenuated form of MPS IVA may continue to grow well into their teenage years but are still usually shorter than healthy age-matched controls [13, 15]. The severity of MPS IVA is related to skeletal dysplasia and final height [6, 13]. Determining the growth and physical activity of these patients is imperative for keeping track of how MPS IVA is progressing and responding to any treatment given [6]. Growth charts for MPA IVA were developed over a number of years, with data collected from 1998 to 2007 [13]. A one-center study using cross-sectional and questionnaire-based longitudinal data was used to generate growth curves in 2008 and 2012 [6, 13]. It was noted that impaired growth velocity occurred after patients reached their first year of life [6, 13]. Data were compiled from 388 MPS IVA patients, 193 females and 195 males. Heights of patients over 18 were stable, so data from these patients were assembled into a single group. Mean birth length for girls was 52.1 ± 2.90 cm (+1.1 SD) and 52.4 ± 3.93 cm for boys (+0.9 SD) [6]. By the time the patients were 1 year old, the mean height for boys and girls closely followed those of the healthy controls provided by the CDC (Figs. 7A and 7B). After this age, however, the mean height for both boys and girls falls behind the mean height of normal age-matched controls (Figs. 7A and 7B). For patients 18 years and older, the mean height for the male patients was 119.3 ± 22.6 cm (−8.0 SD), 56.8 cm below that of normal adults. The mean height for the female patients was 113.5 ± 23.1 cm (−7.7 SD), 49.6 cm shorter than normal adults (Figs. 7A and 7B) [6]. Male patients had a higher height velocity during their first 6 months, but this then dropped quickly afterward (Fig. 8A) [6]. Final heights were reached for male patients at 11 years old and for female patients at 12 years old [6]. Mean birth weight for both male (3.56 kg) and female (3.50 kg) patients were similar to mean birth weights of controls (male; 3.5 kg, female; 3.4 kg) (Figs. 9A and 9B). The mean final weight for male and female patients was 36.5 ± 13.2 kg (−3.5 SD) and 35.2 ± 13 kg (−3.1 SD), respectively [6]. However, due to their short stature, BMIs for male and female patients over 18 years old were higher than normal adults, raising concern about patients being overweight (Figs. 10A and 10B) [6]. The mean BMI for male and female adult patients was 24.7 ± 6.1 kg/m2 (+1.3 SD) and 25.6 ± 5.4 kg/m2 (+1.9 SD), respectively 6.8% of male patients and 5.4% of female patients were overweight [6]. This is especially true for patients that rely on a wheelchair for movement.
Figure 7.
Growth charts for length/height (cm) of boys (A) and girls (B) with MPS IVA from birth to 18 years of age (copyright permission from International Morquio Organization). The dotted line shows the 50th centile values for normal boys and girls. Adapted from Tomatsu et al. [6].
Figure 8.
Growth velocity (cm/year) throughout childhood and adolescence of boys (A) and girls (B) with MPS IVA (copyright permission from International Morquio Organization). The gray line shows the height velocity values for normal boys and girls. Adapted from Tomatsu et al. [6].
Figure 9.
Body weight (kg) of males (A) and females (B) with MPS IVA (copyright permission from International Morquio Organization). The dotted line shows the 50th centile values for normal males and females. Adapted from Tomatsu et al. [6].
Figure 10.
Body mass index [weight (kg)/height2 (m2)] for males (A) and females (B) with MPS IVA (copyright permission from International Morquio Organization). The dotted line shows the 50th centile values for normal males and females. Adapted from Tomatsu et al. [6].
7. MPS VI
7.1. Natural history of MPS VI
MPS VI (Maroteaux-Lamy syndrome) is an autosomal recessive disorder caused by the lack of N-acetylgalactosamine-4-sulfatase, leading to the build-up of DS [1, 6]. Primary characteristics of MPS VI are dysostosis multiplex, short stature, and growth failure [16]. Patients look normal and healthy at birth. As patients reach the age of 1 year, they show augmented growth and progressive bone maturation [16]. By the age of 2 years, growth severely decreases if patients have severe phenotypes, and total growth failure is observed at around 5–8 years of age [16]. Abnormal GAG storage in lysosomes creates malfunctions in chondrocytes found within growth plates and induces an excessive inflammatory response, leading to cell death and successive growth impairment [6, 17, 18]. Neurodegeneration is not seen in this disorder. Diagnosis typically occurs during early childhood when symptoms such as corneal clouding, coarse facial features, enlarged tongue, organomegaly, and joint stiffness become apparent.
7.2. Growth impairment in MPS VI
As previously mentioned, MPS VI patients suffer from short stature and growth failure [16]. The first growth charts for MPS VI were developed in 2002 [16]. This study included longitudinal and cross-sectional height for age data from 269 patients aged 0–25 years old [16]. ERT was not available at the time of this study. Height was obtained for 229 of the patients. Patients were separated into slowly progressing and rapidly progressing groups depending on their urinary GAG levels. The slowly progressing group had mean urinary GAG levels of 97.8 μg/mg creatinine while the rapidly progressing group had mean urinary GAG levels of 481.0 μg/mg creatinine [16]. After 4 to 5 years of age growth, the rapidly progressing group slows significantly compared to the slowly progressing group [16]. The median height for 18-year olds in the slowly progressing group is 144.1 cm compared to 109.3 cm) in the rapidly progressing group [16]. The growth of the rapidly progressing group is particularly slow past 10 to 12 years of age [16]. It is important to note that in MPS VI patients, high urinary GAG levels were indicative of low height at all ages [6, 19]. Patients that had urinary GAG levels on the lower end of the spectrum (less than 100 μg/mg creatinine) were observed to be at the lower range of normal height corresponding to their age [6, 19].
8. MPS VII
8.1. Natural history of MPS VII
MPS VII (Sly syndrome) is an extremely rare autosomal recessive disorder caused by a β-glucuronidase deficiency [20]. This deficiency, in turn, affects CS, DS, and HS [20]. The incidence of this disorder is estimated to be between 1 in 300,000 and 1 in 2,000,000 [20]. Due to the low number of documented cases and no living cases being reported in the literature, MPS VII is not understood as well as other forms of MPS; consequently, it is very difficult to gather precise assessments of the intricacies of the disease [20].
Patients with the severe form of MPS VII have mental retardation, hydrops fetalis, and skeletal dysplasia [20]. Patients that are diagnosed with hydrops fetalis at birth may only survive a couple of months. The attenuated form has later onset and normal to near-normal intellect and may survive until their fifth decade of life [20]. However, most patients have some skeletal dysplasia, cognitive impairment, hernias, and hepatosplenomegaly [20].
8.2. Growth impairment in MPS VII
Systemic analyses of growth impairment for MPS VII were first developed in 2016 [20]. Although data from 56 patients were obtained in the study, height was obtained for just 12 patients. No abnormalities in growth were detected in patients under 2 years of age [20]. Mean birth weight for boys was 3.4 ± 0.6 kg (compared to control birth weight of 3.5 ± 0.5 kg) and 2.9 ± 0.7 kg for girls, compared to control birth weight of 3.4 ± 0.4 kg (Z score; −1.0) [20]. The height and weight for adult male patients was 151.8 ± 7.9 cm (Z score; −3.3 compared to controls) and 50.1 ± 13.4 kg (Z score; −2.1) [20]. For adult female patients the severity of short stature was even more extreme; height 114.3 ± 25.4 cm (Z score; −7.8 compared to controls) and 36.2 ± 12.0 kg (Z score; −4.2) [20]. BMIs for both males and females were normal, except for a few outliers [20].
9. Discussion
Growth is used to categorize clinical severity in MPS IVA and VI while cognitive impairment is used for MPS I, II, III, and VII. It is not yet clear why there is no relationship between growth and cognitive impairment in patients with MPS II, but there is with MPS I and III. Growth studies have been performed on three different populations for MPS II (Japanese, Korean, and mixed) but only one for MPS I (Polish) and III (Dutch). More studies are required to determine whether the differences in the relation between height and cognitive function vary due to the ethnic background of patients or a different mechanistic process in the type of MPS. MPS IVA is the form of MPS that shows the most severe growth impairment. We hypothesize that MPS IVA is the most severely affected because the GAGs that accumulate are C6S and KS, both of which directly impact bone growth. C6S and KS are primarily localized to cartilage, and this, in turn, impacts bone [21]. In MPS III, HS is the only GAG that accumulates. This GAG is primarily localized in the extracellular matrix and on the cell surface in visceral organs and brain, perhaps explaining why MPS III is the least severe MPS regarding growth impairment [22, 23]. DS, which accumulates in MPS I, II, VI, and VII, is primarily localized in the skin, but can also be found lungs, heart valves, blood vessels, and tendons [24]. This accumulation causes most of the outward symptoms such as facial coarsening and is why these associated MPSs range in severity depending on other unique factors. DS is the GAG that is accumulated most commonly in MPS I and II. MPS I Hurler patients are shorter than MPS II patients at 2–3 years of age [3]. MPS II patients are taller than age-matched controls up to 4 –5 years of age [6]. The GAG that accumulates in both MPS I and II is DS so this difference in growth characteristics is striking. We hypothesize that differences in the amount and character of the accumulated DS may explain these differences. At birth, MPS I Hurler patients show much higher accumulation of DS than MPS II [25, 26]. This DS accumulation at birth appears to have a major effect on growth of MPS I Hurler patients, whereas the more gradual accumulation in MPS II patients delays the onset of growth impairment.
It is noteworthy that KS is secondarily elevated in blood of patients with MPS I, II, VI, and VII, correlating with the severity of skeletal features [25–30]. KS is a useful biomarker for screening, diagnosis, the degree of skeletal dysplasia, and therapeutic efficacy in bone and cartilage of patients with MPS [31]. Therefore, levels of blood KS can be used to monitor type of MPS, patient age, disease severity, and therapeutic efficacy [31]. MPS I, II, IVA, VI, and VII cannot be distinguished based upon levels of KS alone. Shimada et al. have shown that the ratio of di-sulfated KS levels compared to the ratio of total KS does successfully distinguish MPS IVA from other forms of MPS and controls [31]. Since MPS IVA has a deficiency in the enzyme GALNS (which is directly involved in the metabolism of desulfation of KS), it is natural that KS is elevated in the blood and that di-sulfated KS ratio increases compared with other MPS and controls, resulting in as a good biomarker for the disease [31]. However, for MPS I, II, VI, and VII, the deficient enzymes are not directly involved in the metabolism of KS [31]. The elevation of KS in these forms of MPS must be caused by different mechanisms [28]. The ratio of di-sulfated KS to total KS in blood is age-dependent and increases with age while the ratio of disulfated KS to total KS in MPS IVA patients is more constant at all ages [31]. Due to its ease of detection and ability to track therapeutic response in bone, KS is an important GAG in MPS as a biomarker of skeletal involvement. Accelerated growth is typically observed at birth or until the first year of life for many types of MPS. Within that time-frame, MPS patients are a bit taller, compared to age-matched controls. At this point, we are unsure as to why excessive growth occurs in these patients, further studies are required. We hypothesize that this excessive growth may be due to the different hormonal environment within these patients, and indicators such as chronic disease, inadequate growth or thyroid hormones, social isolation, atypical bone metabolism, and malnutrition can provide clues as to why this phenomenon is seen in MPS patients [6]. MPS II and IVA patients also suffer from a lack of growth spurt when compared to age-matched controls. The growth plate is severely affected and destroyed before pubertal spurt leading to the growth impairment [6]. The bone cannot grow longitudinally because of the destruction to the column structure in the growth plate, and the malfunction and apoptosis of chondrocytes contribute to the lack of a normal growth spurt [6]. Growth hormone may have an initial impact in improving growth in MPS, but typically the final height of patients does not improve. Growth hormone is not deficient in MPS.
Studies on untreated animal models (typically mice) have been performed for MPS I, II, VI, and VII. Mice models with MPS exhibit shorter and sickly cortical bones when compared to wild-type long bones [30]. However, in mouse models growth impairment is not as pronounced as seen in human patients [30]. MPS IVA mice models specifically do not exhibit any clinical signs or symptoms in bone since the synthesis of KS and C6S is limited in rodents and consequently only low amounts accumulate in affected mice.
Since the first natural growth chart for MPS IVA was reported in 2008 by Montano et al., growth charts for MPS II and MPS VI and partial growth records for MPS I and MPS VII have been reported (Table 1). Although these growth charts represent unique character of each type of MPS in growth impairment, there are several limitations of the current charts. 1) Each type of MPS is quite rare, leading to limited number of data points for each individual population. 2) Current available treatments like ERT and HSCT make it more difficult to collect longitudinal measurements and to establish the complete growth chart from birth to adulthood. 3) Collected data vary considerably, containing patients from different and specific ethnic populations or patients from diverse ethnic backgrounds.
Table 1.
Summary of growth in MPS
| MPS | Ethnic Population | Mean Birth Length (cm) | Mean Birth Weight (kg) | Mean Birth BMI (kg/m2) | Mean Final* Height (cm) | Mean Final* Weight (kg) | Mean Final* BMI (kg/m2) | Relationship with Cognitive Impairment |
|---|---|---|---|---|---|---|---|---|
| I | Polish3 (n = 16, all male) | 55.3 ± 3.7 | 3.43 ± 0.7 | 11.2 | - | - | - | Yes |
| II | Japanese10 (n= 111, all male) | 50.31 ± 1.42 | 3.35 ± 0.39 | 13.2 ± 3.29 | 125.63 ± 9.09 | 37.18 ± 8.72 | 29.41 ± 6.15 | No |
| Korean11 (n = 32, all male) | - | - | - | 127.7 (median, n = 7) | - | - | No | |
| Mixed7 (n = 676, all male) | - | - | - | - | - | - | No | |
| III | Dutch13 (n = 118) | 50.6 ± 1.7 | 3.5 ± 0.582 | 13.7 | Males: 169.7 ± 9.3 | Males: 60.1 ± 9.9 | Males: 20.4 ± 2.2 | Yes |
| Females: 165.4 ± 9.9 | Females: 61.1 ± 11.6 | Females: 20.2 ± 2.7 | ||||||
| IVA | Mixed6 (n = 388; 195 males, 193 females) | Males: 52.4 ± 3.93 | Males: 3.56 | Males: 13.0 | Males: 119.3 ± 22.6 | Males: 36.5 ± 13.2 | Males: 24.7 ± 6.1 | N/A |
| Females: 52.1 ± 2.90 | Females: 3.50 | Females: 12.9 | Females: 113.5 ± 23.1 | Females: 35.2 ± 13 | Females: 25.6 ± 5.4 | |||
| Mixed14 (n = 354; 188 males, 166 females) | Males: 52.5 ± 4.0 | Males: 3.59 ± 0.58 | Males: 13.0 | Males: 122.4 ± 21.5 | Males: 37.6 ± 13.4 | Males: 24.7 ± 6.1 | N/A | |
| Females: 52.1 ± 3.0 | Females: 3.5 ± 0.7 | Females: 12.9 | Females: 113.1 ± 22.6 | Females: 35.8 ± 14 | Females: 25.6 ± 5.4 | |||
| VI | Mixed18 (n = 229, male and female) | - | - | - | 130.5 (median) | - | - | N/A |
| VII | Mixed22 (n = 12; 7 males, 5 females) | - | Males: 3.4 ± 0.6 | - | Males: 151.8 ± 7.9 | Males: 50.1 ± 13.4 | Males: 23.5 ± 4.8 | No Data |
| Females: 2.9 ± 0.4 | Females: 114.3 ± 25.4 | Females: 36.2 ± 12.0 | Females: 23.7 ± 0.2 |
18 years or above,
n: number, n: reference
It would be ideal to have growth charts that include patients from the same ethnic and socioeconomic backgrounds for each form of International registries and databases for each MPS, this should help provide better growth charts for comparison purposes. Despite limitations of studies reported in this review, comparison of MPS growth charts with CDC or specific-ethnic normal growth charts lead us to conclude that substantial growth impairment occurs in children with MPS.
In clinical practice, “poor growth” usually predicts “poor health.” While ERT, HSCT, and other approaches are becoming therapeutic options, “poor growth” is defined by careful measurement and comparison of the results to appropriate reference standards from the same patient population. Standard curves established for the general population cannot be adapted to assess the growth of an individual affected by MPS to define the clinical severity and/or therapeutic impact. Therefore, it is critical to develop growth curves specific for each type of MPS. The primary measures should include stature (height or length), body mass (weight), and body proportion (BMI).
10. Conclusions
In all types of MPS, growth impairment including short stature and imbalance of growth is a common feature. It is observed that during childhood growth takes a drastic hit, and stunted growth becomes very noticeable with age during early stages of the disease. The attenuated form of any MPS presents with milder phenotypes but often still show basic growth impairment such as short stature and other skeletal dysplasias. The severe forms, however, present with marked short stature and other skeletal deformities. Skeletal dysplasia for any form of MPS further contributes to the short stature, and neurodegeneration in MPS I, II, III, and VII further worsens the patients’ quality of life (QOL). However, there appears to be no direct correlation between central nervous system (CNS) involvement and growth impairment in MPS II. Depending on the severity of the skeletal dysplasia, patients become wheelchair-bound, making the activity of daily living (ADL) and QOL a major concern. If short stature or other growth impairment is not as severe, ADL and QOL of the patients are less marked. Keeping track of growth through charts gives great insight as to where these untreated patients lie when compared to treated patients and normal healthy controls, and this can later aid in the research that creates treatments to rescue high morbidity and life-threatening issues. Growth charts specific for each type of MPS help physicians and families evaluate the health of an individual affected child, compared with reference data in clinical severity, prognosis, disease stage, and therapeutic efficacy.
Highlights.
The build-up of GAGs in bone and cartilage contributes to various growth impairments.
Documenting height, weight, and BMI is important in keeping track of untreated and treated patients, compared to healthy age-matched controls.
Cognitive impairment does not affect growth in MPS II but does in MPS I and III.
The build-up of C6S and KS synthesized mainly in cartilage accounts for MPS IVA having the most severe growth impairment.
Skeletal disease, including growth impairment, leads to high morbidity and severe handicap for activity of daily living.
Acknowledgments
This work was supported by grants from The Carol Ann Foundation, Angelo R. Cali & Mary V. Cali Family Foundation, Inc., The Vain and Harry Fish Foundation, Inc., The Bennett Foundation, Jacob Randall Foundation, Austrian and Japanese MPS societies, and Nemours Funds. R.W.M. and S.T. were supported by an Institutional Development Award (IDeA) from the National Institute of General Medical Sciences of National Institutes of Health (NIH) under grant number P30GM114736. S.T. was supported by the project for baby and infant in research of health and development to Adolescent and young adult from Japan Agency for Medical Research and development, AMED, under grant number JP18gk0110017. The content of the article has not been influenced by the sponsors.
Footnotes
Conflict of interest: All the authors contributed to this Article and had no conflict of interest with any other party. Melodie Melbouci, Robert W. Mason, Yasuyuki Suzuki, Toshiyuki Fukao, Tadao Orii, and Shunji Tomatsu declare that they have no conflict of interests.
Contributions to the project:
Melodie Melbouci has contributed to the concept and planning of the project, collection of data, data analysis, the draft of the manuscript, and reporting of the work described as the primary author.
Robert W. Mason has contributed to the concept and planning of the project, collection of data, data analysis, the draft of the manuscript, and reporting of the work described.
Yasuyuki Suzuki has contributed to the concept and planning of the project, collection of samples and data, and reporting of the work described.
Toshiyuki Fukao has contributed to the concept and planning of the project, collection of samples and data, and reporting of the work described.
Tadao Orii has contributed to the concept and planning of the project, collection of samples, and reporting of the work described.
Shunji Tomatsu is a Principal Investigator for this project and has contributed to the concept and planning of the project, analysis of data, and reporting of the work described.
References
- 1.Neufeld EF, Muenzer J, Scriver CR, Beaudet AL, Sly WS, Valle D. The mucopolysaccharidoses. The Metabolic and Molecular Basis of Inherited Disease. 2001:3421–3452. [Google Scholar]
- 2.Clarke LA. Mucopolysaccharidosis Type I. In: Adam MP, Ardinger HH, Pagon RA, Wallace SE, Bean LJ, Mefford HC, Stephens K, Amemiya A, Ledbetter N, editors. GeneReviews(®) University of Washington; Seattle, Seattle (WA): 1993. [Google Scholar]
- 3.Różdżyńska-Œwiątkowska A, Jurecka A, Cieślik J, Tylki-Szymańska A. Growth patterns in children with mucopolysaccharidosis I and II. World J Pediatr. 2015;11:226–231. doi: 10.1007/s12519-014-0517-6. [DOI] [PubMed] [Google Scholar]
- 4.Martin R, Beck M, Eng C, Giugliani R, Harmatz P, Muñoz V, Muenzer J. Recognition and diagnosis of mucopolysaccharidosis II (Hunter syndrome) Pediatrics. 2008;121:377. doi: 10.1542/peds.2007-1350. [DOI] [PubMed] [Google Scholar]
- 5.Wraith J, Scarpa M, Beck M, Bodamer O, Meirleir L, Guffon N, Meldgaard Lund A, Malm G, Ploeg A, Zeman J. Mucopolysaccharidosis type II (Hunter syndrome): A clinical review and recommendations for treatment in the era of enzyme replacement therapy. Eur J Pediatr. 2008;167:267–277. doi: 10.1007/s00431-007-0635-4. [DOI] [PMC free article] [PubMed] [Google Scholar]
- 6.Tomatsu S, Montaño AM, Oikawa H, Giugliani R, Harmatz P, Smith M, Suzuki Y, Orii T. Handbook of Growth and Growth Monitoring in Health and Disease. Springer; New York, NY: 2012. Impairment of Body Growth in Mucopolysaccharidoses; pp. 2091–2117. [Google Scholar]
- 7.Bodamer O, Scarpa M, Hung C, Pulles T, Giugliani R. Birth weight in patients with mucopolysaccharidosis type II: Data from the Hunter Outcome Survey (HOS) Mol Genet Metab Rep. 2017;11:62–64. doi: 10.1016/j.ymgmr.2017.02.004. [DOI] [PMC free article] [PubMed] [Google Scholar]
- 8.Patel P, Suzuki Y, Maeda M, Yasuda E, Shimada T, Orii KE, Orii T, Tomatsu S. Growth charts for patients with Hunter syndrome. Mol Genet Metab Rep. 2014;1:5–18. doi: 10.1016/j.ymgmr.2013.10.001. [DOI] [PMC free article] [PubMed] [Google Scholar]
- 9.Cho SY, Huh R, Chang MS, Lee J, Kwun Y, Maeng SH, Kim SJ, Sohn YB, Park SW, Kwon E, Han SJ, Jung J, Jin D. Impact of enzyme replacement therapy on linear growth in Korean patients with mucopolysaccharidosis type II (Hunter syndrome) J Korean Med Sci. 2014;29:254–260. doi: 10.3346/jkms.2014.29.2.254. [DOI] [PMC free article] [PubMed] [Google Scholar]
- 10.Parini R, Jones SA, Harmatz PR, Giugliani R, Mendelsohn NJ. The natural history of growth in patients with Hunter syndrome: Data from the Hunter Outcome Survey (HOS) Mol Genet Metab. 2016;117:438–446. doi: 10.1016/j.ymgme.2016.01.009. [DOI] [PubMed] [Google Scholar]
- 11.Jones SA, Parini R, Harmatz P, Giugliani R, Fang J, Mendelsohn NJ. The effect of idursulfase on growth in patients with Hunter syndrome: data from the Hunter Outcome Survey (HOS) Mol Genet Metab. 2013;109:41–48. doi: 10.1016/j.ymgme.2013.03.001. [DOI] [PubMed] [Google Scholar]
- 12.de Ruijter J, Broere L, Mulder MF, van der Ploeg AT, Rubio-Gozalbo ME, Wortmann SB, Visser G, Wijburg FA. Growth in patients with mucopolysaccharidosis type III (Sanfilippo disease) J Inherit Metab Dis. 2014;37:447–454. doi: 10.1007/s10545-013-9658-3. [DOI] [PubMed] [Google Scholar]
- 13.Montaño AM, Tomatsu S, Brusius A, Smith M, Orii T. Growth charts for patients affected with Morquio A disease. Am J Med Genet Part A. 2008;146A:1286–1295. doi: 10.1002/ajmg.a.32281. [DOI] [PubMed] [Google Scholar]
- 14.Montaño AM, Tomatsu S, Gottesman GS, Smith M, Orii T. International Morquio A Registry: clinical manifestation and natural course of Morquio A disease. J Inherit Metab Dis. 2007;30:165–174. doi: 10.1007/s10545-007-0529-7. [DOI] [PubMed] [Google Scholar]
- 15.Beck M, Glössl J, Grubisic A, Spranger J. Heterogeneity of Morquio disease. Clin Genet. 1986;29:325–331. doi: 10.1111/j.1399-0004.1986.tb01262.x. [DOI] [PubMed] [Google Scholar]
- 16.Quartel A, Hendriksz CJ, Parini R, Graham S, Lin P, Harmatz P. Growth Charts for Individuals with Mucopolysaccharidosis VI (Maroteaux–Lamy Syndrome) JIMD Rep. 2014;18:1–11. doi: 10.1007/8904_2014_333. [DOI] [PMC free article] [PubMed] [Google Scholar]
- 17.Simonaro CM, D’Angelo M, Haskins ME, Schuchman EH. Joint and bone disease in mucopolysaccharidoses VI and VII: identification of new therapeutic targets and biomarkers using animal models. Pediatr Res. 2005;57:701–707. doi: 10.1203/01.PDR.0000156510.96253.5A. [DOI] [PubMed] [Google Scholar]
- 18.Simonaro CM, D’Angelo M, He X, Eliyahu E, Shtraizent N, Haskins ME, Schuchman EH. Mechanism of glycosaminoglycan-mediated bone and joint disease: implications for the mucopolysaccharidoses and other connective tissue diseases. Am J Pathol. 2008;172:112–122. doi: 10.2353/ajpath.2008.070564. [DOI] [PMC free article] [PubMed] [Google Scholar]
- 19.Swiedler SJ, Beck M, Bajbouj M, Giugliani R, Schwartz I, Harmatz P, Wraith JE, Roberts J, Ketteridge D, Hopwood JJ, Guffon N, Sá Miranda MC, Teles EL, Berger KI, Piscia-Nichols C. Threshold effect of urinary glycosaminoglycans and the walk test as indicators of disease progression in a survey of subjects with Mucopolysaccharidosis VI (Maroteaux-Lamy syndrome) Am J Med Genet A. 2005;134A:144–150. doi: 10.1002/ajmg.a.30579. [DOI] [PubMed] [Google Scholar]
- 20.Montaño AM, Lock-Hock N, Steiner RD, Graham BH, Szlago M, Greenstein R, Pineda M, Gonzalez-Meneses A, Çoker M, Bartholomew D, Sands MS, Wang R, Giugliani R, Macaya A, Pastores G, Ketko AK, Ezgü F, Tanaka A, Arash L, Beck M, Falk RE, Bhattacharya K, Franco J, White KK, Mitchell GA, Cimbalistiene L, Holtz M, Sly WS. Clinical course of sly syndrome (mucopolysaccharidosis type VII) J Med Genet. 2016;53:403–418. doi: 10.1136/jmedgenet-2015-103322. [DOI] [PMC free article] [PubMed] [Google Scholar]
- 21.Tomatsu S, Shimada T, Patel P, Mason R, Mikami T, Kitagawa H, Montaño A, Orii T. Chondroitin and keratan sulfate. 2015:17–72. [Google Scholar]
- 22.Nader HB, Ferreira TM, Toma L, Chavante SF, Dietrich CP, Casu B, Torri G. Maintenance of heparan sulfate structure throughout evolution: chemical and enzymic degradation, and 13C-n.m.r.-spectral evidence. Carbohydr Res. 1988;184:292–300. doi: 10.1016/0008-6215(88)80034-x. [DOI] [PubMed] [Google Scholar]
- 23.Dreyfuss JL, Regatieri CV, Jarrouge TR, Cavalheiro RP, Sampaio LO, Nader HB. Heparan sulfate proteoglycans: structure, protein interactions and cell signaling. An Acad Bras Cienc. 2009;81:409–429. doi: 10.1590/s0001-37652009000300007. [DOI] [PubMed] [Google Scholar]
- 24.Trowbridge JM, Gallo RL. Dermatan sulfate: new functions from an old glycosaminoglycan. Glycobiology. 2002;12:25R. doi: 10.1093/glycob/cwf066. [DOI] [PubMed] [Google Scholar]
- 25.Tomatsu S, Okamura K, Maeda H, Taketani T, Castrillon SV, Gutierrez MA, Nishioka T, Fachel AA, Orii KO, Grubb JH, Cooper A, Thornley M, Wraith E, Barrera LA, Laybauer LS, Giugliani R, Schwartz IV, Frenking GS, Beck M, Kircher SG, Paschke E, Yamaguchi S, Ullrich K, Haskins M, Isogai K, Suzuki Y, Orii T, Kondo N, Creer M, Okuyama T, Tanaka A, Noguchi A. Keratan sulphate levels in mucopolysaccharidoses and mucolipidoses. J Inherit Metab Dis. 2005;28:187–202. doi: 10.1007/s10545-005-5673-3. [DOI] [PubMed] [Google Scholar]
- 26.Auray-Blais C, Lavoie P, Tomatsu S, Valayannopoulos V, Mitchell JJ, Raiman J, Beaudoin M, Maranda B, Clarke JTR. UPLC-MS/MS detection of disaccharides derived from glycosaminoglycans as biomarkers of mucopolysaccharidoses. Anal Chim Acta. 2016;936:139–148. doi: 10.1016/j.aca.2016.06.054. [DOI] [PubMed] [Google Scholar]
- 27.Kubaski F, Suzuki Y, Orii K, Giugliani R, Church HJ, Mason RW, Dũng VC, Ngoc CTB, Yamaguchi S, Kobayashi H, Girisha KM, Fukao T, Orii T, Tomatsu S. Glycosaminoglycan levels in dried blood spots of patients with mucopolysaccharidoses and mucolipidoses. Mol Genet Metab. 2017;120:247–254. doi: 10.1016/j.ymgme.2016.12.010. [DOI] [PMC free article] [PubMed] [Google Scholar]
- 28.Tomatsu S, Shimada T, Mason RW, Montaño AM, Kelly J, LaMarr WA, Kubaski F, Giugliani R, Guha A, Yasuda E, Mackenzie W, Yamaguchi S, Suzuki Y, Orii T. Establishment of glycosaminoglycan assays for mucopolysaccharidoses. Metabolites. 2014;4:655–679. doi: 10.3390/metabo4030655. [DOI] [PMC free article] [PubMed] [Google Scholar]
- 29.Tomatsu S, Alméciga-Díaz CJ, Montaño AM, Yabe H, Tanaka A, Dung VC, Giugliani R, Kubaski F, Mason RW, Yasuda E, Sawamoto K, Mackenzie W, Suzuki Y, Orii KE, Barrera LA, Sly WS, Orii T. Therapies for the bone in mucopolysaccharidoses. Mol Genet Metab. 2015;114:94–109. doi: 10.1016/j.ymgme.2014.12.001. [DOI] [PMC free article] [PubMed] [Google Scholar]
- 30.Rowan DJ, Tomatsu S, Grubb JH, Montaño AM, Sly WS. Assessment of bone dysplasia by micro-CT and glycosaminoglycan levels in mouse models for mucopolysaccharidosis type I, IIIA, IVA, and VII. J Inherit Metab Dis. 2013;36:235–246. doi: 10.1007/s10545-012-9522-x. [DOI] [PMC free article] [PubMed] [Google Scholar]
- 31.Shimada T, Tomatsu S, Mason RW, Yasuda E, Mackenzie WG, Hossain J, Shibata Y, Montaño AM, Kubaski F, Giugliani R, Yamaguchi S, Suzuki Y, Orii KE, Fukao T, Orii T. Di-sulfated Keratan Sulfate as a Novel Biomarker for Mucopolysaccharidosis II, IVA, and IVB. JIMD Rep. 2015;21:1–13. doi: 10.1007/8904_2014_330. [DOI] [PMC free article] [PubMed] [Google Scholar]


