Abstract
Tissues with rapid cellular turnover, such as the mammalian hematopoietic system or the intestinal epithelium, are dependent upon stem and progenitor cells, which through proliferation provide differentiated cells to maintain organismal health. Stem and progenitor cells, in turn, are thought to rely upon signals and growth factors provided by local niche cells to support their function and self-renewal. Several cell types have been proposed to provide the signals required for the proliferation and differentiation of the ISC in the crypt1–6. Here, we identify subepithelial telocytes as an important source of Wnt proteins, without which intestinal stem cells cannot proliferate and support epithelial renewal. Telocytes are large but rare mesenchymal cells that are marked by Foxl1 and PDGFRα expression and form a subepithelial plexus that extends from the stomach to the colon. While supporting the entire epithelium, Foxl1+ telocytes compartmentalize the production of Wnt ligands and inhibitors to enable localized pathway activation. Conditional gene ablation of Porcupine (Porcn), which is required for functional maturation of all Wnt proteins, in Foxl1+ telocytes causes rapid cessation of Wnt signaling to intestinal crypts, followed by loss of stem and transit amplifying cell proliferation and impaired epithelial renewal. Thus, Foxl1+ telocytes are an important source of niche signals to intestinal stem cells.
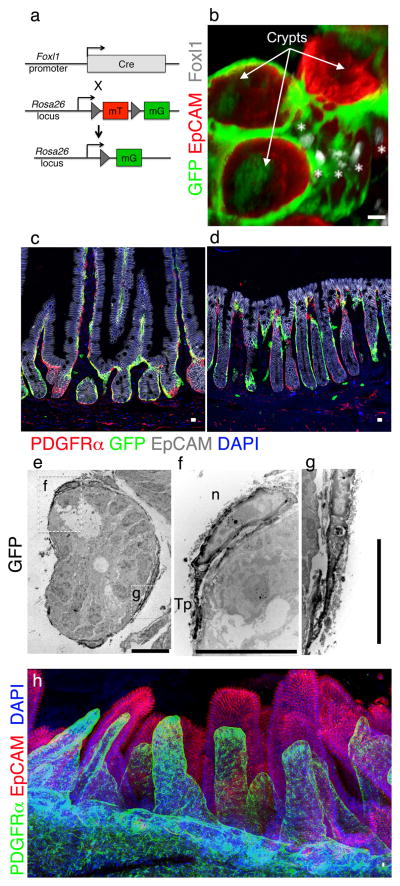
Following the cloning of the winged helix transcription factor Foxl1, previously known as Fkh67, initial expression profiling focused on measuring its steady-state mRNA levels, both by RNase protection assays and by in situ hybridization8,9. Foxl1 transcripts were found at low levels in the adult stomach and intestine, and by in situ hybridization in about one to two cell layers of the mesodermal tissue surrounding the primitive fetal gut tube. In order to visualize subepithelial Foxl1-expresing cells in their entirety, we used the Foxl1-Cre transgenic line10 in conjunction with genetic lineage labeling using the Rosa26-mTmG allele11. In this model, Cre-marked cells produce a membrane-targeted version of green fluorescent protein (GFP), which allows for the mapping of the size and location of Foxl1-expressing cells (Fig. 1a). Fig. 1b shows an example of duodenal crypts, where Foxl1-expressing cells, identified both by nuclear Foxl1+ staining (white) and membranous GFP expression (green), are in close contact with the entire crypt base, identified by EpCAM staining (red). Foxl1+ cells are large, flat cells with cytoplasmic processes in excess of 100 micrometers. Cells with these properties, i.e. very large mesenchymal cells with extended cell bodies, were identified previously by electron microscopy and termed “telocytes”, with the long processes termed “telopodes”12,13.
Figure 1. Foxl1+ cells are telocytes and co-express PDGFRα.
(a) Schema for labeling Foxl1+ cells with GFP. (b) Foxl1-Cre-driven GFP is restricted to pericryptal mesenchymal telocytes. Immunofluorescence staining for Foxl1 (white, see asterisks), GFP (green), EpCAM (red) on cleared mouse whole duodenum. (c,d) Immunofluorescence for GFP (green) and PDGFRα (red) in the duodenum (c) and colon (d). (e–g) GFP immuno-electron microscopy of Foxl1-Cre;Rosa-mTmG duodenal crypt (transverse section). (f) Inset showing the telocyte nucleus and its extension, the telopode. n; nucleus, Tp; telopode. (g) Inset of contact between two telopodes. (h) Confocal imaging of cleared mouse whole small intestine. PDGFRα (green) and EpCAM (red). Experiments were repeated for at least three times with similar results. Scale bars represent 10μm.
Intestinal telocytes express platelet-derived growth factor receptor alpha (PDGFRα)14. PDGFRα staining overlapped with Foxl1-Cre-induced GFP, further supporting the notion that these cells are intestinal telocytes (Fig. 1c,d), although PDGFRα is also present in numerous cells deeper in the submucosa that do not express Foxl1. Immuno-electron microscopy confirmed that Foxl1+ cells form long telopodes that encompass all crypt cells, and are separated from the epithelium by sub-micron distances (1e–g).
In order to gain a better understanding of the three-dimensional nature of the Foxl1+ telocyte network, we performed confocal imaging of immunofluorescently stained jejunum following tissue clearing. Foxl1/PDGFRα-positive telocytes form a plexus that supports the entire epithelium, visualized by EpCAM staining (Fig. 1h and Supplementary Video). Thus, Foxl1/PDGFRα-positive telocytes maintain a subepithelial sheath that is juxtaposed to the epithelium, and therefore in an ideal position to act as a niche to provide signals to the stem and progenitor cells in the intestinal crypt.
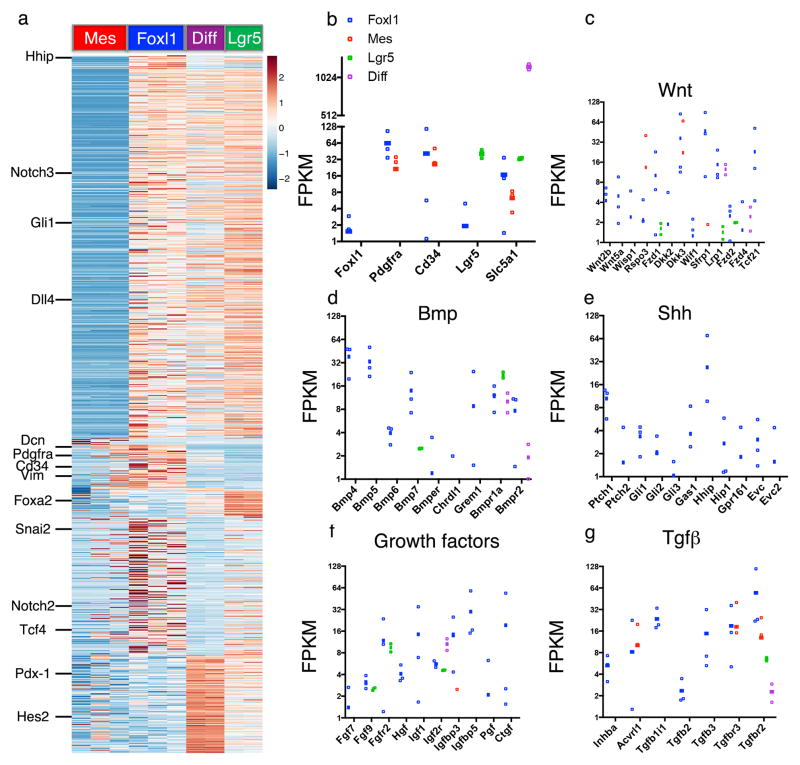
For the molecular characterization of Foxl1+ telocytes, we sorted cells based on Foxl1Cre;Rosa-mTmG activity (Extended Data Fig. 1) followed by RNAseq analysis, and compared them to the expression profiles of Foxl1− mesenchymal cells, Lgr5+ stem cells (sorted on Lgr5-eGFPHigh, 15) and epithelial enterocytes (Fig. 2a). Note that while Foxl1+ cells express high levels of Pdgfrα and Cd34, these two genes are also active in Foxl1− cells, confirming our observation from immunostaining and genetic lineage tracing that Foxl1+ cells constitute a small subset of Pdgfrα-positive cells. Remarkably, Foxl1+ telocytes express high levels of multiple regulators - both activators and repressors - of key signaling pathways, such as Wnt, Shh, Bmp, and Tgfβ (Fig. 2b–g). While the Wnt ligands Wnt2b and Wnt5a are specifically expressed in Foxl1+ telocytes, the Wnt signaling enhancer and Lgr5 ligand R-spondin3 is produced by both Foxl1+ telocytes and Foxl1− mesenchymal cells (Fig. 2c; Extended Data Table 1). Interestingly, Foxl1+ telocytes also express the Wnt inhibitors Dkk3 and sFRP1. Similarly, Foxl1+ telocytes express Bmp4, Bmp5, Bmp6, Bmp7 as well as the Bmp inhibitors chordin-like1 and gremlin1 (Fig. 2d).
Figure 2. Telocytes express key signaling molecules.
RNAseq analysis of Foxl1+ cells (n=3 biologically independent animals) compared to Foxl1− mesenchymal cells (n=3 biologically independent animals), Lgr5+ stem cells (n=2 biologically independent animals), and differentiated enterocytes (n=2 biologically independent animals). (a) Heatmap showing hierarchical clustering. Only genes with a fold-change > 10 in pairwise comparisons and an FDR < 2% were used for the analysis. Values are normalized z-scores, plus or minus standard deviation. (b–g) Selected markers showing differential expression: (b) Foxl1, Pdgfra, Cd34 (telocyte markers), Lgr5 and Slc5a1, (c) Wnt pathway, (d) Bmp pathway, (e) Shh pathway, (f) Growth factors, (g) Tgfβ pathway. Data are shown as FPKM. Error bars indicate SEM.
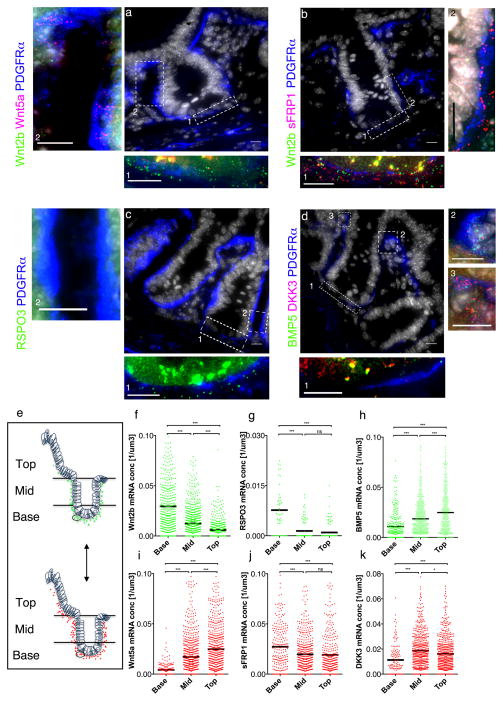
The results of the expression profiling of Foxl1+ telocytes summarized above present an apparent paradox. How can Foxl1+ telocytes provide Wnt ligands to activate Wnt signaling in intestinal crypts if they also produce Wnt pathway inhibitors? We speculated that there might be a regional differentiation of the transcriptome of Foxl1+ telocytes according to their position along the crypt-villus axis. In order to test this hypothesis, we performed single-molecule RNA-FISH (fluorescence in situ hybridization) for activators (Wnt2b, Wnt5a, and R-spondin 3) and inhibitors (sFRP1 and DKK3) of the Wnt signaling pathway, and BMP5, which signals via activation of the SMAD signaling cascade. We labeled telocytes by immunostaining for PDGFRα, as Foxl1 itself is a nuclear protein and thus does not show the full extent of the cells. As shown in Fig. 3a, telocytes express both Wnt2b, activator of canonical Wnt signaling, and Wnt5a, which acts via the planar cell polarity pathway. However, the localization of the two mRNAs is clearly distinct, with Wnt2b enriched at the bottom of the crypts where Lgr5+ stem cells are situated, and Wnt5a mRNA present near the crypt villus junction. Likewise, there is a striking pattern of co-expression of Wnt2b with sFRP1, a secreted frizzled protein that acts as a decoy receptor to limit Wnt signaling at the bottom of the crypt, while towards the crypt-villus junction, sFRP1 message predominates, as the density of Wnt2b mRNA molecules decreases (Fig. 3f,j). RSPO3, an important co-activator of the Wnt-pathway, is present in telocytes only at the bottom of the crypt, but missing further up the crypt-villus axis (Fig. 3c). In contrast, the Wnt signaling inhibitor DKK3 as well as BMP5 are present at higher levels near the crypt-villus junction than the crypt base (Fig. 3d).
Figure 3. Telocytes compartmentalize signaling molecule mRNAs for localized signaling.
(a–d) Cryosections of mouse duodenum stained for PDGFRα (blue), DNA (gray), and hybridized with single-molecule FISH probes as indicated. Insets ‘1,2,3’ represent large magnification of selected areas. (e) For mRNA quantification, fluorescence signals were counted per defined area along the crypt-villus axis. (f–k) mRNA molecules per cubic micron along the crypt-villus axis. Experiments were repeated for at least three times with similar results. Scale bars represent 10μm. Black bars represent the mean values. ***P < 0.001, *P < 0.1 ordinary one-way ANOVA multiple comparison with nonparametric Kruskal-Wallis test.
Next, we quantified the density of the transcripts for these signaling mediators in telocytes, subdivided by their position along the crypt villus axis (Fig. 3e–k). Expression of Wnt2b and RPSO3 was much higher in telocytes at the crypt base than at the villus tip (Fig. 3f,g), while expression of DKK3 was increased towards the villus tip (Fig. 3k), and sFRP1 expression was only marginally location dependent (Fig. 3.j). BMP5 and Wnt5a expression was elevated towards the crypt-villus junction and villus tip, suggesting that the planar cell polarity pathway and BMP signaling are more active crypt-distally. These data indicate that telocytes compartmentalize transcripts depending upon their position along the crypt/villus axis to locally promote proliferation by maintaining a higher Wnt:sFRP ratio near the crypt base than at the villus epithelium. To obtain independent validation of transcriptome specialization among Foxl1+ telocytes, we also performed single cell qRT-PCR analysis for key genes on FACS-sorted Foxl1Cre;Rosa-mTmG GFP-positive cells and identified clearly distinct expression profile subtypes among Foxl1+ cells (Extended Data Fig. 2). Future studies will have to determine if these are temporal states dependent on telocyte migration along the radial crypt-villus axis, or whether they represent permanent telocyte subtypes.
To address the question of whether Wnt production by Foxl1+ telocytes is important for intestinal stem cell activity, we derived a Foxl1-CreERT2 mouse line to enable temporally controlled gene ablation in this cell type (Extended Data Fig. 3a). To confirm that the Foxl1-CreERT2 transgene, which is based on the same 170kb bacterial artificial chromosome transgene we employed previously to obtain faithful reproduction of the Foxl1 gene expression pattern10, is active in subepithelial telocytes, we crossed these mice to Rosa26-mTmG reporter mice (Extended Data Fig. 3b,c) and treated them with tamoxifen to induce Cre activity. In both small and large bowel, Foxl1-CreERT2 was active in subepithelial telocytes as intended.
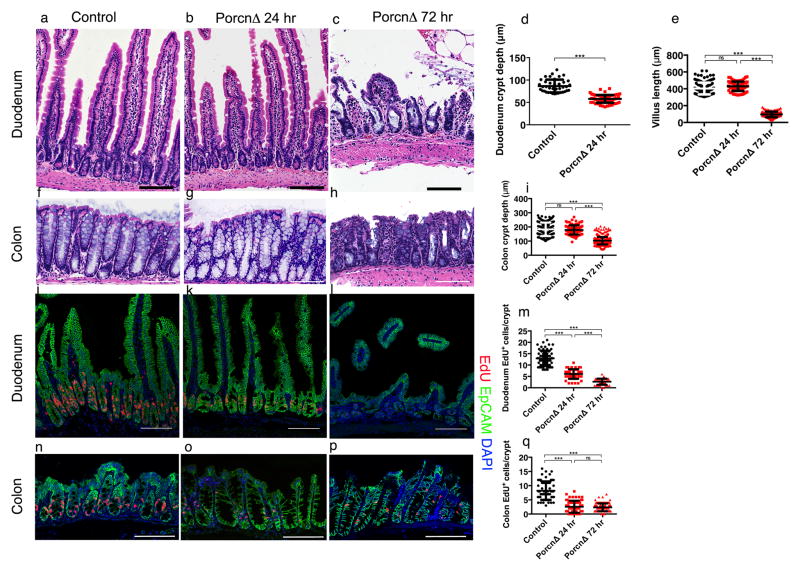
Next, we crossed Foxl1-CreERT2 mice with mice carrying a floxed allele of the X-linked Porcn gene16, to obtain PorcnloxP/Y; Foxl1-CreERT2 mice (hereafter referred to as PorcnΔ, Extended Data Fig. 3d). This model enables conditional ablation of all Wnt secretion from Foxl1-expressing telocytes. We analyzed PorcnΔ mice after 24 and 72 hours of tamoxifen treatment. Strikingly, while epithelial morphology was normal at the 24 hour time-point (Fig. 4a,b,f,g), stem and progenitor cell proliferation in duodenal and colonic crypts was already dramatically reduced, as determined by labeling cells in S-phase with a short pulse of the thymidine analogue EdU (Fig. 4 j,k,m,n,o,r). Consequently, duodenal crypt depth was significantly reduced even after one day of Porcupine ablation (Fig. 4d). After three days of tamoxifen treatment, PorcnΔ showed dramatic changes in the epithelial architecture in both the small and large intestine (Fig. 4 c,h), which we attribute to lack of resupply of the epithelium with newly differentiated cells from the crypts. Epithelial proliferation rates were reduced even further at this time point (Fig. 4 l,m,p,r). As a result, the length of the villi was reduced in the duodenum (Fig. 4c,e), and epithelial cells appeared abnormal in colonic crypts (Fig. 4h), which also exhibited a significant reduction in depth (Fig. 4i). Thus, eliminating Wnt secretion from Foxl1+ telocytes results in a dramatic and highly significant reduction of epithelial cell proliferation in the small and large intestine.
Figure 4. The intestinal epithelium depends on Wnts secreted from Foxl1+ telocytes.
(a–c) Control and PorcnΔ mutant duodenum, one and three days post tamoxifen injection. Experiments were repeated for at least three times with similar results. (d,e) Duodenal crypt depth (Control n=3 biologically independent animals, PorcnΔ 24hr n=3 biologically independent animals) and villus length (Control n=9 biologically independent animals, PorcnΔ 24hr n=3 biologically independent animals, PorcnΔ 72hr n=7 biologically independent animals,, ***P < 0.001, unpaired two-tailed t test) (f–h) Control and PorcnΔ mutant colon, one and three days post tamoxifen injection. Experiments were repeated for at least three times with similar results. (l) Colonic crypt depth (Control n=7 biologically independent animals, PorcnΔ 72hr n=3 biologically independent animals, PorcnΔ 72hr n=7 biologically independent animals, ***P < 0.001, unpaired two-tailed t-test). (j–l,n–p) EdU incorporation (red) in the epithelium (EpCAM, green) of duodenum and colon. Experiments were repeated for at least three times with similar results. (m) Proliferating cells per duodenal crypt. (n=3 biologically independent animals per group ***P < 0.001, unpaired two-tailed t test). (r) Proliferating cells per colonic crypt. (n=3 biologically independent animals per group ***P < 0.001, unpaired two tailed t-test). Center line indicate mean and Error bars indicate SD, Scale bars 100μm.
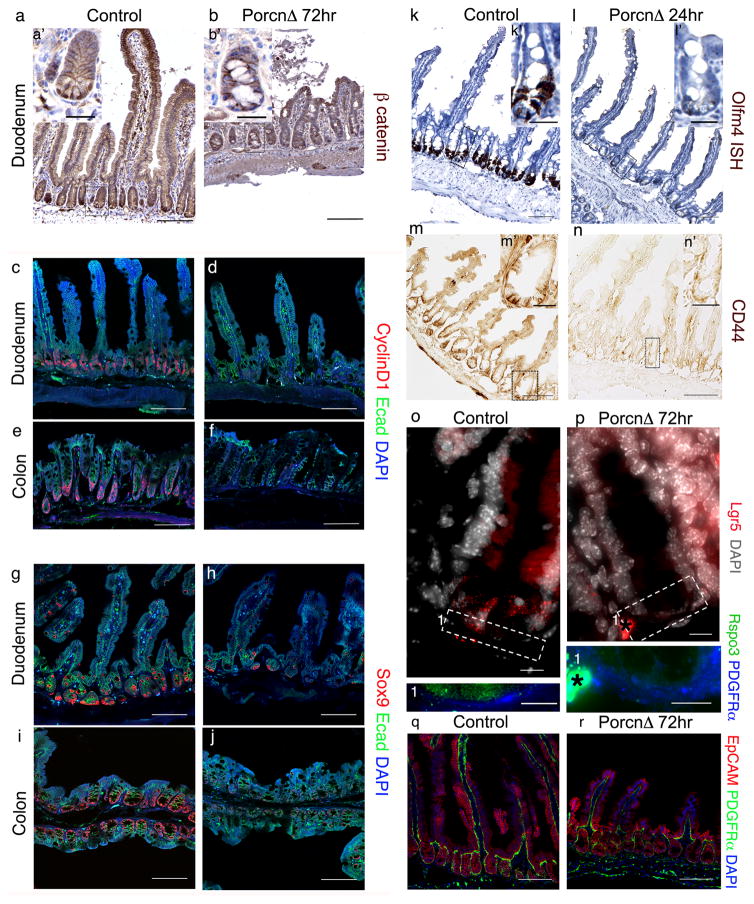
In order to test directly if Foxl1+ telocytes are a relevant source of Wnt signals to the intestinal crypt, we stained control and PorcnΔ intestines for the presence of nuclear β-catenin, a marker of active Wnt signaling, as well as CyclinD1 and Sox9, proteins encoded by direct β-catenin target genes. As shown in Fig. 5 a and b, while the control duodenum showed the typical distribution of β-catenin protein at the adherens junctions of all epithelial cells, and in the nuclei of cells with active Wnt signaling in the crypts, the PorcnΔ intestine had lost nuclear β-catenin protein. Likewise, expression of CyclinD1 and Sox9 was reduced dramatically in the duodenum and colon of PorcnΔ mice (Fig. 5c–j). Indeed, we found that expression of Olfm4, Lgr5, and CD44, all markers of stem cells in the crypt base17,18, was lost as early as 24 hours following Porcupine ablation (Fig. 5k–p). Taken together, these findings demonstrate that Foxl+ telocytes are necessary for Wnt pathway activation and proliferation in intestinal stem and progenitor cells. Recently, Yan and colleagues used systemic administration of ligand-specific pharmacological perturbations to conclude that Wnt and R-spondin ligands represent non-equivalent ligand families that are cooperating to maintain intestinal stem cells, with the former having a ‘priming’ and the latter driving stem-cell expansion 19. Therefore, we evaluated if Wnt production by Foxl+ telocytes might indirectly influence R-spondin gene expression. Remarkably, we found R-spondin 3 mRNA levels reduced in telocytes in the PorcnΔ intestine (Fig. 5 o,p). Telocytes were still present even after 72 hours of Porcn gene ablation (Fig. 5 q,r), suggesting the possibility that reciprocal signaling from the epithelial compartment might be responsible for maintaining R-spondin 3 gene expression. In sum, sub-epithelial Foxl1+ telocytes contribute important Wnt signals to intestinal crypt cells to main their proliferation and allow for homeostatic renewal of the intestinal epithelium.
Figure 5. Foxl1+ telocytes provide essential Wnt ligands to the intestinal stem cell compartment.
(a,b) Wnt pathway activation analyzed by immunohistochemistry for β catenin (brown). Insets a′ and b′ at high magnification. (c–j) Immunofluorescence staining of the Wnt targets CyclinD1 and Sox9. (k–n) Stem cell markers Olfm4 (in situ hybridization) and CD44 (immunohistochemistry) one day post induction in PorcnΔ duodenum. Insets k′, l′, m′, n′ represent high magnification. (o,p) Expression of Lgr5 and Rspo3 as detected by single molecule RNA-FISH three day post induction in PorcnΔ duodenum. * denotes a staining artifact. (q,r) Immunofluorescence for EpCAM and PDGRFα in duodenum of control and PorcnΔ mice. Experiments were repeated for at least three times with similar results. Scale bars 100 μm (a–n) and 25 μm in insets
Methods
Derivation of Foxl1-CreERT2 mice
Foxl1-CreERT2 mice for tamoxifen-inducible gene ablation of loxP-flanked targets were derived by introducing a CreERT2 cassette, cloned from K18iresCreER-T2 plasmid (Addgene plasmid #44580;20, into the coding region of the mouse Forkhead box l1 (Foxl1) gene in the bacterial artificial chromosome (BAC) RP23-446J14 by means of BAC recombineering as described previously 10. The targeting primers were as follows:
-
Forward: ctccccggtggagcggagaggctgctgtcgccatgagccacctcttcagtaagccagcagaagcagggtac;
Reverse: agcactgtggcctcgggaacctgcagaggaaaataagaaaggaagggaatctaggaatctagtgctcccaaagggtacctgc.
The resulting Foxl1-CreERT2 BAC DNA was linearized and microinjected into fertilized oocytes. The positive transgenic founders were identified by genomic polymerase chain reaction (PCR), and the fidelity of transgene expression was tested by crossing Foxl1-CreERT2 transgenic mice to the Rosa-mTmG reporter line 11,21 and visualizing fluorescent protein expression in tissue sections (Supplementary Fig. 5b,c).
Derivation of Foxl-CreERT2; PorcnΔ, Foxl1-CreERT2;Rosa26mTmG,, Foxl1Cre; Rosa26mTmG mice
Foxl1-CreERT2 mice were crossed to Porcn-ex3-7Neo-flox16, Rosa-membrane-targeted dimer tomato protein/membrane-targeted green fluorescent protein (mG) 11, or Rosa-YFP21 mice to obtain Foxl1-CreERT2;PorcnΔ, Foxl1-CreERT2;Rosa-mTmG, or Foxl1-CreERT2;Rosa-YFP mice. Non-inducible Foxl1Cre 10 mice were also crossed to Rosa-YFP and Rosa-mTmG reporter lines (Jackson Laboratories). The animal experiments were conducted under a protocol approved by the University of Pennsylvania Institutional Animal Care and Use Committee.
Tamoxifen Treatment
For Foxl1-CreERT2;PorcnΔ and control (Foxl1-CreERT2;Rosa-YFP or Foxl1-CreERT2;Rosa26mTmG) mice, tamoxifen (Sigma-Aldrich Cas#10540-29-1) was dissolved in corn oil at a concentration of 30mg/ml by shaking overnight at 37°C and administered intraperitoneally at 75mg tamoxifen/kg body weight. Mice were injected on three consecutive days and killed on day 4, corresponding to 72 hours of tamoxifen treatment, or day 2, corresponding to 24 hours tamoxifen treatment.
EdU Treatment
For EdU treatment, 10μM EdU solution was performed intraperitoneally two hours before killing of the mice, and EdU detection was according to the manufacturer’s protocol (Click iT Plus EdU Alexa fluor ® 555 imaging kit C 10638 Molecular Probes).
Fluorescence Activated Cell Sorting, RNA Isolation and Sequencing Library Preparation
Isolation of Foxl1+ cells using fluorescence-activated cell sorting was performed using Foxl1-Cre;Rosa-YFP and Foxl1-Cre;Rosa-mTmG mice. Small intestines were dissected and washed thoroughly with Hank’s balanced salt solution (HBSS) and were incubated in 5mM EDTA/HBSS for 10 minutes in 4°C. Intestinal villi were scraped off using a coverslip and the remaining tissue was cut into small pieces and incubated in 5mM EDTA and HBSS on ice for 10 minutes while pipetting to completely remove the remaining epithelium. After vigorous washes, the remaining mesenchymal fraction was incubated with 6 mg/mL Dispase II/0.05% trypsin solution (Sigma-Aldrich,#04942078001) supplemented with DNaseI 1u/ml (Invitrogen) at 37°C, until solution became cloudy and the mesenchyme was dissociated (15 minutes). Supernatant was filtered through a 70μm strainer centrifuged and resuspended with anti CD45-APC and anti EpCAM-APC antibodies solution (1:300; Biosciences, 1:100; BioLegend, respectively in 10%FBS/5mM EDTA/HBSS) for 45min at RT to exclude immune and epithelial cells contamination from sorting. A single-cell suspension was obtained by filtrating the supernatant through a 40μm strainer and washing with 5mM EDTA in HBSS, before cell sorting using a BD influx instrument (BD Biosciences, San Jose, CA). For RNA isolation, GFP+ and Tomato+ cells for Foxl1+ and Foxl1− mesenchymal cells, respectively, were lysed and total RNA was isolated by column purification (Absolutely RNA Nanoprep Kit; Agilent Technologies). cDNA was synthesized and amplified using Ribo-SPIA technology (Ovation RNA-Seq System V2 #7102 NuGEN). cDNA was sonicated and an mRNA sequencing library was prepared using the NEBNext RNA library prep kit (New England BioLabs, Inc). All libraries were sequenced on the Illumina Hiseq 2500 with 100-bp single end reads. Median read depth was 27 million reads per sample.
RNA-seq analysis
RNA-seq was aligned to mm9 using RUM22 with default parameters. For comparison Lgr5+ and differentiated enterocyte data sets were used from Sheaffer et al.,15. Differential expression was performed using edgeR23. For heatmap analysis, differentially expressed genes were selected by comparisons of Foxl1+ population with the other populations with 1% FDR cut-off and fold change of two. Genes were ranked by their relative fold change.
Single cell sorting and qPCR analysis
Single Foxl1+ cells were sorted into 96-well plates with 5μl of lysis buffer. Cell lysis, reverse transcription, gene-specific preamplification (22 cycles) and downstream qPCR quantification was performed according to manufacturer’s instruction (Fluidigm BiomarkTM HD, 68000088 K1). A total of 179 cells and 39 genes were analyzed in the experiment. Outliers were removed using the identifyOutliers function from SINGuLAR software with detection limit set to 24 cycles (Fluidigm PN100-5066 F1). The expression values (Log2Ex) for each gene was computed according to SINGuLAR user manual (Fluidigm PN100-5066 F1). For hierarchal clustering, genes were clustered by the Pearson Correlation method; while cells were measured by their Euclidean distance and clustered by the ward. D method, all implemented by the hclust function in R. To assess the stability of clusters, we applied the clusterboot algorithm from the fpc package to calculate Jaccard coefficient based on 1,000 bootstrapping24.
Transmission electron microscopy
Foxl1Cre;Rosa-mT/mG and C57BL/6 control mice were used for immune-electron microscopy. The ileum was dissected and fixed for 2 hours in 4°C with paraformaldehyde/lysine/periodate (PLP) fixative25. After washing with phosphate-buffered saline, the specimens were sectioned with a vibratome to 70μm thickness and blocked with Protein Blocking Agent (StartingBlockTM T20 PBS Blocking Buffer Thermo Scientific #37539) for 30 minutes at room temperature, and then incubated in the presence of an anti-GFP antibody (1:100, Abcam ab6673) at 4°C over night. After washing, the samples were incubated in the presence of horseradish peroxidase (HRP) biotinylated anti-goat secondary antibody, and the signal was developed using 3,3-diaminobenzidine tetra hydro-chloride (DAB) as a substrate. The ultra-thin sections were examined under a JEOL 1010 electron microscope fitted with a Hamamatsu digital camera and AMT Advantage image capture software.
Histology
For hematoxylin and eosin (H&E) staining, paraffin tissue sections were rehydrated, incubated in hematoxylin for 5 minutes, rinsed in water, dipped quickly in 1% acid ethanol, and washed in water. Tissues then were immersed in 0.2% Ammonium Hydroxide, rinsed in water, dipped in eosin for 40 seconds, and briefly rinsed in water before dehydration and mounting.
Imunofluorescence and Immunohistochemistry
After euthanasia, mouse intestines were rinsed in PBS and fixed with 4% paraformaldehyde overnight, rinsed in PBS, and either dehydrated for paraffin embedding or immersed in 30% sucrose for 4 hours at 4°C, embedded in optimum cutting temperature compound (OCT Tissue-Tek), and frozen for cryosectioning. Antigen retrieval was performed using citrate buffer, pH 6.0, with a pressure cooker (PickCell Laboratories, Agoura Hills, CA). Foxl1 staining required the use of cryosections, antigen retrieval, and amplification of signal using tyramide (TSA systems; PerkinElmer, Waltham, MA) as previously described 6. CD44 immunohistochemistry was performed as described previously26. Antibodies used were as follows: rabbit Sox9 (1:300; Millipore AB5535, Temecula, CA), guinea pig Foxl1 (1:1,500), goat GFP (1:200; Abcam AB6673, Cambridge, MA), mouse E-cadherin (1:250; BD Transduction 610182, Franklin Lakes, NJ), mouse β-catenin (1:200; BD Transduction 610153), rabbit EpCAM (1:100; Abcam ab71916) goat PDGFRα (1:100; R&D AF1062), Rat CD44var (v6) (1:100; Biosciences BMS145). Cy2-, Cy3-, and Cy5-conjugated donkey secondary antibodies were purchased from Jackson ImmunoResearch Laboratories, Inc. For immunohistochemistry, horseradish peroxidase conjugated antibodies were incubated for 2 hours at room temperature and 3,3-diaminobenzidine tetra hydro-chloride (DAB) was used as a substrate for the development of the signal. For the studies requiring quantification, an n=3 per genotype or condition was chosen based on the severity of the phenotype observed in pilot experiments. Animals were assigned to condition by genotype and were age-matched mice from the same colony. The investigator counting the number of EdU positive cells or quantifying villus length or crypt depth was blinded to the genotype of the mice.
Clearing of adult mouse intestine with X-CLARITYTM
Foxl1 Cre; Rosa-mTmG and C57BL/6 adult mice were anesthetized, intestine was dissected and fixed in 4%PFA for 24hr at 4°C. Following washes with PBS for another 24hr at 4°C, the intestine was incubated in Hydrogel solution for 24hr at 4°C 27. After 3hr at 37°C, the hydrogel-embedded intestine was placed in an X-CLARITYTM ETC chamber (LOGOS biosystems) for electrophoretic tissue clearing for 7hr. The cleared intestine was immunostained with goat anti-GFP (1:100; Abcam) or PDGFRα (1:100; R&D) and APC-conjugated anti-mouse EpCAM (1:100 Biolegend) or rabbit anti-EpCAM (1:100; Abcam). For Foxl1 antibody staining, following clearing an antigen retrieval in citrate buffer was performed (as described above). Primary and secondary antibodies were incubated for 48hr at 4°C each. The stained intestine was placed en block on an image slide using 1mm depth adhesive silicone isolator, mounted in X-CLARITYTM mounting solution and imaged using confocal scanning. Z-stacks projections were compiled using Volocity software.
Single Molecule FISH and Immunofluorescence
Libraries of 48 probes each were design against the mouse Wnt2b, Wnt5a, sFRP1, Rspo3, BMP5 and Dkk3 mRNAs (Stellaris® RNA FISH probes Biosearch Technologies). Hybridization conditions and imaging were as described previously 28,29, except for the addition of immunofluorescence detection of PDGFRα. For immunofluorescence, a goat anti-PDGFRα antibody was diluted in hybridization buffer (1:100) added to the FISH probes, and incubated overnight at 30°C. Secondary antibody Cy2-conjugated donkey anti-goat (1:200) was added to glucose oxidase (GLOX) buffer for 20 minutes in room temperature. smFISH imaging was performed on a Nikon-Ti-E inverted fluorescence microscope with a 100x oil-immersion objective and a Photometrics Pixis 1024 CCD camera using MetaMorph software as previously described28,30. Single cell segmentation and automatic transcript quantification were performed in a custom Matlab program (MATLAB Release 2013b, the Mathworks Inc., USA) using TransQuant software31. Images were filtered with a Laplacian of Gaussian filter of size 15 pixels and standard deviation of 1.5 pixels32.
Olfm4 mRNAs in-situ hybridization
In situ hybridization for Olfm4 mRNA was performed using the RNAscope kit (Advanced Cell Diagnostics) according to the manufacturer’s instructions.
Data Availability Statement
RNAseq data that support the findings of this study have been deposited in NCBI’s GEO under accession code GSE94072. Source data for figures 2, 3 and 4 are provided with the paper.
Extended Data
Extended Data Fig. 1. Fluorescence-activated cell sorting plots.
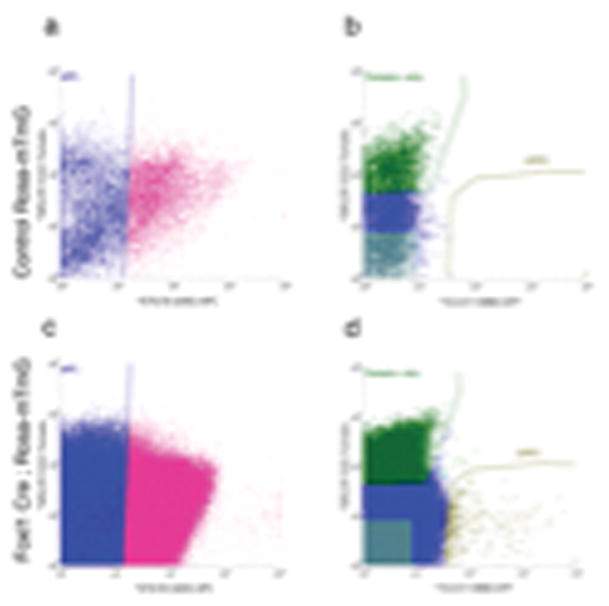
(a–d) Representative FACS plots of mesenchymal cells isolated from Foxl1 Cre; Rosa-mTmG (c–d) as compared to control Rosa-mTmG (a–b) mice, showing sorting strategy.
(a,c) Allophycocyanin+ (APC+) CD45+ and EpCAM+ labeled cells were gated out to exclude immune and epithelial cell contamination. (d) Foxl1+, GFP+ and Foxl1− Tomato+ cells were gated and sorted based on fluorescence activity as compare to the negative control (b). Experiments were repeated for at least three times with similar results.
Extended Data Fig. 2. Single Cell qPCR of Foxl1+ telocytes showing heterogeneity within Foxl1+ cell population.
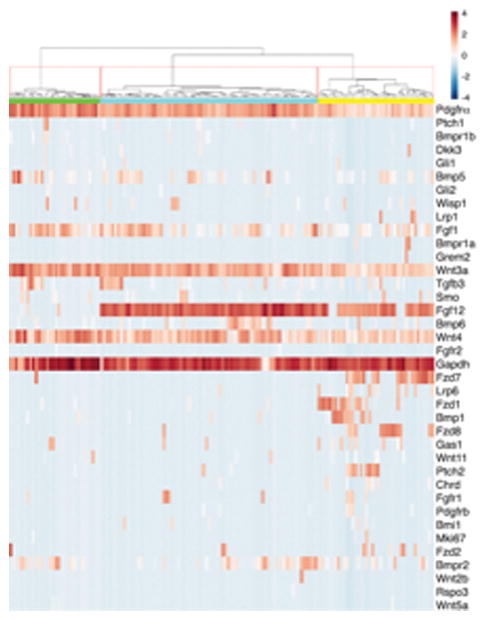
Hierarchical clustering of Foxl1+ single cells based on qPCR-based detection of 30 genes. Note that all Foxl1+ cells express Pdgfra and Wnt3a. The population is clustered into three main groups. Jaccard coefficient for the three clusters were: 0.83 (green), 0.69 (turquoise) and 0.79 (yellow), respectively, indicating underlying cluster stability. Values between 0.6 and 0.75 indicate that the cluster is measuring a pattern in the data. Clusters with stability values above about 0.85 are considered to be highly stable.
Extended Data 3. Derivation of Foxl1CreERT2;PorcnΔ mice.
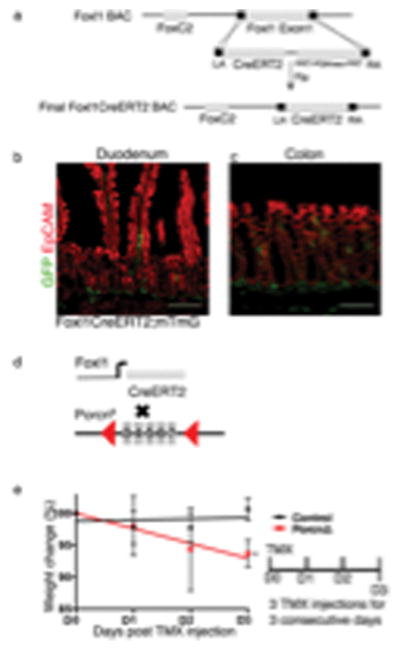
(a) Schema for the generation of Foxl1-CreERT2 mice using BAC recombineering. The coding sequence of exon 1 of Foxl1 was targeted by the sequence of CreERT2. FRT, flipase recognition target; Flp, flipase; LA, left homology arm; RA, right homology arm. (b–c) Tamoxifen Induction of Foxl1-CreERT;Rosa-mTmG drive expression of membrane-bound GFP to mesenchymal telocytes in the duodenum (b) and Colon (c). Immunofluorescece staining for GFP (green), EpCAM (red). (d) Schema for the generation of Foxl1CreERT2;PorcnΔ mice. Foxl1-CreERT2 mice were crossed to mice carrying loxP sites flanking exons 3–7 of the X-linked porcupine homolog (Porcn) gene. (e) Foxl1-CreERT2; Rosa-mTmG (Control, n=5 biologically independent animals) and Foxl1-CreERT2;PorcnΔ (PorcnΔ, n=8 biologically independent animals) male mice were tamoxifen treated for three consecutive days to induce Cre expression and weighed every day. The slope in weight loss was significantly different in PorcnΔ mice as compared to control mice (*P=0.0107, two-tailed linear regression analysis)
Extended Data Table 1.
Wnt pathway gene expression levels in different cell populations as assessed by RNAseq (mean of 2–3 samples each in FPKM)
| Wnt pathway | ||||
|---|---|---|---|---|
| Gene name | Foxl1+ Expression level mean (FPKM) | Mes Expression level mean (FPKM) | Lgr5 Expression level mean (FPKM) | Diff Expression level mean (FPKM) |
| Wnt2 | 0.9742 | 0 | 0.1736 | 0 |
| Wnt2b | 9.5831 | 0.1205 | 0.1559 | 0.1191 |
| Wnt3 | 0.3438 | 0 | 1.0915 | 0.0909 |
| Wnt4 | 1.7951 | 0 | 0.0102 | 0.9198 |
| Wnt5a | 4.9932 | 0 | 0.1219 | 0.0786 |
| Wnt5b | 0.8935 | 0 | 0.5514 | 0.3542 |
| Wnt6 | 0.0866 | 0 | 0.0824 | 0.3045 |
| Wnt9a | 0.5072 | 0 | 0.0505 | 0.0553 |
| Wisp1 | 2.4082 | 0 | 0.0286 | 0 |
| Rspo2 | 0.4112 | 0 | 0 | 0 |
| Rspo3 | 2.1902 | 13.3906 | 0.0141 | 0 |
| Lgr4 | 7.5384 | 0 | 48.6203 | 9.8020 |
| Lgr5 | 1.9220 | 0 | 19.3406 | 0.0408 |
| Lgr6 | 0.2264 | 0 | 0 | 0 |
| Znrf1 | 4.2325 | 0 | 3.6232 | 0.8523 |
| Znrf2 | 2.2594 | 5.0671 | 12.7731 | 7.7214 |
| Znrf3 | 0.9130 | 0.1328 | 1.9908 | 0.1333 |
| Dkk2 | 1.8779 | 0 | 0 | 0 |
| Dkk3 | 36.5673 | 22.1995 | 0.0017 | 0.0077 |
| Wif1 | 1.2579 | 0 | 0.0125 | 0.0844 |
| Sfrp1 | 47.2422 | 0.6198 | 0.0722 | 0.0034 |
| Sfrp4 | 0.7134 | 0 | 0.0096 | 0 |
| Fzd2 | 2.50329 | 0 | 1.9856 | 0.0100 |
| Fdz4 | 4.5451 | 0 | 0.2025 | 0.9071 |
| Fzd6 | 0.5785 | 0 | 2.7795 | 0.2181 |
| Fzd7 | 1.1146 | 0 | 16.7951 | 2.5999 |
| Fzd8 | 0.6245 | 0 | 0.7510 | 0.3280 |
| Lrp1 | 11.4018 | 0.0144 | 6.4567 | 12.5752 |
| Lrp6 | 6.0929 | 0.0013 | 9.5234 | 4.2674 |
| Tcf4 | 15.0228 | 8.338 | 6.0325 | 0.9127 |
| Tcf15 | 1.71113 | 0 | 0.0090 | 0 |
| Tcf19 | 1.456 | 8.768 | 13.6231 | 0.7681 |
| Tcf21 | 19.6602 | 0.0065 | 0 | 0 |
| Tcf7l1 | 1.8914 | 0 | 0.1070 | 0.0623 |
Supplementary Material
Acknowledgments
We are grateful to Drs. Anil Rustgi, Christopher Lengner, and Yuval Dor for critical reading of the manuscript, and Dr. Meera Sundaram for suggesting the Porcupine gene ablation experiment. Thank you to all members of the Kaestner laboratory. We acknowledge funding from NIDDK through R37-DK053839. We thank the University of Pennsylvania’s Diabetes Research Center (DRC) for the use of the Functional Genomics Core (P30-DK019525) and the Center for Molecular Studies in Digestive and Liver Diseases for the use of the Molecular Pathology and Imaging and Transgenic and Chimeric Mouse Cores (P30-DK050306).
Footnotes
The authors declare no competing financial interests.
Readers are welcome to comment on the online version of the paper.
Publisher’s note: Springer Nature remains neutral with regard to jurisdictional claims in published maps and institutional affiliations.
Online Content Methods, along with any additional Extended Data display items and Source Data, are available in the online version of the paper; references unique to these sections appear only in the online paper.
Author Contributions
M.S.C. and K.H.K.: study concept and design; analysis and interpretation of data; writing and revising the manuscript. B.T., E.E.M., S.I. acquisition and interpretation of single molecule RNA-FISH data and review of the manuscript. Y.J.W., K.J.W., A.K. acquisition and interpretation of immunostaining and RNAseq data.
References
- 1.Sato T, et al. Paneth cells constitute the niche for Lgr5 stem cells in intestinal crypts. Nature. 2011;469:415–418. doi: 10.1038/nature09637. [DOI] [PMC free article] [PubMed] [Google Scholar]
- 2.Durand A, et al. Functional intestinal stem cells after Paneth cell ablation induced by the loss of transcription factor Math1 (Atoh1) Proceedings of the National Academy of Sciences of the United States of America. 2012;109:8965–8970. doi: 10.1073/pnas.1201652109. [DOI] [PMC free article] [PubMed] [Google Scholar]
- 3.Kim TH, Escudero S, Shivdasani RA. Intact function of Lgr5 receptor-expressing intestinal stem cells in the absence of Paneth cells. Proceedings of the National Academy of Sciences of the United States of America. 2012;109:3932–3937. doi: 10.1073/pnas.1113890109. [DOI] [PMC free article] [PubMed] [Google Scholar]
- 4.Kabiri Z, et al. Stroma provides an intestinal stem cell niche in the absence of epithelial Wnts. Development. 2014;141:2206–2215. doi: 10.1242/dev.104976. [DOI] [PubMed] [Google Scholar]
- 5.San Roman AK, Jayewickreme CD, Murtaugh LC, Shivdasani RA. Wnt secretion from epithelial cells and subepithelial myofibroblasts is not required in the mouse intestinal stem cell niche in vivo. Stem cell reports. 2014;2:127–134. doi: 10.1016/j.stemcr.2013.12.012. [DOI] [PMC free article] [PubMed] [Google Scholar]
- 6.Aoki R, et al. Foxl1-expressing mesenchymal cells constitute the intestinal stem cell niche. Cell Mol Gastroenterol Hepatol. 2016;2:175–188. doi: 10.1016/j.jcmgh.2015.12.004. [DOI] [PMC free article] [PubMed] [Google Scholar]
- 7.Kaestner KH, et al. Six members of the mouse forkhead gene family are developmentally regulated. Proceedings of the National Academy of Sciences of the United States of America. 1993;90:7628–7631. doi: 10.1073/pnas.90.16.7628. [DOI] [PMC free article] [PubMed] [Google Scholar]
- 8.Fukuda K, et al. Mesenchymal expression of Foxl1, a winged helix transcriptional factor, regulates generation and maintenance of gut-associated lymphoid organs. Dev Biol. 2003;255:278–289. doi: 10.1016/s0012-1606(02)00088-x. [DOI] [PubMed] [Google Scholar]
- 9.Kaestner KH, et al. Clustered arrangement of winged helix genes fkh-6 and MFH-1: possible implications for mesoderm development. Development. 1996;122:1751–1758. doi: 10.1242/dev.122.6.1751. [DOI] [PubMed] [Google Scholar]
- 10.Sackett SD, Fulmer JT, Friedman JR, Kaestner KH. Foxl1-Cre BAC transgenic mice: a new tool for gene ablation in the gastrointestinal mesenchyme. Genesis. 2007;45:518–522. doi: 10.1002/dvg.20315. [DOI] [PubMed] [Google Scholar]
- 11.Muzumdar MD, Tasic B, Miyamichi K, Li L, Luo L. A global double-fluorescent Cre reporter mouse. Genesis. 2007;45:593–605. doi: 10.1002/dvg.20335. [DOI] [PubMed] [Google Scholar]
- 12.Cantarero Carmona I, Luesma Bartolome MJ, Junquera Escribano C. Identification of telocytes in the lamina propria of rat duodenum: transmission electron microscopy. J Cell Mol Med. 2011;15:26–30. doi: 10.1111/j.1582-4934.2010.01207.x. [DOI] [PMC free article] [PubMed] [Google Scholar]
- 13.Cretoiu D, Cretoiu SM, Simionescu AA, Popescu LM. Telocytes, a distinct type of cell among the stromal cells present in the lamina propria of jejunum. Histol Histopathol. 2012;27:1067–1078. doi: 10.14670/HH-27.1067. [DOI] [PubMed] [Google Scholar]
- 14.Vannucchi MG, Traini C, Manetti M, Ibba-Manneschi L, Faussone-Pellegrini MS. Telocytes express PDGFRalpha in the human gastrointestinal tract. J Cell Mol Med. 2013;17:1099–1108. doi: 10.1111/jcmm.12134. [DOI] [PMC free article] [PubMed] [Google Scholar]
- 15.Sheaffer KL, et al. DNA methylation is required for the control of stem cell differentiation in the small intestine. Genes Dev. 2014;28:652–664. doi: 10.1101/gad.230318.113. [DOI] [PMC free article] [PubMed] [Google Scholar]
- 16.Liu W, et al. Deletion of Porcn in mice leads to multiple developmental defects and models human focal dermal hypoplasia (Goltz syndrome) PLoS One. 2012;7:e32331. doi: 10.1371/journal.pone.0032331. [DOI] [PMC free article] [PubMed] [Google Scholar]
- 17.Gracz AD, et al. Brief report: CD24 and CD44 mark human intestinal epithelial cell populations with characteristics of active and facultative stem cells. Stem Cells. 2013;31:2024–2030. doi: 10.1002/stem.1391. [DOI] [PMC free article] [PubMed] [Google Scholar]
- 18.van der Flier LG, Haegebarth A, Stange DE, van de Wetering M, Clevers H. OLFM4 is a robust marker for stem cells in human intestine and marks a subset of colorectal cancer cells. Gastroenterology. 2009;137:15–17. doi: 10.1053/j.gastro.2009.05.035. [DOI] [PubMed] [Google Scholar]
- 19.Yan KS, et al. Non-equivalence of Wnt and R-spondin ligands during Lgr5(+) intestinal stem-cell self-renewal. Nature. 2017;545:238–242. doi: 10.1038/nature22313. [DOI] [PMC free article] [PubMed] [Google Scholar]
- 20.Wen F, et al. Expression of conditional cre recombinase in epithelial tissues of transgenic mice. Genesis. 2003;35:100–106. doi: 10.1002/gene.10169. [DOI] [PMC free article] [PubMed] [Google Scholar]
- 21.Srinivas S, et al. Cre reporter strains produced by targeted insertion of EYFP and ECFP into the ROSA26 locus. BMC Dev Biol. 2001;1:4. doi: 10.1186/1471-213X-1-4. [DOI] [PMC free article] [PubMed] [Google Scholar]
- 22.Grant GR, et al. Comparative analysis of RNA-Seq alignment algorithms and the RNA-Seq unified mapper (RUM) Bioinformatics. 2011;27:2518–2528. doi: 10.1093/bioinformatics/btr427. [DOI] [PMC free article] [PubMed] [Google Scholar]
- 23.Robinson MD, McCarthy DJ, Smyth GK. edgeR: a Bioconductor package for differential expression analysis of digital gene expression data. Bioinformatics. 2010;26:139–140. doi: 10.1093/bioinformatics/btp616. [DOI] [PMC free article] [PubMed] [Google Scholar]
- 24.Hennig C. Cluster-wise assessment of cluster stability. Computational Statistics & Data Analysis. 2007;52:258–271. [Google Scholar]
- 25.Mclean IW, Nakane PK. Periodate-Lysine-Paraformaldehyde Fixative - New Fixative for Immunoelectron Microscopy. J Histochem Cytochem. 1974;22:1077–1083. doi: 10.1177/22.12.1077. [DOI] [PubMed] [Google Scholar]
- 26.Shyer AE, Huycke TR, Lee C, Mahadevan L, Tabin CJ. Bending gradients: how the intestinal stem cell gets its home. Cell. 2015;161:569–580. doi: 10.1016/j.cell.2015.03.041. [DOI] [PMC free article] [PubMed] [Google Scholar]
- 27.Chung K, et al. Structural and molecular interrogation of intact biological systems. Nature. 2013;497:332-+. doi: 10.1038/nature12107. [DOI] [PMC free article] [PubMed] [Google Scholar]
- 28.Itzkovitz S, van Oudenaarden A. Validating transcripts with probes and imaging technology. Nature methods. 2011;8:S12–19. doi: 10.1038/nmeth.1573. [DOI] [PMC free article] [PubMed] [Google Scholar]
- 29.Lyubimova A, et al. Single-molecule mRNA detection and counting in mammalian tissue. Nat Protoc. 2013;8:1743–1758. doi: 10.1038/nprot.2013.109. [DOI] [PubMed] [Google Scholar]
- 30.Bahar Halpern K, et al. Bursty gene expression in the intact mammalian liver. Mol Cell. 2015;58:147–156. doi: 10.1016/j.molcel.2015.01.027. [DOI] [PMC free article] [PubMed] [Google Scholar]
- 31.Halpern KB, Itzkovitz S. Single molecule approaches for quantifying transcription and degradation rates in intact mammalian tissues. Methods. 2016;98:134–142. doi: 10.1016/j.ymeth.2015.11.015. [DOI] [PubMed] [Google Scholar]
- 32.Itzkovitz S, et al. Single-molecule transcript counting of stem-cell markers in the mouse intestine. Nat Cell Biol. 2011;14:106–114. doi: 10.1038/ncb2384. [DOI] [PMC free article] [PubMed] [Google Scholar]
Associated Data
This section collects any data citations, data availability statements, or supplementary materials included in this article.
Supplementary Materials
Data Availability Statement
RNAseq data that support the findings of this study have been deposited in NCBI’s GEO under accession code GSE94072. Source data for figures 2, 3 and 4 are provided with the paper.


