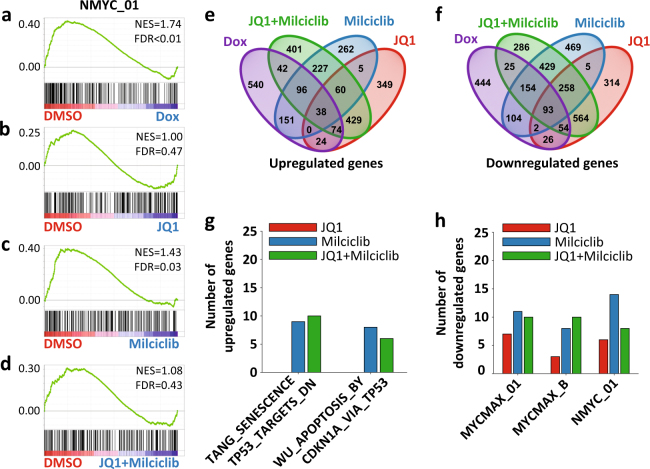
Fig. 3.
Comparing the transcriptional output from MYCN suppression with BET and CDK inhibition in order to identify essential gene targets. Characterizing the transcriptional changes induced after 6 h treatments. a–d GSEA results for the top MYCN target gene-related gene set (NMYC_01) downregulated in GTML-DOX-6h as compared to GTML–DMSO-6h (a); the GSEAs for the same gene set are shown comparing GTML-DMSO-6h with GTML-JQ1-6h (b), GTML-Milciclib-6h (c), and GTML-JQ1+Milciclib-6h (d). Enrichments were considered significant if FDR < 0.05. e, f Venn diagrams displaying the number of genes significantly upregulated (e) or downregulated (f) in each treatment as compared to DMSO and the overlap of regulated genes between treatments. g, h Bar plot depicting the number of genes significantly upregulated in two TP53/apoptosis gene sets (g) or downregulated in three MYC/MYCN gene sets (h) in GTML-DOX-6h as compared to GTML-DMSO-6h and shared with similarly regulated genes in GTML-JQ1-6h, GTML-Milciclib-6h, or GTML-JQ1+Milciclib-6h; gene sets were identified in a and Supplementary Figure 3b. Genes were considered significantly regulated if at least one condition was expressed (log10(FPKM + 1) > 0.50), the FDR adjusted p-value q < 0.05, and if log2(FC) > log2(1.5) (upregulated) or log2(FC) < −log2(1.5) (downregulated)

