Abstract
Background
Two common southern African mice species, Mastomys coucha and M. natalensis, are widely distributed throughout the subregion and overlap in many areas. They also share a high degree of morphological similarity, making them impossible to distinguish in the field at present. These multimammate mice are documented carriers of serious disease vectors causing Lassa fever, plague and encephalomyocarditis, which coupled to their cohabitation with humans in many areas, could pose a significant health risk. A preliminary study reported the presence of isozyme markers at three loci (GPI-2, PT-2, -3) in one population each of M. coucha and M. natalensis. Two additional populations (from the Vaal Dam and Richards Bay) were sampled to determine the reliability of these markers, and to seek additional genetic markers.
Results
Fifteen proteins or enzymes provided interpretable results at a total of 39 loci. Additional fixed allele differences between the species were detected at AAT-1, ADH, EST-1, PGD-1, Hb-1 and -2. Average heterozygosities for M. coucha and M. natalensis were calculated as 0.018 and 0.032 respectively, with a mean genetic distance between the species of 0.26.
Conclusions
The confirmation of the isozyme and the detection of the additional allozyme markers are important contributions to the identification of these two medical and agricultural pest species.
Background
The Praomys/Mastomys species complex is a group of morphologically similar species that occur in very diverse habitats throughout sub-Saharan Africa [1]. The taxonomy of this group has been clouded by a diversity of opinions and this confusion has been further compounded by many external and cranial similarities between species, and thus the systematics of this group remains poorly understood, with many species yet to be described [1]. The genus Mastomys is well represented in southern Africa, especially by the ubiquitous multimammate mice, Mastomys coucha (Smith, 1836) and M. natalensis (Smith, 1834). The distribution of both species is only provisional at this stage [2], and the species are known to be sympatric in some areas, and allopatric in others. These common agricultural pests are also commensal with man, often sheltering in houses in order to safely rear their young. In African kraals they occur in very large numbers, living in the fabric and thatch of pole and mud huts [2].
Because these mice carry important diseases, the medical implications of this cohabitation with man are obvious. Mastomys coucha acts as a reservoir for the Rickettsian Yersinia pestis, the organism causing plague [3]. The three forms of plague are bubonic, primary pneumonic and primary septicaemic. Bubonic plague, which is the most common type in epidemics, is fatal in about 25% to 50% of untreated cases. Pneumonic plague, a highly contagious (airborne) form, and septicaemic plague, a generalised blood infection, are more rare forms, and usually fatal [4]. Plague still exists as a threat in southern Africa, with much current concern over the possibility of outbreaks in rat infested inner cities.
Both species are also carriers of the Banzi and Witwatersrand viruses [3] and M. natalensis is a natural reservoir for the arenavirus causing Lassa fever. This infection, occurring predominantly in West Africa up until now, has a high mortality rate, especially amongst pregnant women and even in patients with modern health care. The Mopeia virus is another similar virus carried by M. natalensis, but the effect thereof on man is as yet unknown [5]. Mastomys rodents were also linked to an outbreak of encephalomyocarditis (EMC) among African elephants in the Kruger National Park in the last decade [6]. However, due to the fact that both species occur within the boundaries of the park, it is uncertain as to whether only one or both of these species may carry the EMC virus.
The differences between the two species are thus neither ecologically nor economically trivial. This illustrates the need for research into their relatedness, especially of a genetic nature, as this could yield insights as to why only certain species carry the above mentioned diseases, especially as these two sibling species are impossible to distinguish on the basis of external morphology alone. For this reason, both M. coucha and M. natalensis were described as one species, that of M. natalensis[7]. However, these species do differ in chromosome number, with M. coucha having 2n = 36 and M. natalensis having 2n = 32 [8]. Differences in behaviour, urethral lappet and spermatozoal morphology and haemoglobin mobility in electrophoresis were also reported by [8]. In contrast, more recent research into spermatozoal morphology of these two species led Breed [9] to report that they were extremely similar, if not identical in this respect. Dippenaar et al.[3] used multivariate analysis of the cranial characteristics of each species in order to identify them. However, there were discrepancies in identification of 50% of the specimens collected at a sympatric locality according to this method and that of haemoglobin mobility. The preliminary report of Smit et al.[10] showed isozyme differences at three loci, GPI-2 in liver, and PT-2 and -3 in muscle tissue. This study also revealed through iso-electric focusing that the haemoglobin components present in each species were unique from the other. In the present study, we have used electrophoretic techniques in an attempt to confirm the isozyme markers (locus differences) reported above in two additional allopatric populations of M. coucha and M. natalensis, as well as to identify additional genetic markers.
Results and Discussion
All 15 of the proteins stained for provided adequate resolution or activity to be interpreted. Locus abbreviations and enzyme commission numbers along with the buffers and tissues yielding the best results are given in Table 1. The following protein products migrated cathodally: AAT-2, ADH, GAP, GPI-1, -2, MDH-2 and PGD-2.
Table 1.
Locus abbreviations, enzymes stained for, enzyme commission numbers (E. C. no.) as well as the tissues and buffers giving optimal results (buffer descriptions are given in Materials and Methods).
| Protein | Locus | E.C. No. | Buffer | Tissue |
| 1. Aspartate aminotransferase | AAT-1, -2 | 2.6.1.1 | P | Bl |
| 2. Alcohol dehydrogenase | ADH | 1.1.1.1 | TC | L |
| 3. Creatine kinase | CK-1 to -3 | 2.7.3.2 | TC | M |
| 4. Esterases | EST-1 to -3 | 3.1.1.- | RW, MF | M, L |
| 5. General proteins | PT-1 to -5 | PAGE | M | |
| 6. Glucose-6-phosphate isomerase | GPI-1, -2 | 3.5.1.9 | RW, P | L |
| 7. Glyceraldehyde-3-phosphate dehydrogenase | GAP | 1.2.1.12 | TC | M, L |
| 8. Glycerol-3-phosphate dehydrogenase | GPD-1 to -4 | 1.1.1.8 | RW | M, L |
| 9. Haemoglobin | Hb-1, -2 | PAGE | Bl | |
| 10. Isocitrate dehydrogenase | IDH-1 to -3 | 1.1.1.42 | TC | M, L |
| 11. L-Lactate dehydrogenase | LDH-1, -2 | 1.1.1.27 | RW | Bl, M |
| 12. Malate dehydrogenase | MDH-1, -2 | 1.1.1.37 | TC | M, L |
| 13. 6-Phosphogluconate dehydrogenase | PGD-1 to -3 | 1.1.1.44 | HC | M, L |
| 14. Phosphoglucomutase | PGM-1 to -3 | 5.4.2.2 | P, RW | M |
| 14b Phosphoglucomutase | PGM-4 | 5.4.2.2 | RW | L |
| 15. Superoxide dismutase | SOD-1, -2 | 1.15.1.1 | P, RW | M, L |
Bl = blood, L = liver, M = Muscle
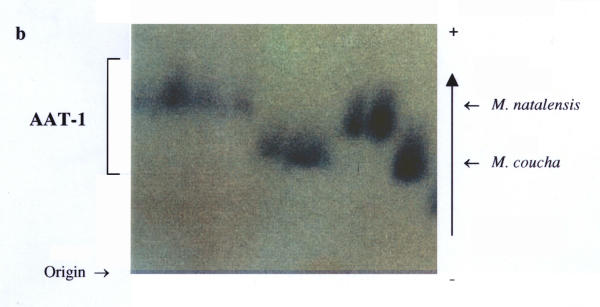
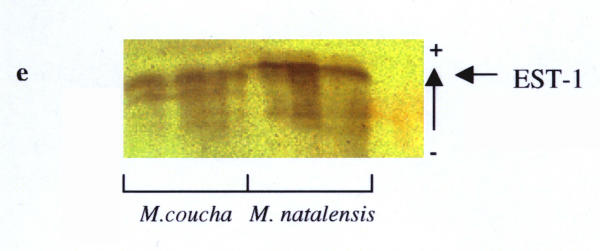
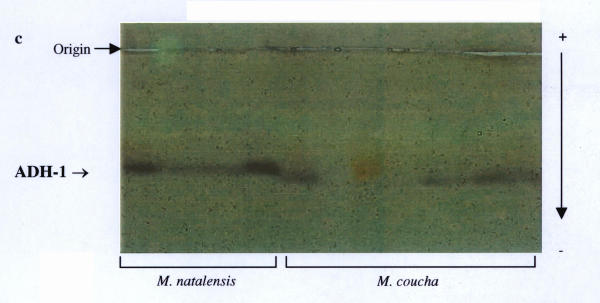
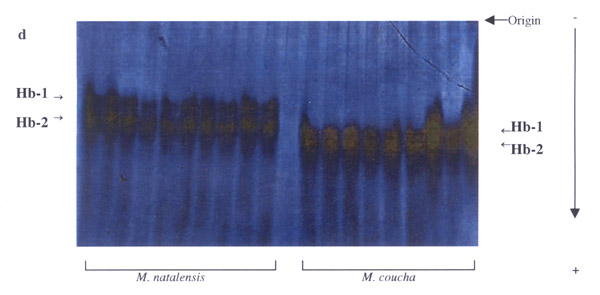
Nineteen (49%) of the 39 loci studied were polymorphic in one or more of the four populations analysed (Table 2). These were: AAT-1, -2, ADH, EST-1, -2, GAP, GPI-2, IDH-1, -2, LDH-2, PGD-1, PGM-1 to -4, PT-2, -3, Hb-1 and Hb-2. This was somewhat higher than the previous 33% estimate in the preliminary study, and mainly due to the presence of the additional markers detected. Fixed allele differences between M. natalensis and M. coucha were detected at AAT-1 (blood; Fig. 2), ADH (liver; Fig. 3), EST-1 (liver; Fig. 6), PGD-1 (muscle; Fig. 4), Hb-1 and -2 (blood; Fig. 5). Locus differences were confirmed in the new material at GPI-2, PT-2 and -3. The differences at these last three loci were considered to be isozyme rather than allozyme differences due to the large separation distance between the bands [10]. Thus these three loci remain useful in identifying individuals from either species, along with the new allozyme markers.
Table 2.
Allele frequencies, average heterozygosity per locus (H), mean number of alleles per locus (A) and percentage of loci polymorphic (P) for all populations studied with standard errors in parentheses.
| Locus | Allele | Montgomery | Vaal | La Lucia | Richards Bay |
| Park | |||||
| AAT-1 | A | 1.000 | 1.000 | ||
| B | 1.000 | 1.000 | |||
| AAT-2 | A | 0.250 | |||
| B | 0.750 | 1.000 | 1.000 | 0.500 | |
| C | 0.500 | ||||
| ADH | A | 0.062 | |||
| B | 1.000 | 0.938 | |||
| C | 1.000 | 1.000 | |||
| EST-1 | A | 1.000 | 1.000 | ||
| B | 1.000 | 1.000 | |||
| EST-2 | A | 0.156 | |||
| B | 0.844 | 1.000 | 1.000 | 1.000 | |
| GAP | A | 0.167 | |||
| B | 1.000 | 1.000 | 1.000 | 0.833 | |
| GPI-2 | A | 1.000 | 1.000 | ||
| B | 1.000 | 1.000 | |||
| IDH-1 | A | 0.944 | 0.375 | 1.000 | |
| B | 0.833 | 0.056 | 0.500 | ||
| C | 0.167 | 0.125 | |||
| IDH-2 | A | 0.091 | |||
| B | 1.000 | 1.000 | 0.909 | 0.933 | |
| C | 0.067 | ||||
| LDH-2 | A | 0.033 | 0.056 | ||
| B | 0.967 | 0.944 | 1.000 | 1.000 | |
| PGD-1 | A | - | 1.000 | - | |
| B | - | - | 1.000 | ||
| PGM-1 | A | 0.062 | |||
| B | 1.000 | 0.938 | 1.000 | 1.000 | |
| PGM-2 | A | 0.062 | |||
| B | 1.000 | 0.938 | 1.000 | 1.000 | |
| PGM-3 | A | 0.062 | |||
| B | 1.000 | 0.938 | 1.000 | 1.000 | |
| PGM-4 | A | - | 0.036 | - | |
| B | 1.000 | - | 0.964 | - | |
| PT-2 | A | 1.000 | 1.000 | ||
| B | 1.000 | 1.000 | |||
| PT-3 | A | 1.000 | 1.000 | ||
| B | 1.000 | 1.000 | |||
| Hb-1 | A | - | 1.000 | - | |
| B | - | - | 1.000 | ||
| Hb-2 | A | - | 1.000 | - | |
| B | - | - | 1.000 | ||
| H | 0.029 | 0.006 | 0.035 | 0.029 | |
| (±0.015) | (±0.004) | (±0.019) | (±0.017) | ||
| A | 1.12 | 1.06 | 1.21 | 1.11 | |
| (±0.06) | (±0.04) | (±0.08) | (±0.05) | ||
| P | 8.80 | 5.71 | 14.71 | 11.43 |
Figure 2.
Fixed allele differences between Mastomys coucha and M. natalensis at PGD-1.
Figure 3.
Fixed allele differences between Mastomys coucha and M. natalensis at AAT-1.
Figure 6.
Fixed allele differences between Mastomys coucha and M. natalensis at EST-1.
Figure 4.
Fixed allele differences between Mastomys coucha and M. natalensis at ADH.
Figure 5.
Fixed allele differences between Mastomys coucha and M. natalensis at Hb.
PGD and Hb were not analysed in the La Lucia and Montgomery Park populations in the initial study. However, the results obtained via PAGE for the Hb locus in the Vaal and Richards Bay populations, using the haemoglobin purification method described by Falk et al.[11], are analogous to those by Gordon [8]. Significant differences (FIT = 0.936, P < 0.05) were obtained for EST-1 in the earlier study, but the additional data from the new material and increased resolution at this locus allowed us to re-evaluate those results, and indicate this locus is useful as another marker (Fig. 6). Results for the ADH locus were also re-evaluated, as analysis of the new populations was performed on different buffer systems that provided better resolution than previously obtained (Fig. 4). The most cost and labour effective analysis for the routine identification of these two species would appear to be to stain for the GPI-2 and EST-1 loci on an RW buffer system running muscle and liver samples. While PAGE may provide better resolution, it is more expensive, requires more time to run and only one protein can be stained for at a time. The other markers at PGD-1 and ADH-1 are on incompatible buffer systems, and the purified haemoglobin samples needed for the AAT-2 and Hb loci are rendered less economic by the additional time, materials and equipment needed for preparation.
The genotypes at the IDH-1 and LDH-2 loci in the Vaal (M. coucha) population and the PGM-1, -2 and -3 loci in the La Lucia (M. natalensis) population were close to the expected Hardy-Weinberg proportions for naturally occurring populations. Deficiencies of heterozygotes were observed at the following loci: AAT-2 (Richards Bay and Montgomery Park populations), ADH-1 (Richards Bay), EST-2 (Montgomery Park), GAP (Richards Bay), IDH-1 (Montgomery Park and La Lucia), IDH-2 (La Lucia and Richards Bay), LDH-2 (Montgomery Park) and PGM-4 (La Lucia). There were no deviations of allele classes from Hardy-Weinberg proportions in the Vaal population, which is surprising as this had the smallest sample size of all four sites.
Polymorphism (P) was 14.7 and 11.4% in the La Lucia and Richards Bay populations of M. natalensis, whereas the values for Montgomery Park and Vaal populations of M. coucha were 8.8 and 5.7% respectively, with average values of 13.1% for M. natalensis and 7.3% for M. coucha (Table 2). These are comparable to values reported for other rodent species. Johnson and Selander [12] obtained 7.9% in the Heteromyid Dipdomys, 17.4% for Otomys irroratus[13], 16.1% for Rhabdomys pumilio[14], and 6.7% for Oryzomys palustris[15]. The values for M. coucha are lower than those for M. natalensis, and although the lowest value of 5.7% for the Vaal population could be attributed to small sample size, one could expect that the much larger geographic range of M. natalensis (from southern Africa right through to west Africa) and the greater diversity of biome type would give this species a somewhat larger degree of genetic variation.
Numbers of alleles per locus (A) values were similar, ranging from 1.06 for the Vaal population to 1.21 for the La Lucia population, whereas the Richards Bay and Montgomery Park populations were calculated to be 1.11 and 1.12. Individual heterozygosity (h) values for the Montgomery Park population ranged from 0.064 (LDH-2) to 0.278 (IDH-1), for the Vaal population, 0.105 (LDH-2 was the only heterozygous locus within this population), La Lucia from 0.069 (PGM-4) to 0.594 (IDH-1) and from 0.124 (IDH-2) to 0.500 (AAT-2). The mean H value for M. coucha was 0.018, and 0.032 for M. natalensis. These values put these two species in the lower range of rodent variation (Figure 1). A much higher mean heterozygosity (0.073) was obtained by Mahida et al.[14] in their genetic assay of the grassland specialist, Rhabdomys pumilio. This is interesting, as Rhabdomys is a species that prefers a more pristine habitat than the opportunistic and pioneering multimammate mice. Indeed, M. coucha and M. natalensis tend to be replaced over time by Rhabdomys and Otomys species in areas that are recovering from habitat damage of some sort [7]. H values determined by Taylor et al.[13] for O. irroratus were also high (mean = 0.071). One would expect that generalist species like M. coucha and M. natalensis might possess more variation in the genome to deal with more challenging types of habitats, especially human-disturbed, but it would appear that this is not the case. H for M. natalensis was calculated to be nearly double that of M. coucha, but the low value for the Vaal population was probably due to the small sample size, which resulted in that species' average being brought down. On the whole, M. natalensis does appear to possess more genetic variation than M. coucha, perhaps because of the much greater range of biome types spanned by the former species, as mentioned above.
Figure 1.
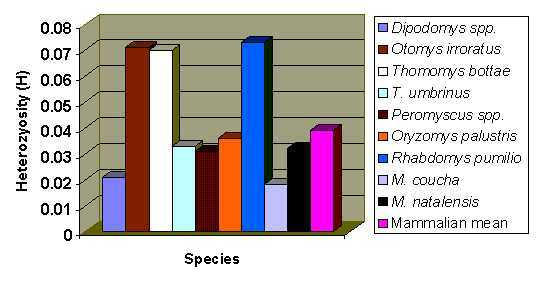
Comparative heterozygosities (H) for various species of Rodentia, along with the mammalian mean.
The F values of Wright [16] are useful to estimate the amount of genetic differentiation between species (Table 3). High values of FST are considered to reflect substantial differences at any given locus, and are expected when studying separate species or populations that have diverged to a certain degree. Wright [16] used the following groupings for the evaluation of FST values: the range 0 to 0.05 is considered to reflect little genetic differentiation; 0.05 to 0.15 is indicative of moderate differentiation; 0.15 to 0.25 indicates great genetic differentiation and values greater than 0.25 reflect very great genetic differentiation. All of the measures have increased slightly with the addition of the new material, with pair-wise FST values between the species of 0.882 (Vaal and Richards Bay populations) and 0.743 (La Lucia and Montgomery Park populations) indicating large amounts of differentiation between the two species by the abovementioned criteria (Table 3). As expected, this is higher than the FST value of 0.375 for populations of O. irroratus[13] and 0.459 for populations of the striped field mouse R. pumilio[14]. These are comparable to the FST values of 0.558 between the two M. coucha populations, and 0.228 between the two M. natalensis populations. Pair wise Χ2 probability totals between both sets of populations (Vaal-Richards Bay and Montgomery Park-La Lucia) were zero (Table 3), indicating significant (p = 0) differentiation as expected for the two species.
Table 3.
Summary of F-statistics between the Richards Bay and Vaal populations, the Montgomery Park and La Lucia populations (bold) at all loci analysed, as well as contingency Χ 2 analysis for the pooled data of the two species.
| Locus | FIS | FIT | FST | Χ2 | ||||
| AAT-1 | 1.000 | (1.000) | 1.000 | (1.000) | 0.000 | (0.000) | ||
| AAT-2 | 1.000 | (1.000) | 1.000 | (1.000) | 0.333 | (0.143) | 0.040 | (0.186) |
| ADH | 1.000 | 1.000 | (1.000) | 0.889 | (1.000) | 0.000 | (0.001) | |
| EST-1 | 1.000 | (1.000) | 1.000 | (1.000) | 0.000 | (0.000) | ||
| EST-2 | (0.763) | (0.783) | (0.085) | (0.063) | ||||
| GAP | 1.000 | 1.000 | 0.091 | 0.085 | ||||
| GPI-2 | 1.000 | (1.000) | 1.000 | (1.000) | 0.000 | (0.000) | ||
| IDH-1 | -0.059 | (1.000) | -0.029 | (1.000) | 0.029 | (0.127) | 0.555 | (0.056) |
| IDH-2 | 1.000 | (1.000) | 1.000 | (1.000) | 0.034 | (0.048) | 0.263 | (0.167) |
| LDH-2 | -0.059 | (-0.034) | -0.029 | (-0.017) | 0.029 | (0.017) | 0.178 | (0.410) |
| PGD-1 | 1.000 | 1.000 | 0.000 | |||||
| PGM-1 | (-0.067) | (-0.032) | (0.032) | (0.341) | ||||
| PGM-2 | (-0.067) | (-0.032) | (0.032) | (0.341) | ||||
| PGM-3 | (-0.067) | (-0.032) | (0.032) | (0.341) | ||||
| PGM-4 | (-0.037) | (-0.018) | (0.018) | (0.240) | ||||
| Hb-1 | 1.000 | 1.000 | 0.000 | |||||
| Hb-2 | 1.000 | 1.000 | 0.000 | |||||
| PT-2 | 1.000 | (1.000) | 1.000 | (1.000) | 0.000 | (0.000) | ||
| PT-3 | 1.000 | (1.000) | 1.000 | (1.000) | 0.000 | (0.000) | ||
| Mean | 0.819 | (0.734) | 0.979 | (0.931) | 0.882 | (0.743) | ||
| Total | 0.000 | (0.000) | ||||||
Genetic distance (D) is a measure of the amount of genetic divergence that has occurred between two species since a hypothetical separation point sometime in their evolutionary past. The D value of Nei [17] is specially adapted for small sample sizes and the mean value, between M. coucha and M. natalensis was 0.26, with a D of 0.31 between the Richards Bay and Vaal populations and 0.21 between the La Lucia and Montgomery Park populations. The discrepancy between these values is the result of the additional allozyme markers detected in the new material. This value is obviously slightly larger than those obtained from intraspecific calculations of D between populations of R. pumilio (highest D = 0.189, [14]) and O. irroratus (highest D = 0.117, [13]).
Murid rodents are biologically interesting subjects for genetic analysis, due to their rapid evolutionary radiation, and cytogenetic differences are common between genera and species [1]. It would seem that the sibling species of M. coucha and M. natalensis are more examples of this phenomenon, with a chromosomal mutation within M. natalensis giving rise to the possibly younger M. coucha, which has been subsequently isolated reproductively. It is unknown as to why these two species, which have so much in common biologically, do not act as reservoirs for the same pathogens, although it is possible that differing physiological biochemistry may be the reason. Still, multimammate mice remain the most important pest species of African rodents [18] both medically and agriculturally, and the isozyme markers reported here, as well as the new allozyme markers are reliable methods of distinguishing between them. This is certainly an aid to identify various disease threats from either species in areas like the Kruger National Park, where the two species occur in sympatry, as well as assisting in determining the eventual distribution of both species.
Materials and Methods
The genetic analysis of an additional nine individuals of M. coucha caught on the shores of the Vaal Dam (26°51'49"S, 28°08'59"E), 16 individuals of M. natalensis from rehabilitated dunes in the Richards Bay area (28°38'48"S, 32°16'15"E) as well as a further ten individuals from Montgomery Park (previous reference site for M. coucha) (26°09'22"S, 27°58'58"E) and four reference samples of M. natalensis from La Lucia Ridge (Kwazulu-Natal) (29°44'44"S, 31°03'09"E) was done using electrophoresis. The total number of specimens from all populations was 40 for M. natalensis and 43 for M. coucha. The additional specimens were caught using live Sherman type traps and were then transported to the laboratory where samples of blood, liver, and muscle tissue were taken. All samples except blood were frozen at -20°C. Blood samples were prepared for polyacrylamide gel electrophoresis using the technique described by Falk et al.[11]. Whole blood samples are centrifuged at 750 × g (1800–2000 rpm) for 10 min, after which the plasma supernatant is removed with a pipette. Precooled (5°C) PBS buffer (1.815 g KH2PO4; 9.496 g Na2HPO4; 5.072 g NaCl; 0.094 g MgCl2; 0.110 g CaCl2; 0.125 g MnCl2 per 1000 ml distilled water, pH 7.4) is added to the compacted erythrocyte pellet; about seven volumes of PBS to three volumes of pellet. The cells are then resuspended by gentle shaking, and the resulting suspension is centrifuged again at 750 × g for 10 min. Supernatants are again removed with a pipette. Resuspension, centrifugation, and removal of supernatant are repeated three times in total. The entire supernatant and the thin, white cloudy layer of cells above the red erythrocyte pellet must be carefully removed and discarded after each centrifugation step. After the third washing, four volumes of ice cooled distilled water are added to each volume of pellet, and mixed well; centrifuged at 2 200 × g (4000–5000 rpm) for 30 min, and the haemolysate solution (supernatant) is removed, and transferred. For stabilisation of the haemoglobin samples, 1 ml of PBS buffered glycerol (same PBS as above, but without CaCl2, MgCl2 or MnCl2; 80 ml glycerol plus 20 ml PBS) is added to each millilitre of haemolysate, and mixed well. The resulting suspension may be stored at -20°C for up to 1.5 years.
Analyses were done using 12% starch gels, as well as 7% standard polyacrylamide gels (130×135 mm)[19]. A discontinuous lithium-borate tris-citric acid buffer (RW; electrode: pH 8; gel: pH 8.7; [20]) and four continuous buffers: a tris-citric acid buffer system (TC; pH 6.9; [21]), a tris-borate-EDTA buffer (MF; pH 8.6; [22]), a tris-citrate system, (P; pH 8.6 [23]), and a histedine-citrate system (HC; pH 6.5; [24]) were used to study variation at a total of 32 protein coding loci on starch gels. Five loci (general protein and haemoglobin) were resolved by means of polyacrylamide gel electrophoresis (PAGE). Staining methods are as described by Shaw and Prasad [25] and Harris and Hopkinson [26], and the method of interpretation of gel-banding patterns and locus nomenclature as referred to by Van der Bank and Van der Bank [27] were used. Statistical analysis of data was executed using BIOSYS-1 [28].
Acknowledgments
Acknowledgements
We thank Sasol for funding this project. Thanks also to Shaun West, and Jaco Delport for their assistance in the loan of traps and capture of specimens.
Contributor Information
Andre A Smit, Email: andrekarl@yahoo.com.
Herman FH Van der Bank, Email: fhvdb@na.rau.ac.za.
References
- Qumsiyeh MB, King SW, Arroyo-Cabrales A, Aggundey IR, Schlitter DA, Baker RJ, Morrow KJ., Jr Chromosomal and protein evolution in morphologically similar species of Praomys sensu lato (Rodentia, Muridae). J Hered. 1990;81:58–65. doi: 10.1093/oxfordjournals.jhered.a110925. [DOI] [PubMed] [Google Scholar]
- Skinner JD, Smithers RHN. The Mammals of the Southern African Subregion (second edition). University of Pretoria, Pretoria. 1990.
- Dippenaar NJ, Swanepoel P, Gordon DH. Diagnostic morphometrics of two medically important southern African rodents, Mastomys natalensis and M. coucha (Rodentia:Muridae). South African Journal of Science. 1993;89:300–303. [Google Scholar]
- Roberts LS, Janovy J. Foundations of Parasitology (fifth edition). WCB Publishers, New York. 1995.
- Murray PR, Baron EJ, Pfaller MA, Tenover FC, Yolken RH. Manual of Clinical Microbiology (Sixth edition). ASM Press, Washington, DC. 1995.
- Grobler DG, Raath JP, Braack LEO, Keet DF, Gerdes GH, Barnard BJH, Kriek NPJ, Jardine J, Swanepoel R. An outbreak of encephalomyocarditis infection in free-ranging African elephants in the Kruger National Park. Onderstepoort Journal of Veterinary Research. 1995;62:97–108. [PubMed] [Google Scholar]
- De Graaff G. The Rodents of Southern Africa. Butterworths, Durban and Pretoria. 1981.
- Gordon DH. Evolutionary Genetics of the Praomys (Mastomys) natalensis species complex (Rodentia: Muridae). PhD Thesis, Witswatersrand University. 1984.
- Breed WG. Spermatozoa of murid rodents from Africa: morphological diversity and evolutionary trends. J Zool Lond. 1995;237:625–651. [Google Scholar]
- Smit A, Van der Bank H, Falk T, De Castro A. Biochemical genetic markers to identify two morphologically similar South African Mastomys species (Rodentia: Muridae). Biochemical Systematics and Ecology. 2001;29:21–30. doi: 10.1016/S0305-1978(00)00028-4. [DOI] [PubMed] [Google Scholar]
- Falk TM, Abban EK, Oberst S, Villwock W, Pullin RSV, Renwrantz L. A biochemical laboratory manual for species characterization of some tilapiine fishes. ICLARM Education Series 17, Manila, Philippines. 1996.
- Johnson WE, Selander RK. Protein variation and systematics in kangaroo rats (Genus Dipodomys). Systematic Zoology. 1971;20:377–405. [Google Scholar]
- Taylor PJ, Campbell GK, Van Dyk D, Meester J, Willan K. Genetic variation in the African vlei rat Otomys irroratus (Muridae: Otomyinae). Israel Journal of Zoology. 1992;38:293–305. [Google Scholar]
- Mahida H, Campbell GK, Taylor PJ. Genetic variation in Rhabdomys pumilio (Sparrman 1784) – an allozyme study. South African Journal of Zoology. 1999;34(3):91–101. [Google Scholar]
- Loxterman JL, Moncrief ND, Dueser RD, Carlson CR, Pagels JF. Dispersal abilities and genetic population structure of insular and mainland Oryzomys palustris and Peromyscus leucopus. Journal of Mammalogy. 1998;79(1):66–77. [Google Scholar]
- Wright S. Evolution and the Genetics of Populations, Vol. 4. Variability Within and Among Natural Populations. University of Chicago, Chicago. 1978.
- Nei M. Estimation of average heterozygosity and genetic distance from a small number of individuals. Genetics. 1978;89:583–590. doi: 10.1093/genetics/89.3.583. [DOI] [PMC free article] [PubMed] [Google Scholar]
- Van Gulck T, Stoks R, Verhagen R, Sabuni CA, Mwanjabe P, Leirs H. Short-term effects of avian predation on population size and survival of the multimammate rat, Mastomys natalensis (Rodentia, Muridae). Mammalia. 1998;62(3):329–339. [Google Scholar]
- Ferreira JT, Grant WS, Avtalion RR. Workshop on Fish Genetics. CSIR Special Publications, Pretoria. 1984.
- Ridgway GJ, Sherbourne SW, Lewis RD. Polymorphism in the esterases of Atlantic herring. Trans Am Soc. 1970;99:147–151. [Google Scholar]
- Whitt GS. Developmental genetics of the lactate dehydrogenase enzyme of fish. J Expl Zool. 1970;175:1–35. doi: 10.1002/jez.1401750102. [DOI] [PubMed] [Google Scholar]
- Markert CL, Faulhaber I. Lactate dehydrogenase isozyme patterns of fish. J Expl Zool. 1965;159:319–332. doi: 10.1002/jez.1401590304. [DOI] [PubMed] [Google Scholar]
- Poulik MD. Starch gel electrophoresis in a discontinuous system of buffers. Nature. 1957;180:1477–1479. doi: 10.1038/1801477a0. [DOI] [PubMed] [Google Scholar]
- Kephart SR. Starch gel electrophoresis of plant isozymes: a comparative analysis of techniques. Am J Bot. 1990;77:693–712. [Google Scholar]
- Shaw CR, Prasad R. Starch gel electrophoresis of enzymes – a compilation of recipes. Biochem Genet. 1970;4:297–320. doi: 10.1007/BF00485780. [DOI] [PubMed] [Google Scholar]
- Harris H, Hopkinson DA. Handbook of Enzyme Electrophoresis in Human Genetics. North-Holland Publishing Company, Amsterdam. 1976.
- van der Bank FH, van der Bank M. An estimation of the amount of genetic variation in a population of the Bulldog Marcusenius macrolepidotus (Mormyridae). Water SA. 1995;21:265–268. [Google Scholar]
- Swofford DL, Selander RB. BIOSYS-1: A FORTRAN program for the comprehensive analysis of electrophoretic data in population genetics and systematics. J Hered. 1981;72:281–283. [Google Scholar]
- Hogan KM, Hedin MC, Sun Koh H, Davis SK, Greenbaum IF. Systematic and taxonomic implications of karyotypic, electrophoretic, and mitochondrial-DNA variation in Peromyscus from the Pacific northwest. J Mamm. 1993;74(4):819–831. [Google Scholar]
- Patton JL, Selander RK, Smith MH. Genic variation in hybridising populations of gophers (genus Thomomys). Systematic Zoology. 1972;21:263–270. [Google Scholar]


