Abstract
Diabetic nephropathy is a major cause of end-stage renal disease in developed countries. While angiotensin-converting enzyme (ACE) inhibitors are used to treat diabetic nephropathy, how intrarenal ACE contributes to diabetic renal injury is uncertain. Here, two mouse models with different patterns of renal ACE expression were studied to determine the specific contribution of tubular vs. glomerular ACE to early diabetic nephropathy: it-ACE mice, which make endothelial ACE but lack ACE expression by renal tubular epithelium, and ACE 3/9 mice, which lack endothelial ACE and only express renal ACE in tubular epithelial cells. The absence of endothelial ACE normalized the glomerular filtration rate and endothelial injury in diabetic ACE 3/9 mice. However, these mice developed tubular injury and albuminuria and displayed low renal levels of megalin that were similar to those observed in diabetic wild-type mice. In diabetic it-ACE mice, despite hyperfiltration, the absence of renal tubular ACE greatly reduced tubulointerstitial injury and albuminuria and increased renal megalin expression compared with diabetic wild-type and diabetic ACE 3/9 mice. These findings demonstrate that endothelial ACE is a central regulator of the glomerular filtration rate while tubular ACE is a key player in the development of tubular injury and albuminuria. These data suggest that tubular injury, rather than hyperfiltration, is the main cause of microalbuminuria in early diabetic nephropathy.
Keywords: angiotensin-converting enzyme, glomerular hyperfiltration, megalin, microalbuminuria, tubulointerstitial fibrosis
INTRODUCTION
Diabetic nephropathy affects one in every four diabetic patients and is a leading cause of end-stage renal disease (18). Therapeutic targeting of the renin angiotensin system (RAS) through angiotensin-converting enzyme (ACE) inhibitors (30) and angiotensin II type 1 receptor blockers (7) is an established treatment for diabetic kidney disease. Yet, the circulating RAS is suppressed in diabetic patients (13, 35). This observation, and several other studies, suggest that the intrarenal RAS plays an important role in the progression of diabetic nephropathy (4, 10, 29). Within the kidney, ACE is made by many different cell types including podocytes, mesangial cells, and endothelial cells and in large amounts by the tubular epithelium (1, 31). However, the exact contribution of tissue-specific ACE expression to the hyperfiltration and microalbuminuria observed in diabetic nephropathy is largely unknown.
Endothelial dysfunction in the glomeruli has been considered the major contributor to urinary excretion of albumin (39). Indeed, albuminuria is usually used as a marker of glomerular injury in several renal disorders, including diabetic nephropathy. However, proximal tubular epithelium can reabsorb substantial amount of filtered albumin through two major endocytic receptors, megalin and cubilin (33). Thus albuminuria may reflect the balance between glomerular filtration and tubular uptake of albumin (12, 15, 16, 44). Although diabetic nephropathy is conceived predominantly as a glomerular disease in which there is hyperfiltration in response to high glucose, tubulointerstitial injury is also a major characteristic of diabetic nephropathy and is an important factor for the progression of renal disease (6, 22). Whether glomerular or tubular dysfunction has the greatest impact on albuminuria in early diabetic nephropathy is still unknown.
Here, using two genetic mouse models, called it-ACE and ACE 3/9, we found that depletion of endothelial ACE normalized hyperfiltration but did not prevent the tubular fibrosis associated with diabetes. In contrast, selectively depleting renal tubular ACE expression did not correct hyperfiltration but did suppress tubular interstitial injury. Furthermore, decreased albuminuria was seen only in mice with tubular ACE reduction. Thus we present data showing that microalbuminuria during early diabetic nephropathy follows ACE-mediated injury of renal tubules. It does not appear to be a consequence of glomerular endothelial dysfunction and hyperfiltration.
MATERIALS AND METHODS
Animal models.
In it-ACE mice, ACE mRNA in the renal tubules was silenced using two different types of “short hairpin” RNAs as previously described (20). The it-ACE mice have normal ACE distribution except in the renal tubules. ACE 3/9 mice were generated after crossing the ACE 3/3 with the ACE 9/9 mice (20). Briefly, ACE expression of ACE 3/3 mice is under the control of the albumin promoter. In these mice, the main source of ACE was hepatocytes with normal plasma ACE activity and normal blood pressure (14). ACE expression in ACE 9/9 mice was restricted to renal tubular epithelium by using the Ksp-cadherin/β-globin promoter to express ACE. ACE 9/9 mice have no plasma ACE activity and low blood pressure compared with wild-type (WT) (23). In the compound heterozygous ACE 3/9 mice, ACE expression was restricted to the renal tubular epithelium with preserved plasma ACE activity that assures normal blood pressure. The genetic background of it-ACE, ACE 3/9, and control WT mice used in this study is a mixture of SV129j and C57BL/6. All WT mice used in this study were generated either by breeding heterozygous it-ACE mice or ACE 3/WT with ACE 9/WT mice. We confirmed that there were no differences in physiological parameters, ACE activity, glomerular filtration rate (GFR), albuminuria, and glomerular and tubular injury between WT mice from the it-ACE colony and the ACE 3/9 colony. Thus WT mice obtained from both colonies were pooled for analysis.
Diabetic model induced by streptozotocin.
All protocols using animals were approved by the Cedars-Sinai Institutional Animal Care and Use Committee and conducted in accordance with the National Institutes of Health Guide for the Care and Use of Laboratory Animals. Experiments were conducted in 8- to 12-wk-old male mice and WT mice of the corresponding genetic background. Diabetes was induced by five consecutive daily intraperitoneal injections of streptozotocin (Sigma, St. Louis, MO; 55 mg/kg, freshly prepared in 0.05 M sodium citrate buffer, pH 4.5) after a 6-h fast (40). Nondiabetic groups received citrate buffer. A week after the last streptozotocin injection, blood glucose levels were measured, and mice that failed to reach hyperglycemia (>200 mg/dl) were excluded from the study. Blood glucose levels were monitored every month using the Contour Blood Glucose Monitoring System (Bayer HealthCare, Tarrytown, NY). Systolic blood pressure was monitored in conscious mice every month using a tail-cuff method (Visitech BP2000 system; Visitech Systems, Apex, NC). All mice were euthanized for sample collection after 6 mo of diabetes.
Assessment of urine.
Twenty-four hour urine samples were collected in metabolic cages every month. Urinary albumin concentration was measured by ELISA (Albuwell M; Exocell, Philadelphia, PA). Urinary levels of kidney injury molecule-1 (KIM-1) were assessed by ELISA (DuoSet; R&D Systems, Minneapolis, MN).
GFR measurements.
GFR was determined in conscious mice by monitoring fluorescent intensity using a transcutaneous detector (NIC-Kidney; MediBeacon, Mannheim, Germany) for 90 min after a single intravenous bolus of FITC-sinistrin (15 mg/100 g body wt; Fresenius Kabi Austria, Linz, Austria) (19–21, 37). To determine GFR, the half-life time of FITC-sinistrin was calculated using a one- or three-compartment model when appropriate according to the manufacturer’s instructions (37).
Measurement of ACE activity.
Tissue and plasma ACE activities were assessed as previously described (5, 32). Briefly, snap-frozen tissues were gently homogenized in 20 mM HEPES (pH 7.3) and centrifuged at 3,000 g for 15 min at 4°C. The supernatant was discarded, and the pellets were vigorously rehomogenized in 20 mM HEPES with 0.5% Triton X-100 (pH 7.3). After a second centrifugation at 20,000 g for 20 min at 4°C, the supernatant was collected and the protein concentration was determined using a Pierce BCA protein assay kit (Thermo Scientific, Rockford, IL). ACE activity was measured by colorimetric assay using the substrate Hip-Gly-Gly (Bachem, Torrance, CA) and the assay reagent TNBS (Sigma) with and without the ACE inhibitor captopril. Only the hydrolytic activity inhibited by captopril was considered for calculations.
Assessment of megalin in total kidney homogenate.
At the end of the protocol, mice were euthanized and kidneys were quickly excised. Megalin was assessed by immunoblot as described previously (42). For this, whole kidney protein extracts (40 μg) were denatured, resolved by SDS-PAGE and transferred into pPVDF membranes (Millipore Immobilon-FL; EMD Millipore, Billerica, MA), blocked (Odyssey blocking buffer, Lincoln, NE), and then probed with a specific antibody against megalin (1:1,000; Abcam, Cambridge, MA). After being washed, membranes were incubated with the appropriate fluorochrome-labeled secondary antibody. β-Actin (1:5,000; Sigma-Aldrich) was measured to verify uniform protein loading. Signals on immunoblots were detected and quantitated with the Odyssey Infrared Imaging System (Li-COR, Lincoln, NE). Values were normalized to mean intensity of the nondiabetic WT group defined as 100%.
Measurement of renal cytokines and angiotensin II levels.
For the measurement of renal cytokines, snap-frozen kidney was homogenized in RIPA buffer containing 1× protease inhibitor cocktail (Roche, Indianapolis, IN), 1 mM PMSF, 10 μg/ml pepstain A, and 5 mM EDTA. After centrifugation at 19,000 g for 30 min at 4°C, the supernatant was collected and the protein concentration was determined using a BCA protein assay. IL-1β, TNF-α, and transforming growth factor-β (TGF-β) levels in whole kidney lysate were measured using ELISA kits (eBioscience, San Diego, CA). Renal angiotensin II was determined with an enzyme immunoassay (Peninsula Laboratories International, San Carlos, CA). For this, the whole kidney was weighed and homogenized with ice-cold methanol. After centrifugation at 12,000 g for 10 min at 4°C, the collected supernatant was dried by centrifugal evaporation. Dried pellets were rehydrated with the buffer provided by the kit. Angiotensin II was measured following the manufacturer’s instruction as previously described (20).
Histological examination.
Kidneys were fixed with 10% buffered formalin and embedded in paraffin. Four-micrometer-thick sections of renal tissues were stained with periodic acid-Schiff (PAS) and Sirius red. Whole slide scanning at ×20 magnification was performed by Aperio ScanScope AT Turbo (Leica Biosystems, Wetzlar, Germany). All glomeruli (~80–120 glomeruli) on the whole slide image (PAS staining) were analyzed to determine the glomerular size and PAS mesangial matrix using ImageJ software (National Institutes of Health, https://imagej.nih.gov/ij). For the assessment of tubulointerstitial fibrosis in cortex, total cortical area and fibrotic area from a whole slide image (Sirius red staining) were measured using ImageJ software.
Hydroxyproline assay.
Renal levels of hydroxyproline were assessed using a colorimetric assay kit (Cell Biolabs, San Diego, CA). Briefly, 15 mg of tissue were homogenized in 150 μl of water and transferred to a pressure-tight vial with polytetrafluoroethylene-lined cap. After addition of 150 μl of 12 N hydrochloric acid, vials were closed tightly, and the samples were hydrolyzed at 120°C for 3 h. Samples were cleared with activated charcoal and dried to remove any residual hydrochloric acid. The obtained dried residues were reconstituted with 0.1 M HCl and oxidized with chloramine T for 30 min at room temperature. Finally, samples were mixed with Ehrlich’s reagent and incubated for 90 min at 60 °C. The absorbance was measured at 560 nm using a spectrophotometer (28). The results are expressed as micrograms of hydroxyproline per milligrams of kidney.
Immunohistochemistry.
Four-micrometer-thick sections of paraffin-embedded renal tissues were stained as previously described (17). Briefly, after antigen retrieval with Target Retrieval Solution (Dako, Glostrup, Denmark) for 10 min at 98°C, slides were incubated with a rabbit polyclonal anti-ACE antibody (1:4,000, made by Dr. K, Bernstein) overnight at 4°C. An avidin-biotin-horseradish peroxidase detection system (ABC Elite; Vector Laboratories, Burlingame, CA) was used for DAB color development. After being counterstained with hematoxylin, slides were scanned with a Aperio ScanScope AT Turbo (magnification ×20) and representative images were obtained from whole slide images as described above.
Electron microscopy study.
Renal cortical tissues were fixed in 3% glutaraldehyde. Ultrathin sections of plastic-embedded tissue were processed for electron microscopy as previously described (24). Transmission electron microscopy images at ×10,000 magnification were obtained using a JEM-1010 or 100CX transmission electron microscope (JEOL, Tokyo, Japan). Glomerular basement membrane (GBM) thickness and podocyte foot process width were assessed as previously described (38). To assess endothelial injury, fenestrae density (number of fenestrae per μm of GBM) and endothelial thickness were measured. Three different fields per glomerulus, three glomeruli per mouse in three mice for each nondiabetic genotype, and five mice for each diabetic genotype were examined. A total of 30 points of GBM, 60 foot processes, 60 fenestrae, and 60 points of endothelial thickness were evaluated for each glomerulus using ImageJ software.
Statistical analyses.
All statistical analyses were performed using GraphPad Prism 6.04 (GraphPad Software, San Diego, CA). Results are presented as the means ± SE. Differences among the three genotypes with a single factor were compared by one-way ANOVA. Differences between nondiabetic and diabetic mice within the same genotype and the differences between diabetic WT and mutant mice were compared by two-way ANOVA. Changes in data collected over time were analyzed by two-way repeated-measures ANOVA. Multiple comparisons of these analyses were corrected by Tukey’s honest significant difference test or Sidak’s test, when appropriate. For all tests, a two-tailed P < 0.05 was considered to be statistically significant.
RESULTS
Baseline tissue ACE activity and distribution in it-ACE and ACE 3/9 mice.
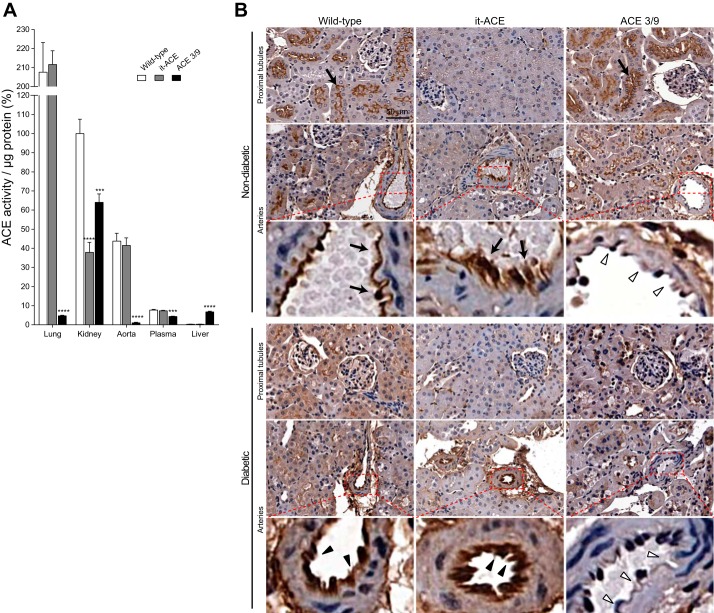
In it-ACE mice, ACE mRNA is specifically silenced in renal tubular epithelial cells using short-hairpin RNAs (20). In contrast, ACE 3/9 mice have targeted changes in the ACE gene-restricting ACE expression to renal tubular cells and hepatocytes (20). We measured ACE activity in individual organs of both models at baseline. As previously observed by our group (20), in the kidney of it-ACE mice, ACE activity was 38 ± 5% of WT mice. In all other organs, ACE activity was equivalent to WT mice (Fig. 1A). The immunohistochemical analysis verified that it-ACE mice had no or very low ACE expression in proximal tubules, whereas ACE expression in the arteries was similar to WT mice (Fig. 1B).
Fig. 1.
A: the angiotensin-converting enzyme (ACE) activity of individual organs was corrected by protein concentration and expressed as percentage of wild-type (WT) kidney ACE activity. Values represent means ± SE; n = 8–11; ***P < 0.001 and ****P < 0.0001 vs. WT mice. B: representative images of ACE immunostaining at baseline (top) and after 6 mo of diabetes induction (bottom). Black arrows indicate ACE expressions in the proximal tubules and arteries at baseline. Black arrowheads indicate ACE expressions in arteries 6 mo after induction of diabetes. White arrowheads indicate no ACE expression in arteries from diabetic and nondiabetic ACE 3/9 mice. Diabetic WT and ACE 3/9 mice revealed decreased ACE expression in proximal tubules. No tubular ACE expression was observed in diabetic and nondiabetic it-ACE mice. Original magnification: ×20.
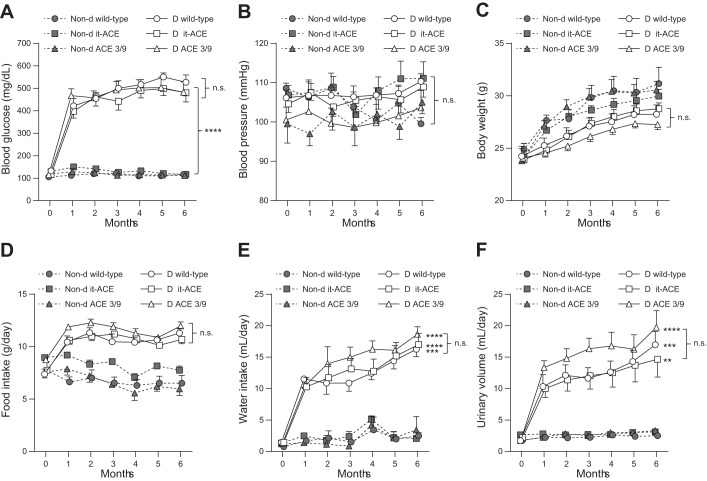
ACE 3/9 mice have 64 ± 4% of renal ACE activity compared with WT mice. Liver ACE activity is ~23-fold higher than the very low levels of ACE in WT liver. ACE activity in other organs was very low compared with WT, except plasma ACE, which was 57 ± 3% of WT mice (Fig. 1A). Renal immunohistochemistry from ACE 3/9 mice showed that ACE expression in proximal tubules was similar to WT mice but there was no ACE expression in arteries (Fig. 1B). As previously observed (20), the differential expression of ACE in it-ACE and ACE 3/9 mice does not affect blood pressure. Both mouse models have normal blood pressure at baseline (Fig. 2B).
Fig. 2.
Monthly measurements of blood glucose (A), systolic blood pressure (B), body weight (C), food intake (D), water intake (E), and urinary volume (F) during 6 mo of diabetes. Values represent means ± SE; n = 10–12; **P < 0.01, ***P < 0.001, and ****P < 0.0001 vs. the respective nondiabetic control. D, diabetic; Non-d, nondiabetic.
Phenotypic characterization and tissue ACE activity after the induction of diabetes.
Diabetes was induced in it-ACE, ACE 3/9, and WT littermates using low doses of streptozotocin. Only mice with a blood glucose level higher than 200 mg/dl a week after the last streptozotocin injection were included in this study. After 6 mo of diabetes, there were no differences in blood glucose and systolic blood pressure among the three diabetic groups (Fig. 2, A and B). Diabetic WT and ACE 3/9 mice had significantly higher kidney/body weight ratio than nondiabetic controls. In contrast, it-ACE mice had no significant changes in kidney weight after the induction of diabetes (Table 1). Body weight decreased significantly in WT and ACE 3/9 mice after the induction of diabetes. Although body weight in it-ACE mice was also decreased compared with nondiabetic control, it did not reach statistical significance (Table 1 and Fig. 2C). No statistical differences in water and food intake were found among the three diabetic groups throughout the study (Fig. 2, D and E). As expected, urinary volume from the three diabetic groups was markedly increased as compared with nondiabetic controls. There was no statistical difference in urinary volume among the three diabetic groups throughout the study (Table 1 and Fig. 2F). In addition, urine osmolality and urinary glucose were also elevated in the three groups of diabetic mice but no differences between diabetic groups were found (Table 1).
Table 1.
Renal phenotype 6 mo after induction of diabetes
| Wild-Type |
it-ACE |
ACE 3/9 |
||||
|---|---|---|---|---|---|---|
| Characteristic | Nondiabetic | Diabetic | Nondiabetic | Diabetic | Nondiabetic | Diabetic |
| Body weight, g | 31.2 ± 1.5 | 26.7 ± 1.0a | 30.2 ± 0.8 | 26.9 ± 0.7 | 31.4 ± 1.1 | 25.7 ± 0.8b |
| Kidney weight, mg | 177.2 ± 9.0 | 207.5 ± 10.5 | 181.8 ± 6.8 | 190.4 ± 9.4 | 167.5 ± 5.1 | 191.6 ± 9.0 |
| Kidney weight/body weight, mg/g | 5.7 ± 0.2 | 7.5 ± 0.2c | 6.1 ± 0.1 | 6.9 ± 0.3 | 5.3 ± 0.1 | 7.5 ± 0.3c |
| Urinary volume, ml/day | 2.5 ± 0.4 | 17.0 ± 2.1b | 3.1 ± 0.4 | 14.7 ± 2.8b | 3.3 ± 0.5 | 19.7 ± 2.7c |
| Urine osmolality, mosmol/kgH2O | 2.9 ± 0.5 | 12.5 ± 2.8c | 3.0 ± 0.3 | 11.8 ± 1.5c | 3.5 ± 0.9 | 13.9 ± 1.0c |
| Urinary glucose, mg/day | N.D. | 132 ± 12 | N.D. | 129 ± 13 | N.D. | 137 ± 14 |
Values represent means ± SE. N.D., not detected.
P < 0.05 vs. respective nondiabetic control.
P < 0.01 vs. respective nondiabetic control.
P < 0.001 vs. respective nondiabetic control.
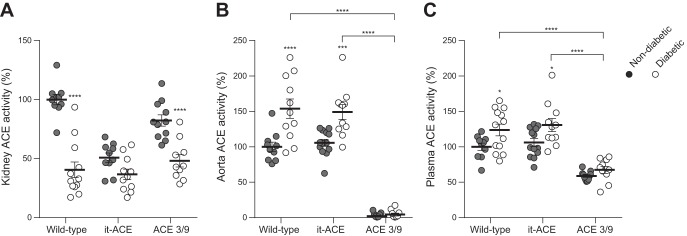
After the induction of diabetes, the analysis of renal ACE distribution by immunohistochemistry revealed decreased ACE expression in the proximal tubules without changes in arteries (Fig. 1B). In WT and ACE 3/9 mice, whole kidney ACE activity was significantly decreased compared with nondiabetic controls (WT: 60% reduction; ACE 3/9: 42% reduction compared with nondiabetic controls, P < 0.0001; Fig. 3A). In it-ACE mice, renal ACE activity was slightly decreased after induction of diabetes, but this difference did not reach statistical significance (Fig. 3A). The activity of aortic ACE, a surrogate of endothelial ACE, was increased in diabetic WT and it-ACE mice. No aortic ACE was detected in ACE 3/9 mice (Fig. 3B). Plasma ACE activity was significantly increased in diabetic WT and it-ACE mice (Fig. 3C). In ACE 3/9 mice, plasma ACE remained unchanged throughout the study.
Fig. 3.
Whole kidney (A), aorta (B), and plasma (C) ACE activity was corrected by protein concentration and expressed as % ACE activity of the nondiabetic wild-type mice. Values represent means ± SE; n = 10–12; *P < 0.05, ***P < 0.001 and ****P < 0.0001 vs. the respective nondiabetic control.
Endothelial ACE and tubular ACE differentially contribute to glomerular hyperfiltration and albuminuria.
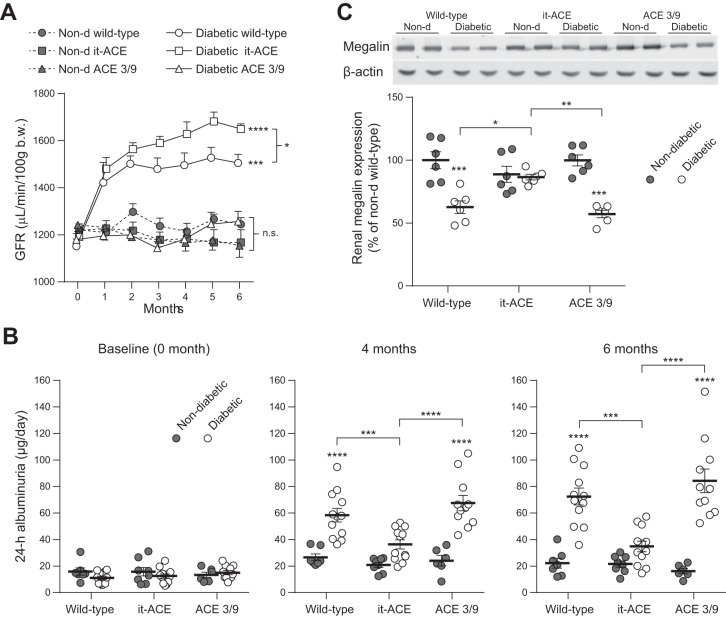
Monthly measurements of GFR were performed using a transcutaneous GFR method as described previously (19–21, 37). Even after 1 mo of diabetes, both diabetic WT and it-ACE mice displayed a significant increase of 18–21% in GFR compared with nondiabetic littermates (Fig. 4A). Glomerular hyperfiltration remained throughout the 6-mo study. Indeed, after 6 mo of diabetes, it-ACE mice had a significantly higher GFR than WT mice (Fig. 4A). In contrast, the absence of endothelial ACE in ACE 3/9 mice was associated with no significant changes in the GFR during the study (Fig. 4A).
Fig. 4.
A: Monthly assessment of glomerular filtration rate (GFR) was performed for 6 mo after diabetes induction. GFR was evaluated using a transcutaneous detector after a single intravenous bolus of FITC-sinistrin. Values represent means ± SE; n = 4–8. B: 24-h albuminuria excretion at baseline and after 4 and 6 mo of diabetes. C: renal expression of megalin was assessed in total kidney homogenate by Western blot. *P < 0.05, **P < 0.01, ***P < 0.001, and ****P < 0.0001 vs. nondiabetic control. Non-d, nondiabetic.
Microalbuminuria was evaluated at baseline and after 4 and 6 mo of diabetes induction (Fig. 4B). After 6 mo, the levels of microalbuminuria were increased in diabetic WT and ACE 3/9 mice compared with nondiabetic littermates (diabetic WT: 3.3 ± 0.3-fold increase; diabetic ACE 3/9: 5.2 ± 0.5-fold increase compared with nondiabetic littermates; Fig. 4B). Similar levels of microalbuminuria were observed after 4 mo of diabetes. In diabetic it-ACE mice, despite hyperfiltration, no significant increase of albuminuria was observed after the induction of diabetes (1.6 ± 0.2-fold increase vs. nondiabetic it-ACE, P = 0.37; Fig. 4B). Thus diabetic it-ACE mice have much lower albuminuria than equally treated WT or ACE 3/9 mice.
To explore the mechanism underlying the differences in albuminuria among diabetic WT, it-ACE, and ACE 3/9 mice, we studied the proximal tubule endocytic receptor megalin, which facilitates transcytosis of filtered proteins including albumin (33). Both diabetic WT and diabetic ACE 3/9 mice have lower levels of renal megalin compared with nondiabetic controls (WT: 38% reduction and ACE 3/9: 43% reduction compared with nondiabetic controls, P < 0.001; Fig. 4C). In contrast, renal megalin remained unchanged in it-ACE mice after the induction of diabetes (Fig. 4C).
Both tubular and endothelial ACE contribute to the diabetic glomerular changes during diabetes.
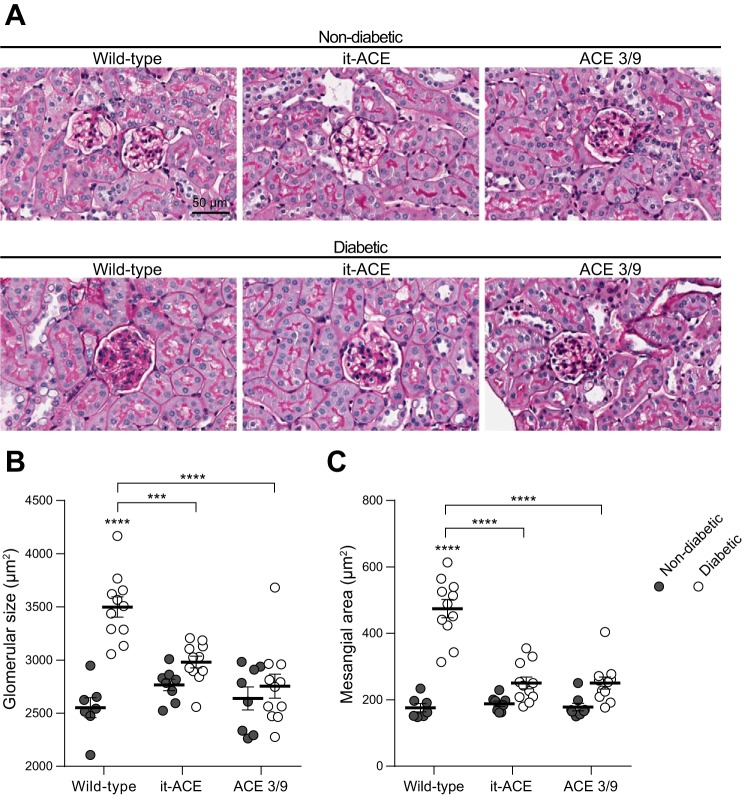
To further explore the level of glomerular injury between WT, it-ACE and ACE 3/9 mice, we performed a histological evaluation of glomerular structural changes using periodic acid-Schiff staining (Fig. 5A). No focal glomerulosclerosis or nodular lesion was observed in any groups. Glomerular size was significantly increased in diabetic WT compared with nondiabetic controls (37.1 ± 3.7% increase; Fig. 5B). Similarly, mesangial expansion was significantly higher in diabetic WT than nondiabetic WT (2.7 ± 0.1-fold increase compared with nondiabetic; Fig. 5C). In both diabetic it-ACE and diabetic ACE 3/9 mice, glomerular size and mesangial expansion were not significantly increased compared with nondiabetic controls. In it-ACE mice, glomerular size increased by 8 ± 2% and mesangial expansion increased by 1.3 ± 0.1-fold. In ACE 3/9 mice, glomerular size increased by 4 ± 4% and mesangial expansion increased by 1.4 ± 0.1-fold (Fig. 5, B and C).
Fig. 5.
A: representative images of periodic acid-Schiff (PAS) staining. Original magnification: ×20. Quantification of glomerular size (B) and mesangial area (C) were evaluated using PAS staining. After whole slide scanning, all glomeruli (80–120 glomeruli) were evaluated to assess the glomerular size and mesangial matrix expansion using ImageJ software. Data are represented as individual values for each mouse (dots). Horizontal bars represent the means ± SE; ***P < 0.001 and ****P < 0.0001 vs. the respective nondiabetic control.
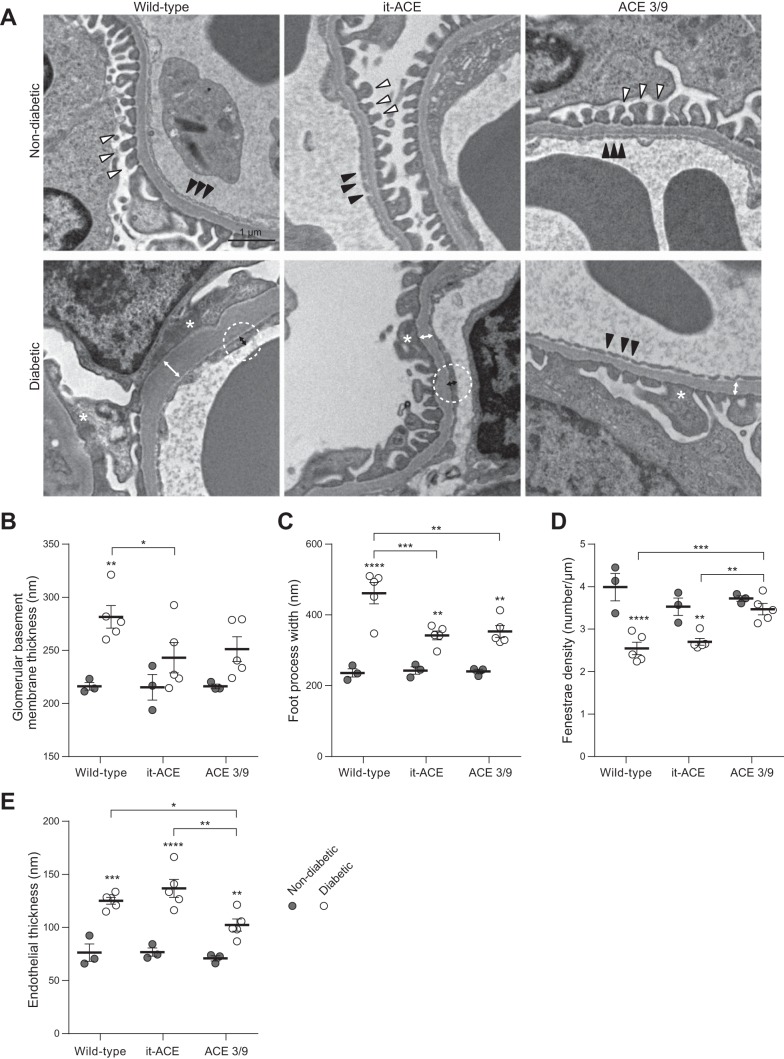
We performed further assessment of glomerular ultrastructural changes using electron microscopy. GBM thickening was significantly increased after induction of diabetes in WT mice (216 ± 4 vs. 282 ± 11 nm, P < 0.01; Fig. 6, A and B). On the contrary, GBM was not significantly increased after diabetes in it-ACE (215 ± 12 vs. 243 ± 14 nm) and ACE 3/9 mice (216 ± 2 vs. 251 ± 12 nm; Fig. 6, A and B). Similarly, foot process widening was significantly reduced in diabetic it-ACE (342 ± 13 nm) and ACE 3/9 (353 ± 17 nm) mice compared with diabetic WT mice (461 ± 30 nm; Fig. 6, A and C). There was no statistical difference in GBM thickness and foot process width between the diabetic it-ACE and diabetic ACE 3/9 groups. In terms of endothelial injury, fenestrae density was significantly decreased in diabetic WT (2.5 ± 0.1 μm) and diabetic it-ACE (2.7 ± 0.1 μm) compared with diabetic ACE 3/9 mice (3.5 ± 0.1 μm; Fig. 6D). Similarly, endothelial thickness was significantly increased in diabetic WT (125 ± 3 nm) and diabetic it-ACE (136 ± 8 nm) compared with diabetic ACE 3/9 mice (102 ± 6 nm; Fig. 6E).
Fig. 6.
A: representative electron micrographs of glomeruli. White and black arrowheads indicate normal foot processes and fenestrae structures, respectively. Asterisks indicate foot process effacement. White and black bidirectional arrows indicate glomerular basement membrane (GBM) thickness and endothelial thickness in diabetic groups, respectively. Original magnification: ×10,000. Quantification of GBM thickness (B) and foot process (C) width, fenestrae density (D; number of fenestrae per μm of GBM), and endothelial thickness (E) was determined from 3 different fields per glomerulus. Each dot represents the average of the value obtained for each mouse. Three glomeruli were assessed per mouse. Horizontal bars represent the means ± SE; n = 3–5; *P < 0.05, **P < 0.01, ***P < 0.001, and ****P < 0.0001 vs. the respective nondiabetic control.
Tubular ACE, but not endothelial ACE, contributes to renal fibrosis and inflammation.
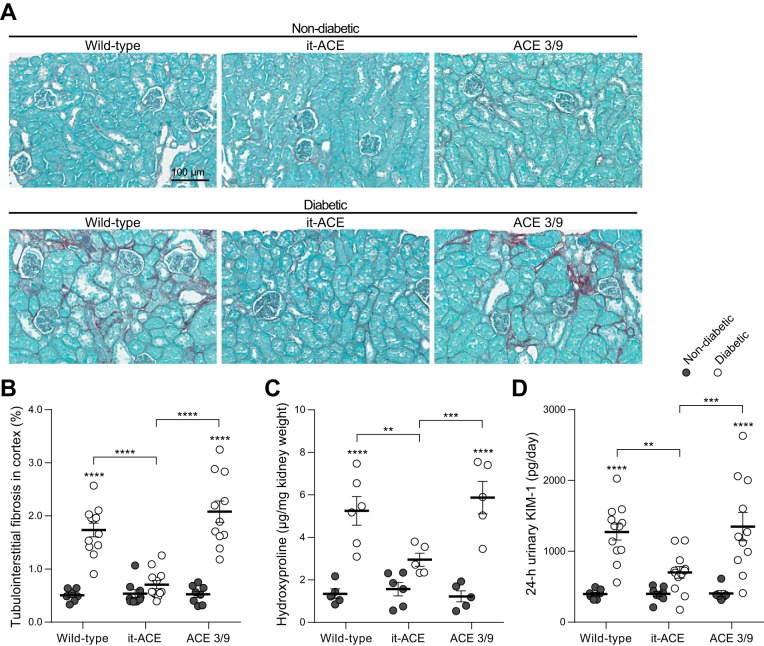
Further assessment of renal tubular injury was performed by Sirius red staining to evaluate fibrosis. Renal cortexes revealed increased tubulointerstitial fibrosis in diabetic WT and diabetic ACE 3/9 mice compared with respective nondiabetic control mice (nondiabetic WT: 0.5 ± 0.0% vs. diabetic WT: 1.7 ± 0.1% of total cortical area; nondiabetic ACE 3/9: 0.5 ± 0.1% vs. diabetic ACE 3/9: 2.1 ± 0.2% of total cortical area, P < 0.0001; Fig. 7, A and B). In it-ACE mice, the induction of diabetes was not associated with increased tubulointerstitial fibrosis (0.5 ± 0.1 vs. 0.7 ± 0.1% of total cortical area, P = 0.70; Fig. 7, A and B). Indeed, after 6 mo of diabetes, tubulointerstitial fibrosis in diabetic it-ACE was significantly lower compared with diabetic WT or diabetic ACE 3/9 mice. The histological analysis of fibrosis was further confirmed by quantification of hydroxyproline, a major component of collagen, in total kidney homogenates. The levels of hydroxyproline were significantly increased in the kidney of WT and ACE 3/9 diabetic mice compared with nondiabetic control mice (nondiabetic WT: 1.3 ± 0.2 µg/mg kidney vs. diabetic WT: 5.2 ± 0.7 µg/mg kidney; nondiabetic ACE 3/9: 1.6 ± 0.3 µg/mg kidney vs. diabetic ACE 3/9: 5.9 ± 0.8 µg/mg kidney, P < 0.0001; Fig. 7C). In diabetic it-ACE mice, renal hydroxyproline was significantly lower compared with WT and ACE 3/9 diabetic mice (2.9 ± 0.3 µg/mg kidney, P < 0.05 vs. other diabetic groups; Fig. 7C).
Fig. 7.
A: representative images of Sirius red staining. Original magnification: ×20. B: quantification of tubulointerstital fibrosis in cortex was evaluated using Sirius red staining. After whole slide scanning, total cortical area and fibrotic area in cortex were calculated using ImageJ software. Hydroxyproline levels in kidney homogenate (C) and 24-h urinary kidney injury molecule-1 (KIM-1) excretion (D) after 6 mo of diabetes. Data are represented as individual values for each mouse (dots). Horizontal bars represent the means ± SE; **P < 0.01, ***P < 0.001 and ****P < 0.0001 vs. the respective nondiabetic control.
The 24-h urinary KIM-1 excretion in diabetic WT and ACE 3/9 mice was significantly increased compared with nondiabetic control mice (diabetic WT: 3.2 ± 0.3-fold increase; diabetic ACE 3/9: 3.3 ± 0.5-fold increase compared with nondiabetic littermates). Strikingly, no significant changes in urinary KIM-1 levels were found in diabetic it-ACE mice before and after induction of diabetes (1.7 ± 0.2-fold increase compared with nondiabetic, P = 0.23; Fig. 7D). The levels of KIM-1 in diabetic it-ACE were significantly lower compared with diabetic WT or diabetic ACE 3/9 mice.
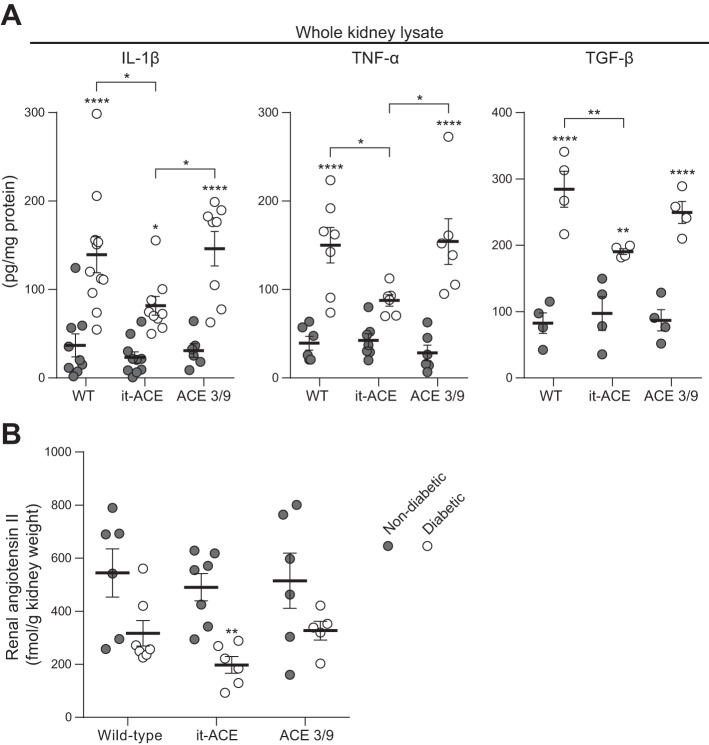
Next, we measured inflammatory cytokines in whole kidney homogenates by ELISA. Renal IL-1β, TNF-α, and TGF-β levels were increased after induction of diabetes in all experimental groups. However, these cytokines were significantly lower in diabetic it-ACE mice compared with the other two diabetic groups (Fig. 8A).
Fig. 8.
IL-1β, TNF-α, and transforming growth factor-β (TGF-β; A) together with intrarenal angiotensin II (B) levels were measured in whole kidney lysate using commercial enzyme immunoassays. Data are represented as individual values for each mouse (dots). Horizontal bars represent the means ± SE; *P < 0.05, **P < 0.01, and ****P < 0.0001 vs. the respective nondiabetic control.
Finally, we evaluated whether the inflammatory process in the diabetic kidney was associated with abnormal intrarenal angiotensin II levels. After 6 mo of diabetes, intrarenal angiotensin II decreased in all diabetic groups compared with the respective nondiabetic control groups. However, this reduction only reached statistical significance in it-ACE mice. After 6 mo of diabetes, renal angiotensin II decreased 58 ± 9% in WT (P = 0.053), 64 ± 7% in ACE 3/9 (P = 0.19), and 40 ± 6% in it-ACE mice (P < 0.01; Fig. 8B). No statistical differences in renal angiotensin II levels were observed among the three diabetic groups.
DISCUSSION
Worldwide, diabetes affects ~415 million people, and its prevalence is still growing (27). Diabetic nephropathy remains the most common cause of end-stage renal disease, accounting for 25–40% of patients starting dialysis (18). While ACE inhibitors are often used to treat diabetic nephropathy, precisely how intrarenal ACE contributes to diabetic renal injury is uncertain (10, 29). What has been documented is that during diabetes, ACE expression by tubular epithelium is reduced (3, 34, 46) while glomerular endothelial ACE expression is increased (3, 46). Indeed, our current findings in WT mice (Fig. 3) agree with these observations. Yet how ACE expression by each of these cell types contributes to renal injury is unknown. Here, using two different mouse models, we found that tubular ACE contributes to tubulointerstitial injury and fibrosis, renal hypertrophy, and, most importantly, microalbuminuria. In contrast, endothelial ACE influenced glomerular hyperfiltration and endothelial injury, while both tubular and endothelial ACE contributed to glomerular injury. Thus these studies suggest that tubular injury, but not glomerular hyperfiltration, is the main contributor to microalbuminuria in early diabetic nephropathy induced by streptozotocin. These data agree with previous studies showing that proximal tubules can reabsorb a substantial amount of filtered albumin, and they underline that albuminuria reflects the balance between glomerular filtration and tubular uptake of albumin (12, 15, 16, 44). Clearly, tubular injury upsets this balance and promotes albumin loss.
To examine the mechanism that protects from albuminuria in it-ACE diabetic mice, we studied the multiligand endocytic receptor megalin. This receptor is expressed in proximal tubular cells and participates in the reuptake and endocytosis of several proteins including albumin (11, 16). Many pathological conditions that cause tubular injury and albuminuria are associated with decreased expression of megalin (33). Indeed, our current results with WT mice (Fig. 4C) agree with previous studies showing that early diabetic nephropathy is associated with lower expression of megalin (47). Strikingly, we observed that renal levels of megalin remained unchanged in diabetic mice lacking renal tubular ACE. This suggests that the mechanism behind lower albuminuria in diabetic it-ACE mice is due to a preserved megalin-mediated reuptake of albumin by the proximal tubular epithelium. It is unknown whether megalin regulation is a direct consequence of ACE activity or tubular injury. In renal pathologies such as acute kidney injury, chronic kidney disease, ischemia-reperfusion kidney injury, lipopolysaccharide-induced endotoxemia, diabetes, and hypertension, the presence of megalin dysfunction coexists with tubular injury (33). These findings suggest that ACE-mediated tubular injury, rather than ACE itself, is the direct contributor to the abnormal levels of megalin observed in our experimental model of diabetic nephropathy.
Several clinical studies have demonstrated that normalizing hyperfiltration contributes to the reduction of proteinuria and exerts a renoprotective effect in diabetic patients with overt proteinuria (7, 30, 36). Different from diabetic patients with nephrotic-range proteinuria, diabetic rodent models do not have the severe glomerular changes typified by Kimmelstiel-Wilson lesions or glomerulosclerosis. In this study, we did not examine advanced diabetic nephropathy where the contribution of hyperfiltration and renal ACE expression to the progression of the disease may be different from earlier stages of diabetic nephropathy.
An important finding of this study is that tubular ACE contributes to tubulointerstitial fibrosis and renal hypertrophy. Proinflammatory cytokines, especially TGF-β, affect renal tubular cells and have a crucial role in renal hypertrophy (41, 45). In this study, we confirmed that IL-1-β, TNF-α, and TGF-β are reduced in the kidneys of diabetic it-ACE mice compared with diabetic WT animals. Comper et al. (15) proposed that angiotensin II and TGF-β play an important role in the induction of albuminuria through promotion of lysosomal dysfunction in diabetes and hypertension. Our studies add further data to this concept and stress that tubular ACE probably affects both local angiotensin II generation and a local proinflammatory environment conducive to diabetic-induced albuminuria.
In this study, both endothelial and tubular ACE contributed to glomerular injury (Figs. 5 and 6). It is perhaps not surprising that removing endothelial ACE normalized hyperfiltration and reduced glomerular endothelial injury. Hyperfiltration is injurious to glomeruli in several renal disorders, including diabetic nephropathy (8). Angiotensin II is important in glomerular hyperfiltration due to vascular constriction and an increase in intraglomerular pressure. Removing glomerular (endothelial) ACE presumably reduces local glomerular angiotensin II formation thus ameliorating glomerular injury. However, less clear is how tubular ACE/tubular injury promotes glomerular injury. One explanation may be a study by Hasegawa et al. (26) showing that proximal tubules can retrogradely interact with glomeruli and affect glomerular injury. In this study, the authors demonstrated that sirtuin 1 expressed in proximal tubules, can influence podocyte function and protect against albuminuria in diabetes.
In our study, intrarenal angiotensin II was decreased after induction of diabetes in all diabetic groups. Indeed, there was no statistical difference among the three experimental groups after the induction of diabetes. Previous studies showed that whole kidney angiotensin II levels in diabetes can increase (48), decrease, or remain unchanged during the progression of diabetic nephropathy (2, 9, 25, 34, 43). These contradictory results might be a consequence of different models of diabetes or analysis at different time points after the induction of diabetes. Several studies showed that AT1 receptor protein levels in renal cortex are elevated during diabetes, but further studies are needed to understand how intrarenal angiotensin II drives renal inflammation and tubular injury during diabetes (25).
In conclusion, this study shows that tubular epithelial ACE is a key player in tubulointerstitial inflammation while ACE expression in endothelium regulates GFR during diabetes. Even more important, we provide new evidence suggesting that tubular ACE-mediated tubular injury, and not hyperfiltration, is a major contributor to microalbuminuria in early diabetic nephropathy induced by streptozotocin.
GRANTS
This study was supported by a grant from The International Research Fund for Subsidy of Kyushu University School of Medicine Alumni and SENSHIN Medical Research Foundation (to M. Eriguchi); National Institutes of Health (NIH)/National Center for Advancing Translational Science, Univesity of California, Los Angeles, Clinical and Translation Science Institute Grant UL1TR001881 and American Heart Assocation (AHA) Scientist Development Grant 17SDG33660947 (to M. Yamashita); NIH Grants R03-DK-101592 (to R. A. Gonzalez-Villalobos) and R01-HL-110353, R21-AI-114965, and R01-DK-098382 (to K. E. Bernstein); and Cedars-Sinai Internal Funds and AHA Scientist Development Grant 16SDG30130015 (to J. F. Giani).
DISCLOSURES
No conflicts of interest, financial or otherwise, are declared by the authors.
AUTHOR CONTRIBUTIONS
M.E., R.A.G.-V., K.E.B., and J.F.G. conceived and designed research; M.E., M.L., M.Y., T.V.Z., Z.K., E.A.B., S.B.G., and J.F.G. performed experiments; M.E., M.L., M.Y., T.V.Z., Z.K., E.A.B., S.B.G., and J.F.G. analyzed data; M.E., M.L., Z.K., R.A.G.-V., K.E.B., and J.F.G. interpreted results of experiments; M.E. prepared figures; M.E. drafted manuscript; M.E., R.A.G.-V., K.E.B., and J.F.G. edited and revised manuscript; M.E., M.L., M.Y., T.V.Z., Z.K., E.A.B., S.B.G., R.A.G.-V., K.E.B., and J.F.G. approved final version of manuscript.
ACKNOWLEDGMENTS
We thank K. Wawrowsky for assistance in immunohistochemistry studies and B. Taylor for assistance in preparing this article.
REFERENCES
- 1.Alhenc-Gelas F, Baussant T, Hubert C, Soubrier F, Corvol P. The angiotensin converting enzyme in the kidney. J Hypertens Suppl 7: S9–S13, 1989. doi: 10.1097/00004872-198909007-00003. [DOI] [PubMed] [Google Scholar]
- 2.Anderson S. Physiologic actions and molecular expression of the renin-angiotensin system in the diabetic rat. Miner Electrolyte Metab 24: 406–411, 1998. doi: 10.1159/000057402. [DOI] [PubMed] [Google Scholar]
- 3.Anderson S, Jung FF, Ingelfinger JR. Renal renin-angiotensin system in diabetes: functional, immunohistochemical, and molecular biological correlations. Am J Physiol Renal Fluid Electrolyte Physiol 265: F477–F486, 1993. doi: 10.1152/ajprenal.1993.265.4.F477. [DOI] [PubMed] [Google Scholar]
- 4.Bagby SP. Diabetic nephropathy and proximal tubule ROS: challenging our glomerulocentricity. Kidney Int 71: 1199–1202, 2007. doi: 10.1038/sj.ki.5002286. [DOI] [PubMed] [Google Scholar]
- 5.Bernstein KE, Koronyo Y, Salumbides BC, Sheyn J, Pelissier L, Lopes DH, Shah KH, Bernstein EA, Fuchs DT, Yu JJ, Pham M, Black KL, Shen XZ, Fuchs S, Koronyo-Hamaoui M. Angiotensin-converting enzyme overexpression in myelomonocytes prevents Alzheimer’s-like cognitive decline. J Clin Invest 124: 1000–1012, 2014. doi: 10.1172/JCI66541. [DOI] [PMC free article] [PubMed] [Google Scholar]
- 6.Bonventre JV. Can we target tubular damage to prevent renal function decline in diabetes? Semin Nephrol 32: 452–462, 2012. doi: 10.1016/j.semnephrol.2012.07.008. [DOI] [PMC free article] [PubMed] [Google Scholar]
- 7.Brenner BM, Cooper ME, de Zeeuw D, Keane WF, Mitch WE, Parving HH, Remuzzi G, Snapinn SM, Zhang Z, Shahinfar S; RENAAL Study Investigators . Effects of losartan on renal and cardiovascular outcomes in patients with type 2 diabetes and nephropathy. N Engl J Med 345: 861–869, 2001. doi: 10.1056/NEJMoa011161. [DOI] [PubMed] [Google Scholar]
- 8.Brenner BM, Lawler EV, Mackenzie HS. The hyperfiltration theory: a paradigm shift in nephrology. Kidney Int 49: 1774–1777, 1996. doi: 10.1038/ki.1996.265. [DOI] [PubMed] [Google Scholar]
- 9.Campbell DJ, Kelly DJ, Wilkinson-Berka JL, Cooper ME, Skinner SL. Increased bradykinin and “normal” angiotensin peptide levels in diabetic Sprague-Dawley and transgenic (mRen-2)27 rats. Kidney Int 56: 211–221, 1999. doi: 10.1046/j.1523-1755.1999.00519.x. [DOI] [PubMed] [Google Scholar]
- 10.Carey RM, Siragy HM. The intrarenal renin-angiotensin system and diabetic nephropathy. Trends Endocrinol Metab 14: 274–281, 2003. doi: 10.1016/S1043-2760(03)00111-5. [DOI] [PubMed] [Google Scholar]
- 11.Christensen EI, Birn H. Megalin and cubilin: multifunctional endocytic receptors. Nat Rev Mol Cell Biol 3: 256–266, 2002. doi: 10.1038/nrm778. [DOI] [PubMed] [Google Scholar]
- 12.Christensen EI, Birn H, Storm T, Weyer K, Nielsen R. Endocytic receptors in the renal proximal tubule. Physiology (Bethesda) 27: 223–236, 2012. doi: 10.1152/physiol.00022.2012. [DOI] [PubMed] [Google Scholar]
- 13.Christlieb AR, Kaldany A, D’Elia JA. Plasma renin activity and hypertension in diabetes mellitus. Diabetes 25: 969–974, 1976. doi: 10.2337/diab.25.10.969. [DOI] [PubMed] [Google Scholar]
- 14.Cole J, Quach DL, Sundaram K, Corvol P, Capecchi MR, Bernstein KE. Mice lacking endothelial angiotensin-converting enzyme have a normal blood pressure. Circ Res 90: 87–92, 2002. doi: 10.1161/hh0102.102360. [DOI] [PubMed] [Google Scholar]
- 15.Comper WD, Hilliard LM, Nikolic-Paterson DJ, Russo LM. Disease-dependent mechanisms of albuminuria. Am J Physiol Renal Physiol 295: F1589–F1600, 2008. doi: 10.1152/ajprenal.00142.2008. [DOI] [PubMed] [Google Scholar]
- 16.Dickson LE, Wagner MC, Sandoval RM, Molitoris BA. The proximal tubule and albuminuria: really! J Am Soc Nephrol 25: 443–453, 2014. doi: 10.1681/ASN.2013090950. [DOI] [PMC free article] [PubMed] [Google Scholar]
- 17.Eriguchi M, Tsuruya K, Haruyama N, Yamada S, Tanaka S, Suehiro T, Noguchi H, Masutani K, Torisu K, Kitazono T. Renal denervation has blood pressure-independent protective effects on kidney and heart in a rat model of chronic kidney disease. Kidney Int 87: 116–127, 2015. doi: 10.1038/ki.2014.220. [DOI] [PubMed] [Google Scholar]
- 18.Fernandez-Fernandez B, Ortiz A, Gomez-Guerrero C, Egido J. Therapeutic approaches to diabetic nephropathy–beyond the RAS. Nat Rev Nephrol 10: 325–346, 2014. doi: 10.1038/nrneph.2014.74. [DOI] [PubMed] [Google Scholar]
- 19.Giani JF, Bernstein KE, Janjulia T, Han J, Toblli JE, Shen XZ, Rodriguez-Iturbe B, McDonough AA, Gonzalez-Villalobos RA. Salt sensitivity in response to renal injury requires renal angiotensin-converting enzyme. Hypertension 66: 534–542, 2015. doi: 10.1161/HYPERTENSIONAHA.115.05320. [DOI] [PMC free article] [PubMed] [Google Scholar]
- 20.Giani JF, Eriguchi M, Bernstein EA, Katsumata M, Shen XZ, Li L, McDonough AA, Fuchs S, Bernstein KE, Gonzalez-Villalobos RA. Renal tubular angiotensin converting enzyme is responsible for nitro-L-arginine methyl ester (L-NAME)-induced salt sensitivity. Kidney Int 97: 856–867, 2017. doi: 10.1016/j.kint.2016.10.007. [DOI] [PMC free article] [PubMed] [Google Scholar]
- 21.Giani JF, Janjulia T, Kamat N, Seth DM, Blackwell WL, Shah KH, Shen XZ, Fuchs S, Delpire E, Toblli JE, Bernstein KE, McDonough AA, Gonzalez-Villalobos RA. Renal angiotensin-converting enzyme is essential for the hypertension induced by nitric oxide synthesis inhibition. J Am Soc Nephrol 25: 2752–2763, 2014. doi: 10.1681/ASN.2013091030. [DOI] [PMC free article] [PubMed] [Google Scholar]
- 22.Gilbert RE, Cooper ME. The tubulointerstitium in progressive diabetic kidney disease: more than an aftermath of glomerular injury? Kidney Int 56: 1627–1637, 1999. doi: 10.1046/j.1523-1755.1999.00721.x. [DOI] [PubMed] [Google Scholar]
- 23.Gonzalez-Villalobos RA, Billet S, Kim C, Satou R, Fuchs S, Bernstein KE, Navar LG. Intrarenal angiotensin-converting enzyme induces hypertension in response to angiotensin I infusion. J Am Soc Nephrol 22: 449–459, 2011. doi: 10.1681/ASN.2010060624. [DOI] [PMC free article] [PubMed] [Google Scholar]
- 24.Haas M, Mirocha J. Early ultrastructural changes in renal allografts: correlation with antibody-mediated rejection and transplant glomerulopathy. Am J Transplant 11: 2123–2131, 2011. doi: 10.1111/j.1600-6143.2011.03647.x. [DOI] [PubMed] [Google Scholar]
- 25.Harrison-Bernard LM, Imig JD, Carmines PK. Renal AT1 receptor protein expression during the early stage of diabetes mellitus. Int J Exp Diabetes Res 3: 97–108, 2002. doi: 10.1080/15604280214483. [DOI] [PMC free article] [PubMed] [Google Scholar]
- 26.Hasegawa K, Wakino S, Simic P, Sakamaki Y, Minakuchi H, Fujimura K, Hosoya K, Komatsu M, Kaneko Y, Kanda T, Kubota E, Tokuyama H, Hayashi K, Guarente L, Itoh H. Renal tubular Sirt1 attenuates diabetic albuminuria by epigenetically suppressing Claudin-1 overexpression in podocytes. Nat Med 19: 1496–1504, 2013. doi: 10.1038/nm.3363. [DOI] [PMC free article] [PubMed] [Google Scholar]
- 27.Jaacks LM, Siegel KR, Gujral UP, Narayan KM. Type 2 diabetes: A 21st century epidemic. Best Pract Res Clin Endocrinol Metab 30: 331–343, 2016. doi: 10.1016/j.beem.2016.05.003. [DOI] [PubMed] [Google Scholar]
- 28.Jin Y, Liu R, Xie J, Xiong H, He JC, Chen N. Interleukin-10 deficiency aggravates kidney inflammation and fibrosis in the unilateral ureteral obstruction mouse model. Lab Invest 93: 801–811, 2013. doi: 10.1038/labinvest.2013.64. [DOI] [PubMed] [Google Scholar]
- 29.Kobori H, Nangaku M, Navar LG, Nishiyama A. The intrarenal renin-angiotensin system: from physiology to the pathobiology of hypertension and kidney disease. Pharmacol Rev 59: 251–287, 2007. doi: 10.1124/pr.59.3.3. [DOI] [PubMed] [Google Scholar]
- 30.Lewis EJ, Hunsicker LG, Bain RP, Rohde RD; The Collaborative Study Group . The effect of angiotensin-converting-enzyme inhibition on diabetic nephropathy. N Engl J Med 329: 1456–1462, 1993. doi: 10.1056/NEJM199311113292004. [DOI] [PubMed] [Google Scholar]
- 31.Liebau MC, Lang D, Böhm J, Endlich N, Bek MJ, Witherden I, Mathieson PW, Saleem MA, Pavenstädt H, Fischer KG. Functional expression of the renin-angiotensin system in human podocytes. Am J Physiol Renal Physiol 290: F710–F719, 2006. doi: 10.1152/ajprenal.00475.2004. [DOI] [PubMed] [Google Scholar]
- 32.Neels HM, van Sande ME, Scharpé SL. Sensitive colorimetric assay for angiotensin converting enzyme in serum. Clin Chem 29: 1399–1403, 1983. [PubMed] [Google Scholar]
- 33.Nielsen R, Christensen EI, Birn H. Megalin and cubilin in proximal tubule protein reabsorption: from experimental models to human disease. Kidney Int 89: 58–67, 2016. doi: 10.1016/j.kint.2015.11.007. [DOI] [PubMed] [Google Scholar]
- 34.Park S, Bivona BJ, Kobori H, Seth DM, Chappell MC, Lazartigues E, Harrison-Bernard LM. Major role for ACE-independent intrarenal ANG II formation in type II diabetes. Am J Physiol Renal Physiol 298: F37–F48, 2010. doi: 10.1152/ajprenal.00519.2009. [DOI] [PMC free article] [PubMed] [Google Scholar]
- 35.Price DA, Porter LE, Gordon M, Fisher ND, De’Oliveira JM, Laffel LM, Passan DR, Williams GH, Hollenberg NK. The paradox of the low-renin state in diabetic nephropathy. J Am Soc Nephrol 10: 2382–2391, 1999. [DOI] [PubMed] [Google Scholar]
- 36.Schjoedt KJ, Rossing K, Juhl TR, Boomsma F, Tarnow L, Rossing P, Parving HH. Beneficial impact of spironolactone on nephrotic range albuminuria in diabetic nephropathy. Kidney Int 70: 536–542, 2006. doi: 10.1038/sj.ki.5001580. [DOI] [PubMed] [Google Scholar]
- 37.Schreiber A, Shulhevich Y, Geraci S, Hesser J, Stsepankou D, Neudecker S, Koenig S, Heinrich R, Hoecklin F, Pill J, Friedemann J, Schweda F, Gretz N, Schock-Kusch D. Transcutaneous measurement of renal function in conscious mice. Am J Physiol Renal Physiol 303: F783–F788, 2012. doi: 10.1152/ajprenal.00279.2012. [DOI] [PubMed] [Google Scholar]
- 38.Shah A, Xia L, Masson EA, Gui C, Momen A, Shikatani EA, Husain M, Quaggin S, John R, Fantus IG. Thioredoxin-interacting protein deficiency protects against diabetic nephropathy. J Am Soc Nephrol 26: 2963–2977, 2015. doi: 10.1681/ASN.2014050528. [DOI] [PMC free article] [PubMed] [Google Scholar]
- 39.Stehouwer CD, Smulders YM. Microalbuminuria and risk for cardiovascular disease: analysis of potential mechanisms. J Am Soc Nephrol 17: 2106–2111, 2006. doi: 10.1681/ASN.2005121288. [DOI] [PubMed] [Google Scholar]
- 40.Tikellis C, Brown R, Head GA, Cooper ME, Thomas MC. Angiotensin-converting enzyme 2 mediates hyperfiltration associated with diabetes. Am J Physiol Renal Physiol 306: F773–F780, 2014. doi: 10.1152/ajprenal.00264.2013. [DOI] [PubMed] [Google Scholar]
- 41.Vallon V. The proximal tubule in the pathophysiology of the diabetic kidney. Am J Physiol Regul Integr Comp Physiol 300: R1009–R1022, 2011. doi: 10.1152/ajpregu.00809.2010. [DOI] [PMC free article] [PubMed] [Google Scholar]
- 42.Veiras LC, Girardi AC, Curry J, Pei L, Ralph DL, Tran A, Castelo-Branco RC, Pastor-Soler N, Arranz CT, Yu AS, McDonough AA. Sexual dimorphic pattern of renal transporters and electrolyte homeostasis. J Am Soc Nephrol 28: 3504–3517, 2017. doi: 10.1681/ASN.2017030295. [DOI] [PMC free article] [PubMed] [Google Scholar]
- 43.Vora JP, Oyama TT, Thompson MM, Anderson S. Interactions of the kallikrein-kinin and renin-angiotensin systems in experimental diabetes. Diabetes 46: 107–112, 1997. doi: 10.2337/diab.46.1.107. [DOI] [PubMed] [Google Scholar]
- 44.Wagner MC, Campos-Bilderback SB, Chowdhury M, Flores B, Lai X, Myslinski J, Pandit S, Sandoval RM, Wean SE, Wei Y, Satlin LM, Wiggins RC, Witzmann FA, Molitoris BA. Proximal tubules have the capacity to regulate uptake of albumin. J Am Soc Nephrol 27: 482–494, 2016. doi: 10.1681/ASN.2014111107. [DOI] [PMC free article] [PubMed] [Google Scholar]
- 45.Wolf G, Ziyadeh FN. Molecular mechanisms of diabetic renal hypertrophy. Kidney Int 56: 393–405, 1999. doi: 10.1046/j.1523-1755.1999.00590.x. [DOI] [PubMed] [Google Scholar]
- 46.Ye M, Wysocki J, William J, Soler MJ, Cokic I, Batlle D. Glomerular localization and expression of Angiotensin-converting enzyme 2 and Angiotensin-converting enzyme: implications for albuminuria in diabetes. J Am Soc Nephrol 17: 3067–3075, 2006. doi: 10.1681/ASN.2006050423. [DOI] [PubMed] [Google Scholar]
- 47.Zhou L, Liu F, Huang XR, Liu F, Chen H, Chung AC, Shi J, Wei L, Lan HY, Fu P. Amelioration of albuminuria in ROCK1 knockout mice with streptozotocin-induced diabetic kidney disease. Am J Nephrol 34: 468–475, 2011. doi: 10.1159/000332040. [DOI] [PMC free article] [PubMed] [Google Scholar]
- 48.Zimpelmann J, Kumar D, Levine DZ, Wehbi G, Imig JD, Navar LG, Burns KD. Early diabetes mellitus stimulates proximal tubule renin mRNA expression in the rat. Kidney Int 58: 2320–2330, 2000. doi: 10.1046/j.1523-1755.2000.00416.x. [DOI] [PubMed] [Google Scholar]


