Abstract
Moderate anemia is associated with increased mortality and morbidity, including acute kidney injury (AKI), in surgical patients. A red blood cell (RBC)-specific antibody model was utilized to determine whether moderate subacute anemia could result in tissue hypoxia as a potential mechanism of injury. Cardiovascular and hypoxic cellular responses were measured in transgenic mice capable of expressing hypoxia-inducible factor-1α (HIF-1α)/luciferase activity in vivo. Antibody-mediated anemia was associated with mild intravascular hemolysis (6 h) and splenic RBC sequestration (day 4), resulting in a nadir hemoglobin concentration of 89 ± 13 g/l on day 4. At this time point, renal tissue oxygen tension (PtO2) was decreased in anemic mice relative to controls (13.1 ± 4.3 vs. 20.8 ± 3.7 mmHg, P < 0.001). Renal tissue hypoxia was associated with an increase in HIF/luciferase expression in vivo (P = 0.04) and a 20-fold relative increase in renal erythropoietin mRNA transcription (P < 0.001) but no increase in renal blood flow (P = 0.67). By contrast, brain PtO2 was maintained in anemic mice relative to controls (22.7 ± 5.2 vs. 23.4 ± 9.8 mmHg, P = 0.59) in part because of an increase in internal carotid artery blood flow (80%, P < 0.001) and preserved cerebrovascular reactivity. Despite these adaptive changes, an increase in brain HIF-dependent mRNA levels was observed (erythropoietin: P < 0.001; heme oxygenase-1: P = 0.01), providing evidence for subtle cerebral tissue hypoxia in anemic mice. These data demonstrate that moderate subacute anemia causes significant renal tissue hypoxia, whereas adaptive cerebrovascular responses limit the degree of cerebral tissue hypoxia. Further studies are required to assess whether hypoxia is a mechanism for acute kidney injury associated with anemia.
Keywords: acute kidney injury, anemia-induced tissue hypoxia, subacute anemia
INTRODUCTION
Anemia has been associated with an increased risk of acute kidney injury (AKI) (17, 18, 20, 27, 28), stroke (17, 20, 27), myocardial events (6, 11, 20, 28, 47), and mortality (1, 2, 10, 11, 17, 20, 27, 28, 36, 45, 47) in patients undergoing surgery. While the mechanism(s) has not been clearly defined, anemia-induced tissue hypoxia remains a potential candidate. This possibility is supported by clinical studies that demonstrate that the degree of organ injury is proportional to the severity of acute anemia in surgical patients (16, 20, 25). Furthermore, animal studies demonstrate that the magnitude of anemia-induced tissue hypoxia is also proportional to the severity of acute anemia (42, 43). These data suggest that a progressive reduction in blood oxygen (O2) content and limited tissue oxygen delivery (tissue hypoxia) may contribute to the underlying mechanism of anemia-induced organ injury.
Of interest is that the kidney appears to be more susceptible to anemia-induced injury relative to other organs, such as the brain, as the prevalence of AKI is greater than that of stroke in anemic patients undergoing surgery (20, 28). Surprisingly, even moderate levels of preoperative anemia [hemoglobin (Hb) concentrations between 80 and 100 g/l] have been associated with an increased risk of renal injury {odds ratio (OR): 1.38 [95% confidence interval (CI) 1.18–1.62], P < 0.05} (28).
A clearer understanding of the potential mechanisms by which this pattern of injury occurs may be gained by reviewing the well-characterized adaptive physiological responses to acute and chronic anemia (3, 29, 41, 42). The cardiovascular adaptations include an increase in cardiac output and a preferential redirection of blood flow to vital organs with high metabolic oxygen requirements, including the brain and heart (3, 32, 41–44). By contrast, no or limited increases in renal blood flow are observed during acute hemodilution (15, 42), leading to earlier and more severe renal tissue hypoxia (5, 38), and an increase in the magnitude of hypoxia signaling responses, including stabilization of the transcription factor hypoxia-inducible factor-α (HIF-α) (42, 43). This pattern of organ perfusion during anemia may explain why the kidney is more susceptible to tissue hypoxia and injury relative to the brain.
This background led us to assess the impact of moderate subacute anemia on oxygen delivery to the kidney and brain in an animal model. This model approximates the degree and time course of anemia in perioperative patients. We want to test the overarching hypothesis that moderate subacute anemia results in tissue hypoxia. We were also interested in determining whether the level of anemia-induced tissue hypoxia was different between the kidney and the brain. To test this hypothesis, we utilized a novel model of subacute anemia induced by a red blood cell (RBC)-specific antibody (TER119) (4, 48). As previously described, TER119 is a monoclonal antibody specific to the glycophorin-A complex on the surface of RBC. Intravenous administration of this antibody induces a moderate degree anemia over a span of days, resulting in a subacute anemia (4, 19). Real-time cellular adaptation to anemia was assessed with a transgenic mouse ubiquitously expressing a luciferase reporter gene fused to the oxygen degradation-dependent (ODD) region of HIF-1α (33). We also characterized the cardiovascular and HIF-dependent mRNA responses to anemia-induced tissue hypoxia in the kidney and brain.
MATERIALS AND METHODS
Animals.
Animal protocols were reviewed and approved by the Animal Care Committees at St. Michael’s Hospital and at The Centre for Phenogenomics and conducted in compliance with the Canadian Council on Animal Care and ARRIVE guidelines. HIF-ODD luciferase mice were purchased and bred in house [FVB.129S6-Gt(ROSA)26Sortm2(HIF1A/luc)Kael/J; The Jackson Laboratory, Bar Harbor, ME]. As previously described, this strain is of the FVB background and has firefly luciferase fused to the ODD region of HIF-1α (33). A total of 270 heterozygous male HIF-ODD mice (10 ± 2 wk) were utilized for all experiments (control: n = 124, anemia: n = 138, untreated: n = 8). In addition, a magnetic resonance anatomic assessment was performed in three wild-type mice. For all experiments, the mean weights were comparable between groups (control: 26.4 ± 2.4 g; anemia: 26.5 ± 2.4 g; untreated: 26.9 ± 1.5 g; P = 0.86). Animals had access to food and water ad libitum in a pathogen-free facility with a 12:12-h light-dark cycle. All experiments were conducted during the light cycle. As aligned with previous protocols, spontaneously breathing mice were anesthetized with 2% (vol/vol) isoflurane in 21% O2 at a flow rate of 2 l/min via nosecone for all experiments, except for experiments following the ultrasound biomicroscopy protocols that utilized 1.5% isoflurane. In addition, core body temperature was monitored by rectal probe and maintained by a heat pad between 36 and 37°C. Hb concentrations were measured by a Hemocue Hb201+ analyzer (Radiometer, Angelholm, Sweden) from 10-μl blood samples collected via tail nick.
Antibody-induced anemia.
RBC-specific antibody (TER119) or isotype control (Rat IgG2β) was administered to anesthetized mice via tail vein (1 μg/g body weight; BioXCell, West Lebanon, NH). Stock aliquots of TER119 or rat IgG2β were stored at −80°C and diluted with saline.
Degree of anemia induced by RBC-specific antibody.
Hb values were assessed over a 14-day period in mice injected with control antibody (n = 11), RBC-specific antibody (n = 16), and a subgroup of mice reinjected with a second dose of antibody at the day 4 time point (control: n = 6; anemia: n = 6).
Plasma hemoglobin, spleen, and liver weight.
Blood was collected from the abdominal aorta of control (n = 56) and anemic mice (n = 57) at different time points following antibody injection (1, 6, and 12 h and 1, 2, 3, 4, 7, and 14 days following injection; day 4 time point: control n = 8, anemia n = 9; all other time points: control n = 6, anemia n = 6). Blood was centrifuged at 1,400 g for 10 min at 4°C to separate and obtain plasma. Blood and plasma Hb was assessed by co-oximetry (ABL800Flex; Radiometer). Mouse spleen and liver were excised and weighed following blood extraction. Plasma Hb, spleen, and liver weights were measured in untreated mice (n = 8) to provide reference baseline values.
Peripheral arterial oxygen saturation.
Pulse oximetry was utilized to measure peripheral arterial oxygen saturation (SpO2) on the right thigh of anesthetized mice (control n = 6, anemia n = 6, MouseOx; Starr Life Sciences, Oakmont, PA;). SpO2 values were recorded every 4 s and averaged over a 10-min time period.
Ultrasound biomicroscopy.
A high-frequency ultrasound biomicroscope (Vevo 2100; VisualSonics, Toronto, ON, Canada) was utilized to assess blood flow through the aortic orifice, left common carotid artery, left internal carotid artery, and right renal artery. Mice were randomized in blocks of four to six (control: n = 6; anemia: n = 8) and analyzed in a blinded fashion at baseline and on day 4. Anesthesia was maintained with 1.5% (vol/vol) isoflurane, as previously established for these noninvasive experiments (42, 49). A 30-MHz transducer was utilized to obtain two-dimensional images, M-mode trace, and Doppler flow velocity spectrum of each respective vessel. Blood flow through the aortic orifice was calculated by measuring the diameter of the aortic annulus at peak systole in a two-dimensional image. For all other vessels, M-mode traces were recorded with a sampling line perpendicular to the longitudinal axis of each respective vessel, and all Doppler flow velocity recordings were measured at the smallest possible intercept angle to vessel flow (<60°).
Vessel cross-sectional area was calculated from diameter measurements obtained from two-dimensional M-mode images. The velocity-time-integral (VTI) was measured from the intensity-weighted mean velocity tracing of the Doppler spectrum. All measurements were averaged over three cardiac cycles. Stroke volume was calculated from the product of vessel area and VTI. Blood flow measurements were calculated from the product of stroke volume and Doppler-measured heart rate. Data were unblinded following acquisition and analysis.
Tissue oxygen tension.
An Oxyphor G4 probe was utilized to measure focal tissue Po2 (PtO2). As previously described, Oxyphor G4 contains a Pd-porphyrin core, which has been designed to emit phosphorescent light (813 nm) following excitation (637 nm). Molecular oxygen is capable of quenching emission of excited triplet state electrons. In biological media, quenching is highly specific to oxygen, as this is the only small quenching molecule present in sufficiently high concentrations. Therefore, the lifetime of phosphorescence is inversely proportional to the Po2 within its surroundings (8). For all tissue oxygen tension experiments, isoflurane administration was maintained at 2% (vol/vol) at a flow rate of 2 l/min, as anesthesia depth has been shown to significantly affect PtO2 values (8).
Brain PtO2 was measured in control (n = 12) and anemic (n = 13) mice. Brain tissue was exposed via a burr hole (1–2 mm in diameter) in the skull to facilitate implantation of a microsensor containing ∼5 μl of the Oxyphor G4 probe. Kidney PtO2 was measured in control (n = 10) and anemic (n = 14) mice. Kidney tissue was exposed via abdominal incision for microsensor implantation. Calibrated probes were placed to ensure that the Oxyphor capsule was located at a depth of 3 mm within the tissue. This would place the brain and kidney probes within the midbrain region and the renal medullary region, respectively. After probe stabilization, organ PtO2 values were recorded with a PMOD 1000 frequency domain phosphorometer (Oxygen Enterprises, Philadelphia, PA) every 10 s and averaged over a 10-min period.
In vivo HIF/luciferase assessment.
HIF/luciferase bioluminescence was measured in control (n = 11) and anemic (n = 12) mice at baseline and on day 3 and day 4. d-Luciferin was administered to mice (50 μg/g ip; Promega, Madison, WI) 10 min before measurement in an IVIS Lumina II imaging system (Perkin-Elmer, Waltham, MA). Dorsal and ventral bioluminescence images were measured over 10-s exposure times. Four hours after final imaging, mice were euthanized and their organs harvested and immediately snap-frozen in liquid nitrogen for molecular analysis.
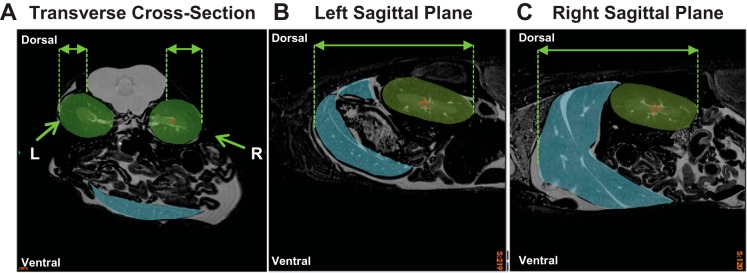
Bioluminescence data was collected in a blinded and randomized fashion. Total HIF/luciferase radiance flux was measured over regions of interest (ROIs) on dorsal and ventral images. Qualitative analysis of HIF-ODD mice has consistently demonstrated increased HIF/luciferase radiance produced from the dorsal right region compared with the dorsal left region (33, 41, 42). To determine the anatomic explanation for these differences, ex vivo whole body magnetic resonance images of wild-type mice were assessed (n = 3; Fig. 1). Images were acquired using a 7.0 T, 40-cm-diameter bore magnet (Varian, Palo Alto, CA) and a 3D spin echo sequence (repetition time = 650 ms, echo time = 24 ms, no. of averages = 3, field of view = 12 × 3.7 × 3.7 cm, matrix size = 960 × 296 × 296, giving an image with 125-μm isotropic resolution). Observational analysis was conducted by comparing anatomic planes over the right and left kidneys. Assessment of the transverse cross-section plane demonstrated the right kidney as being placed more superficially and less shielded by paraspinal structures compared with the left kidney (Fig. 1A). A greater degree of left kidney shielding by paraspinal structures suggests an attenuation of HIF/luciferase radiance produced by the left side. Assessment of the left and right sagittal planes demonstrated an increased surface area of superficially localized liver tissue on the right side compared with the left (Fig. 1, B and C). Liver HIF-1α protein and HIF/luciferase radiance in vitro has been demonstrated to profoundly increase as anemia becomes more severe (42), which may contribute to the greater HIF/luciferase signal observed on the right dorsal side. Therefore, the combination of increased right renal exposure, liver-induced amplification of right dorsal HIF-luciferase radiance, and attenuation of the left side by paraspinal muscles may contribute to the increased HIF-luciferase radiance observed over the right dorsal region relative to the left dorsal region. These results were utilized to define the ROIs for HIF/luciferase bioluminescence assessment.
Fig. 1.
Anatomic magnetic resonance assessment of the left (L) and right (R) dorsal regions (representative images from n = 3 mice; field of view = 3.7 × 3.7 cm; isotropic resolution: 125 μm). A: comparison of L and R kidney (green regions) obstruction by paraspinal muscles (gray region) in the transverse cross-section. B and C: comparison of liver tissue (blue region) in the left sagittal plane vs. the right sagittal plane.
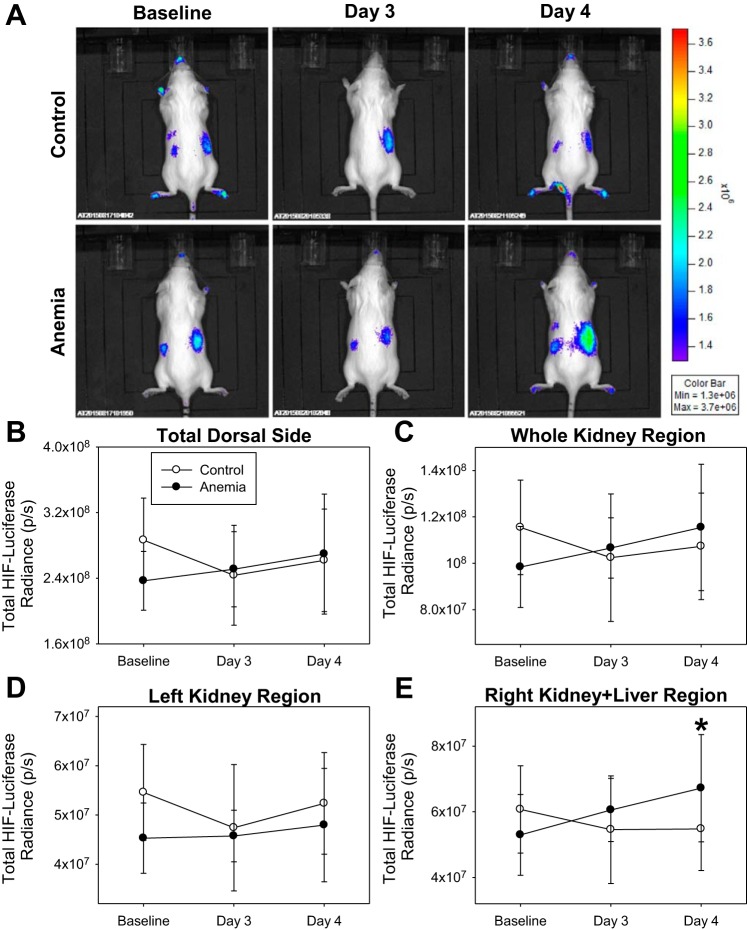
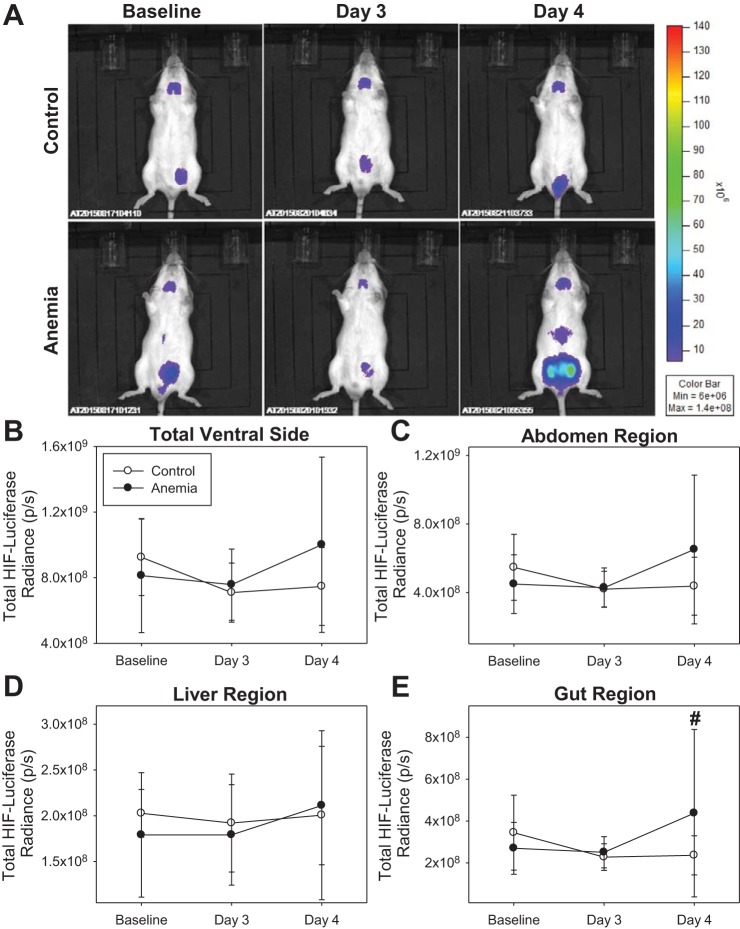
Dorsal ROIs assessed were total dorsal side, whole kidney region (area between forelimb and hindlimb), left kidney region (left half of “kidney region” ROI), and right kidney + liver region (right half of kidney region ROI). Ventral ROIs assessed were total ventral side, abdomen region (area between the diaphragm and mid-knee), liver region (anterior half of “abdominal region” ROI), and gut region (posterior half of abdominal region ROI). Images were analyzed with Living Image software (Perkin Elmer). Data were unblinded following analysis.
RNA isolation protocol.
Erythropoietin (EPO) gene expression levels were assessed in kidney, brain, liver, and heart tissue (control n = 5, anemia n = 6). Heme oxygenase (HO-1) and glyceraldehyde 3-phosphate dehydrogenase (GAPDH) gene expression were measured only in brain tissue. Tissue samples used to extract RNA were immediately frozen in liquid nitrogen and stored at −80°C until analysis. Approximately 50 mg of tissue was placed in a 2-ml tube containing 1.4-mm ceramic spheres and 1 ml of TRIzol (cat. no. 15596026; Invitrogen, Life Technologies, Burlington, ON, Canada) and homogenized using The Fast Prep-24 system. After centrifugation, samples were transferred into new 1.5-ml tubes with 200 μl of chloroform and centrifuged at high speed for 15 min. The clear supernatant, containing the RNA fraction, was subsequently transferred to a new 1.5-ml tube with 500 μl of isopropanol. Samples were then purified using a Qiagen RNeasy Kit (Qiagen, Hilden, Nordrhein-Westfalen, Germany). DNase treatment was performed on-column with RNase free DNase set (Qiagen). RNA integrity was confirmed using the Agilent 2100 Bioanalyzer (Agilent Technologies, Mississauga, ON, Canada).
Concentrations of isolated RNA were quantified using a spectrophotometer (NanoDrop, ND1000; Thermo Scientific, Mississauga, ON, Canada) before cDNA synthesis. Protein contamination was assessed by measuring absorbance at 280 nm. Generation of cDNA was completed using High Capacity cDNA Reverse Transcription Kit (Applied Biosystems by Thermo Fisher Scientific, Baltic) according to the manufacturer’s instructions using 1,000 ng of RNA per sample. Reverse transcription-PCR reactions were performed in a T100 thermal cycler (Bio-Rad).
Real-time PCR.
Quantitative real-time PCR (qPCR) for detection of EPO, HO-1, and GAPDH expression was performed separately, utilizing the AB 7500 Real-Time PCR System. The following protocol was followed: one stage at 50°C for 2 min, two stages at 95°C for 5 min, and then 40 cycles of 95°C for 15 s, 58 (EPO) or 60°C (HO-1, GAPDH), for 1 min, followed by a dissociation curve to assess specificity of the reaction. Samples were run in duplicate 25-µl reactions utilizing Platinum SYBR Green qPCR SuperMix-UDG (Invitrogen). Primer set-specific efficiencies were determined using real-time PCR (AB 7500 Real-Time PCR System and CFX Connect Real-Time PCR Detection System accordingly) with an appropriate cDNA dilution series before sample analysis.
β-Actin was chosen as a reference gene for mRNA analysis. Relative changes between control and anemic samples were then calculated as , with ΔCT indicating normalized values.
Cerebrovascular reactivity.
Cerebrovascular reactivity was assessed in control (n = 6) and anemic (n = 6) mice at baseline and on day 4. Mice were randomized in blocks of four before blinded data acquisition. Following endotracheal intubation, mice were placed on a small animal ventilator (135 cycles/min; Kent Scientific, Torrington, CT). Common carotid and internal carotid artery blood flow parameters were assessed following the ultrasound biomicroscopy methodology.
As previously described, majority of the blood flow through the common carotid artery has been shown to pass through the internal carotid artery directly supplying the brain microvasculature, making it a good surrogate measure for intracerebral reactivity (26). Under 1.5% isoflurane inhalation, mice were subjected to a cycling of room air (normocapnia: 21% O2, 79% N2) and a carbon dioxide challenge (hypercapnia: 5% CO2, 30% O2, 65% N2). Mice underwent two carbon dioxide challenges during each time point. A period of 5 min between measurements was allotted for mice to return to baseline following each carbon dioxide challenge. Data were unblinded following acquisition and analysis.
Statistical analysis.
For each major outcome, sample size calculations were made a priori assuming a power of 0.8, with an α of 0.05 from previous experimental data (3, 41, 42). Based on these, the following minimum sample sizes were calculated for each respective experiment: “ultrasound biomicroscopy,” n = 4; “tissue oxygen tension,” n = 6; “in vivo HIF/luciferase assessment,” n = 8; “mRNA transcription of downstream targets of HIF-1α,” n = 4; and “cerebrovascular reactivity,” n = 5. Actual sample sizes were increased to improve the power of the statistical analysis.
All data were analyzed by a statistician independent from the experimental process. Statistical analysis was conducted using statistical analysis system (SAS) software (Cary, NC). Inspection of the histograms of the outcomes did not reveal any severe departure from normality. A Student’s t-test used to assess comparisons of two groups. A two-way analysis of variance (ANOVA), with repeated measures when applicable, was used to assess Hb concentrations, spleen and liver weights, SpO2, vessel-specific blood flow, HIF/luciferase radiance, and cerebrovascular reactivity. For two-way ANOVA tests, a false discovery rate approach was utilized to adjust P values for multiple comparisons when appropriate. For Hb concentration, we planned a priori to compare all groups within each respective time points, resulting in 23 comparisons. For SpO2, vessel blood flow, HIF/luciferase radiance, and cerebrovascular reactivity analysis, we planned a priori to make four comparisons for each analysis: 1) control versus anemia at the baseline time point; 2) control versus anemia at the day 4 time point; 3) baseline versus day 4 in the control group; and 4) baseline versus day 4 in the anemia group. All data are presented as means ± SD. Unadjusted and adjusted P values are presented. An adjusted value of P < 0.05 (2-tailed) was taken to be statistically significant.
RESULTS
RBC-specific antibody induced moderate anemia.
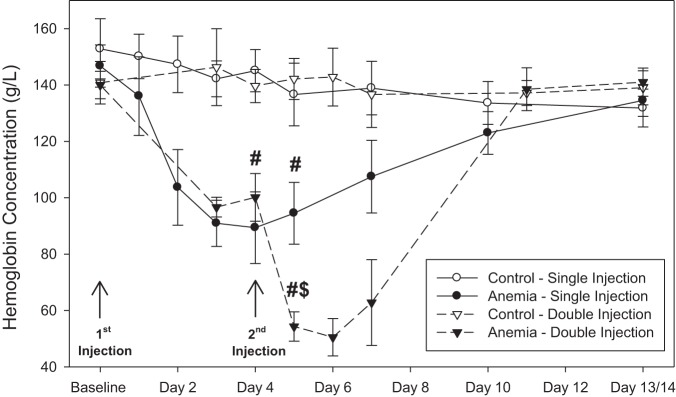
A single injection of RBC-specific antibody induced moderate anemia with a nadir Hb concentration of 89 ± 13 g/l on day 4 (n = 16) compared with a baseline value of 147 ± 7 g/l and a control value of 143 ± 7 g/l (n = 17; unadjusted P < 0.001, adjusted P < 0.001; Fig. 2). Double-injected mice developed severe anemia, with Hb concentrations being reduced to 54 ± 5 g/l on day 5 (n = 6) compared with single-injected mice with a value of 95 ± 11 g/l (unadjusted P < 0.001, adjusted P < 0.001) and a control value of 139 ± 10 g/l (unadjusted P < 0.001, adjusted P < 0.001). Hb values for mice receiving a single injection and double injection returned to control values by 14 days following injection.
Fig. 2.
A single injection of red blood cell (RBC)-specific antibody induced moderate anemia, with a nadir hemoglobin concentration of 89 ± 13 g/l observed on day 4 (n = 16; control n = 11; adjusted for 23 comparisons). A second injection of RBC-specific antibody induced severe anemia, reducing hemoglobin concentrations to 54 ± 5 g/l on day 5 (n = 6; control n = 6; adjusted for 23 comparisons). Hemoglobin values between control and anemic mice were not significantly different at 14 days following baseline injection. All data were analyzed by 2-way repeated-measures ANOVA. #P < 0.001 vs. control; $P < 0.001 vs. anemia/single injection.
Intravascular hemolysis and splenic sequestration as mechanisms for RBC clearance.
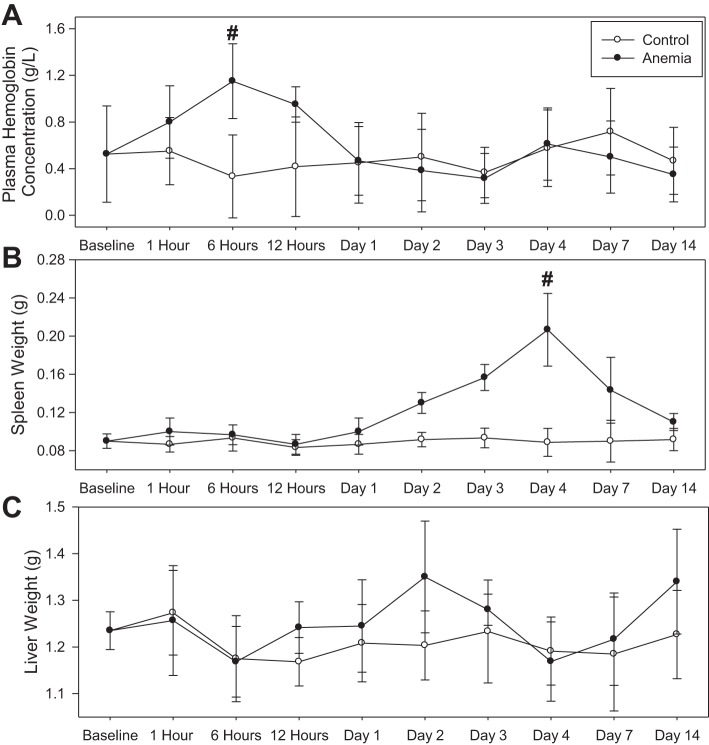
Plasma Hb levels rose to a peak value of 1.2 ± 0.3 g/l at 6-h following RBC-specific antibody injection (n = 6), which was higher than a control value of 0.3 ± 0.3 g/l (Fig. 3A; n = 6, unadjusted P = 0.002). No gross hematuria was observed in any mice. By day 1 following injection, plasma Hb concentrations in the anemia group were reduced to 0.5 ± 0.3 g/l, which was not significantly different from the control value of 0.5 ± 0.3 g/l (n = 6, unadjusted P = 0.93; Fig. 3A). Spleen weight increased to a maximum of 0.21 ± 0.04 g by day 4 after RBC-specific antibody injection (n = 9), more than twofold higher than a control value of 0.09 ± 0.01 g (n = 8, unadjusted P < 0.001; Fig. 3B). No difference in liver weight was observed between anemic and control mice (Fig. 3C).
Fig. 3.
Effect of an intravenous injection of control antibody and red blood cell (RBC)-specific antibody (anemia) on plasma hemoglobin concentration, spleen weight, and liver weight (control: n = 56; anemia: n = 57; day 4 time point: control n = 8, anemia n = 9; all other time points: control n = 6, anemia n = 6). A: plasma hemoglobin concentration in control and anemic mice. A peak plasma hemoglobin value was observed at 6 h in the anemia group (n = 6; control: n = 6; #P = 0.002 vs. control). B: spleen weight in control and anemic mice. A peak spleen weight value was observed on day 4 in the anemia group (n = 9; control: n = 8; #P < 0.001 vs. control). C: liver weight in control and anemic mice. All data were analyzed by 2-way ANOVA.
Increased peripheral arterial oxygen saturation during anemia.
SpO2 values increased in anemic mice (n = 6) from a baseline value of 97.1 ± 0.6% to a day 3 value of 98.1 ± 0.2 and a day 4 value of 97.8 ± 0.4% (n = 6, unadjusted P = 0.02, adjusted P < 0.05; Fig. 4). Day 4 SpO2 values were higher than a control value of 97.0 ± 0.8% (n = 6; unadjusted P = 0.01, adjusted P < 0.05).
Fig. 4.
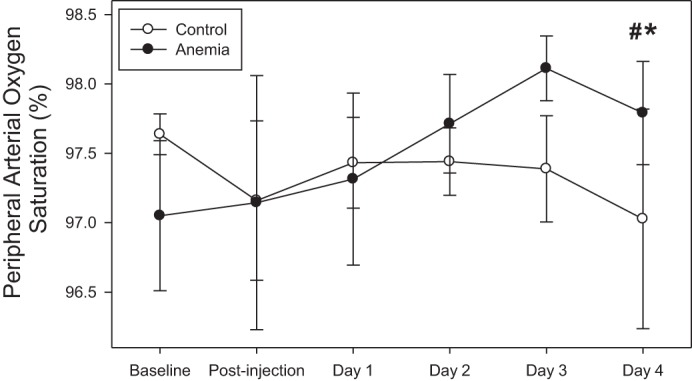
Peripheral arterial oxygen saturation increased in anemic mice from baseline values (n = 6; *P < 0.05, adjusted for 4 comparisons) and was higher than control values (n = 6; #P < 0.05, adjusted for 4 comparisons). All data were analyzed by a 2-way repeated-measures ANOVA.
Heterogeneous organ-specific blood flow during anemia.
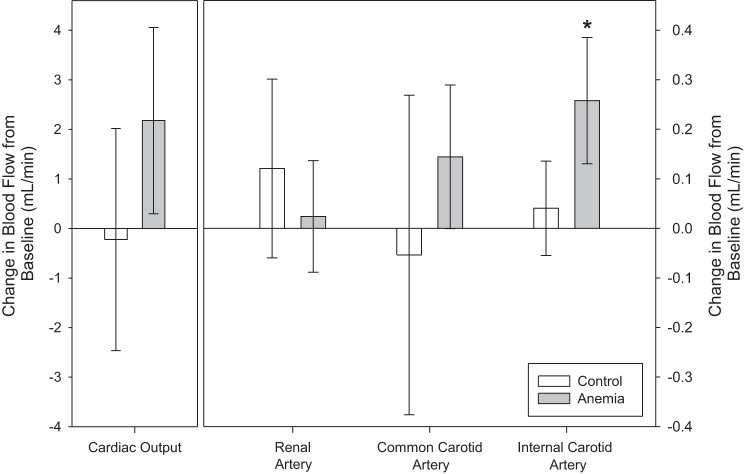
Cardiac output, renal artery, and common carotid artery flow did not change during anemia. Internal carotid artery flow increased from a baseline value of 0.3 ± 0.1 ml/min to 0.6 ± 0.1 ml/min during anemia (unadjusted P < 0.001, adjusted P < 0.001; Fig. 5). For all control mice, blood flow for all vessels did not differ from anemic mice at baseline and did not change on day 4.
Fig. 5.
Internal carotid artery flow increased from baseline in anemic mice (n = 8; control: n = 6; *P < 0.001 vs. baseline, adjusted for 4 comparisons). Conversely, no significant increase in cardiac output, renal artery, or common carotid artery flow was observed. All data were analyzed by a 2-way repeated-measures ANOVA.
Moderate anemia induced renal-specific tissue hypoxia.
During anemia, kidney PtO2 was reduced to a value of 13.1 ± 4.3 mmHg (n = 10) compared with a control value of 20.8 ± 3.7 mmHg (n = 14; P < 0.001; Fig. 6). Brain PtO2 of anemic mice was 22.7 ± 5.2 mmHg (n = 13), which was not significantly different from a control value of 23.4 ± 9.8 mmHg (n = 14, P = 0.59).
Fig. 6.
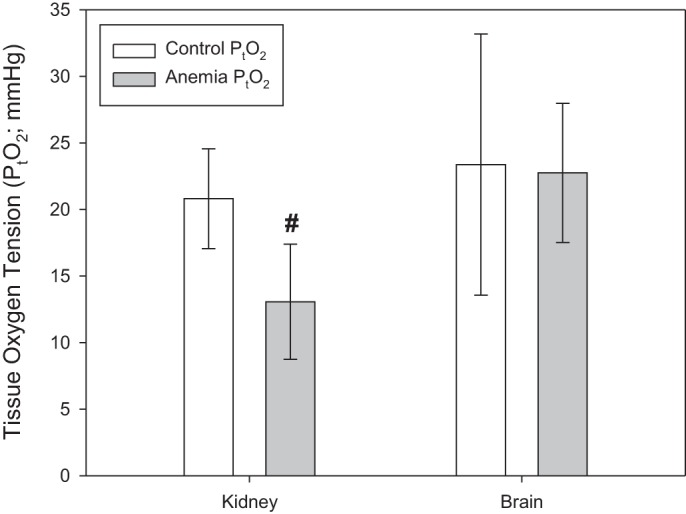
Renal tissue oxygen tension (PtO2) decreased in anemic mice (n = 14) relative to controls (n = 10; #P < 0.001 vs. control). Brain PtO2 did not change during anemia (n = 14) relative to control (n = 12). All data were analyzed by t-tests.
Increased dorsal HIF/luciferase radiance from kidney and liver region.
In control mice (n = 11), HIF/luciferase radiance did not change in any dorsal ROI assessed (Fig. 7). In anemic mice (n = 12), “total dorsal side,” “whole kidney region,” and “left kidney region” HIF/luciferase radiance did not change (Fig. 7, B–D). “Right kidney + liver region” HIF/luciferase radiance increased from a baseline value of 5.30 × 10⁷ ± 1.23 × 10⁷ p/s to a day 4 value of 6.72 × 10⁷ ± 1.63 × 10⁷ p/s (unadjusted P = 0.01, adjusted P = 0.04; Fig. 7E). In addition, a change in day 4 “right kidney + liver region” HIF/luciferase radiance values from baseline in anemic mice was 1.42 × 10⁷ ± 1.37 × 10⁷ p/s, which was higher than a control value of −0.59 × 10⁷ ± 1.31 × 10⁷ p/s (P = 0.002).
Fig. 7.
A: characteristic dorsal hypoxia-inducible factor (HIF)/luciferase bioluminescence images of control (n = 11) and anemic (n = 12) mice. B–D: HIF/luciferase bioluminescence in the “total dorsal side,” “whole kidney region,” and “left kidney region” did not change in control or anemic mice. E: “right kidney + liver region” HIF/luciferase radiance values on day 4 were higher than baseline values (*P = 0.04 vs. baseline, adjusted for 4 comparisons). All data were analyzed by 2-way repeated-measures ANOVA.
Increased ventral HIF/luciferase radiance from gut region.
In control mice (n = 11), HIF/luciferase radiance did not change in any ventral ROI assessed (Fig. 8). In anemic mice (n = 12), “total ventral side,” “abdomen region,” and “liver region” HIF/luciferase radiance did not change (Fig. 8, B–D). “Gut region” HIF/luciferase radiance at the day 4 time point was 4.38 × 10⁸ ± 4.00 × 10⁸ p/s, which was higher than a control value of 2.36 × 10⁸ ± 0.93 × 10⁸ p/s (unadjusted P < 0.001, adjusted P < 0.001; Fig. 8E). In addition, change in day 4 gut region HIF/luciferase radiance values from baseline in anemic mice was 1.68 × 10⁸ ± 3.48 × 10⁸ p/s, which was higher than a control value of −1.08 × 10⁸ ± 1.28 × 10⁸ p/s (P = 0.02).
Fig. 8.
A: characteristic ventral hypoxia-inducible factor (HIF)/luciferase bioluminescence images of control (n = 11) and anemic (n = 12) mice. B–D: “total ventral side,” “abdomen region,” and “liver region” HIF/luciferase bioluminescence did not change in control or anemic mice. E: “gut region” HIF/luciferase radiance values on day 4 were higher than control values (#P < 0.001 vs. control, adjusted for 4 comparisons). All data were analyzed by 2-way repeated-measures ANOVA.
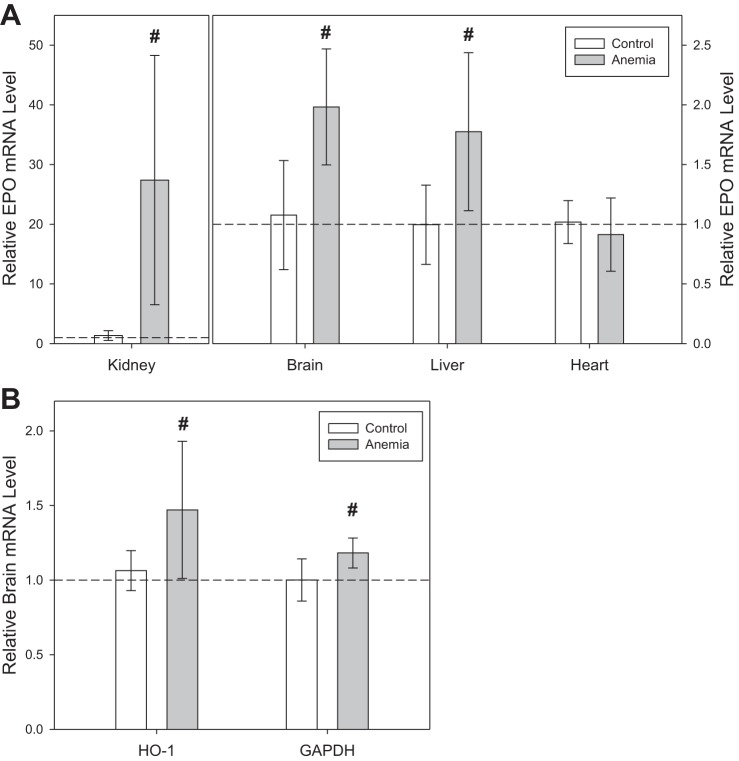
Organ-specific increase in mRNA transcription.
During anemia (n = 6), kidney EPO mRNA transcription increased 20-fold relative to control mice (n = 5, P < 0.001; Fig. 9A). Brain and liver EPO mRNA transcription increased twofold relative to control mice (brain: P < 0.001; liver: P = 0.003). Heart EPO mRNA transcription was not significantly different in anemic mice relative to control mice (P = 0.35). Brain HO-1 mRNA levels increased by 38% in anemic mice relative to control mice (P = 0.01), and GAPDH mRNA levels increased by 18% in anemic mice relative to control mice (P = 0.002; Fig. 9B).
Fig. 9.
A: kidney, brain, and liver erythropoietin (EPO) mRNA levels were greater in anemic mice (n = 6) compared with control values (n = 5; #P ≤ 0.003 vs. control). Heart EPO mRNA levels did not change in anemic mice. B: brain heme oxygenase (HO-1) and glyceraldehyde 3-phosphate dehydrogenase (GAPDH) mRNA levels were greater in anemic mice compared with control values (#P ≤ 0.01 vs. control). All data were analyzed by t-tests.
Carotid cerebrovascular reactivity is maintained during anemia.
During anemia (n = 6), common carotid artery and internal carotid artery reactivity to CO2 were not significantly different from control values (n = 6; unadjusted P ≥ 0.14, adjusted P ≥ 0.18; Fig. 10).
Fig. 10.
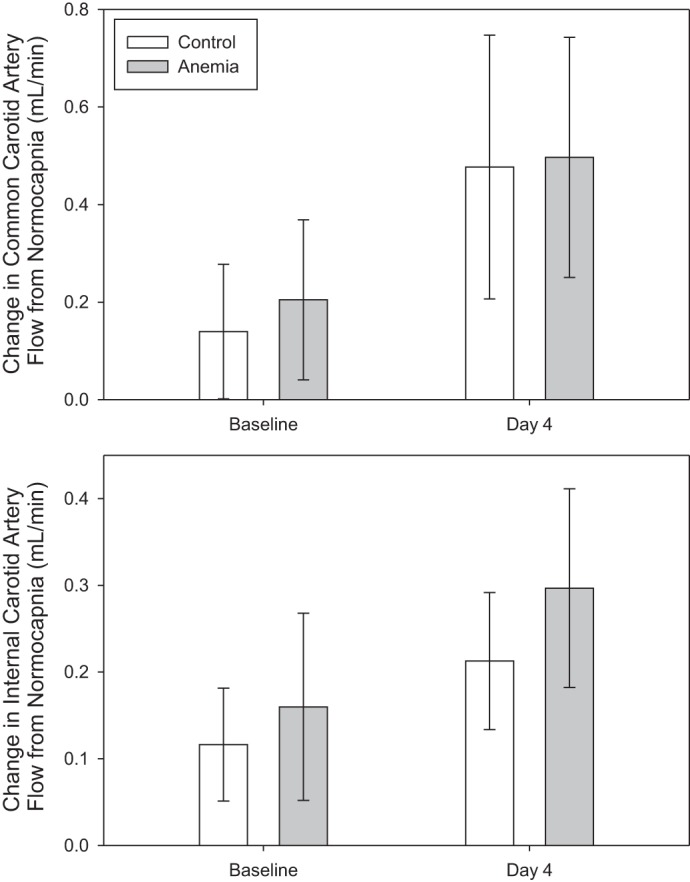
Changes in common carotid artery and internal carotid artery reactivity to CO2 were comparable between anemic (n = 6) and control (n = 6) mice. All data were analyzed by 2-way repeated-measures ANOVA.
DISCUSSION
Moderate subacute anemia causes renal tissue hypoxia.
We assessed the cardiovascular and hypoxic cellular responses to moderate subacute anemia of an intermediate duration, with a focus on the kidney and brain. Our experimental data provided clear evidence that moderate subacute anemia resulted in a profound level of renal tissue hypoxia, as characterized by a reduction in kidney PtO2, an increase in regional HIF/luciferase radiance in vivo, and a substantial increase in EPO mRNA level at a Hb concentration consistent with moderate anemia (∼90 g/l). These data compliment previous experimental studies that assessed the impact of acute anemia on renal tissue hypoxia (15, 32, 42, 43). These studies demonstrate similar hypoxic responses in the kidney. Of interest is that the Hb threshold associated with a reduction in Po2 (43), an increase in renal HIF-α expression, and an increase in HIF-dependent mRNA levels (42) occurred at an Hb concentration near 90 g/l. Thus, our current data are consistent with previous experimental studies in acute anemia and demonstrate the novel finding that renal tissue hypoxia occurred during moderate subacute anemia (Hb ∼90g/l) at an intermediate time point of 4 days.
In the current study, we did not observe any increase in renal blood flow during moderate anemia (Hb ∼90 g/l) utilizing ultrasound biomicrosocpy. This is consistent with our previous findings assessing graded hemodilutional anemia (42). No increase in renal blood flow was observed at Hb values near 90 or 70 g/l. However, at a lower Hb value near 50 g/l, we measured a 40% increase in renal blood flow. Thus, we did not observe any increase in renal blood flow at Hb values near 90 g/l in two different models of anemia. Johannes et al. (15) reported a 30% increase in renal blood flow during hemodilution to Hct values near 23 and 13%. The absent or relatively small increase in renal blood flow likely contributed to the occurrence of renal tissue hypoxia in both models.
The renal blood flow response to anemia is proportionally much smaller than the increase observed in cerebral blood flow (∼50–100%). This relative difference in organ blood flow likely explains why the kidney becomes profoundly hypoxic, whereas brain oxygenation is largely preserved during anemia (12, 32, 42). Thus, a small or undetectable increase in renal blood flow during both acute and subacute anemia likely contributed to inadequate renal oxygen delivery and the associated renal tissue hypoxia. The role of renal hypoxia remains to be elucidated in terms of its potential importance as a physiological signaling mechanism and/or potential mechanism of organ injury.
Anemia-induced renal hypoxia as a potential mechanism for acute kidney injury.
As of yet, a causal relationship between anemia, renal tissue hypoxia, and AKI has not yet been clearly established. However, a number of completed clinical and experimental studies have provided evidence that support this possible mechanism. In perioperative medicine, there is a clear association between preoperative anemia and AKI in noncardiac and cardiac surgery (17, 18, 20, 28). Furthermore, there is evidence that acute hemodilutional anemia during cardiopulmonary bypass is associated with renal dysfunction and dialysis dependence (7, 16, 25, 39). Unfortunately, renal PtO2 was not measured in these clinical studies, preventing the conclusion that tissue hypoxia was responsible for the observed renal dysfunction. However, as reviewed above, several experimental studies and our new data have demonstrated that both acute and subacute anemia are associated with renal tissue hypoxia (5, 38, 41, 43). Specifically, acute hemodilution on cardiopulmonary bypass has been shown to cause renal tissue hypoxia in both rat and pig models (5, 38). Of interest, the renal medulla may be more susceptible to anemia-induced tissue hypoxia, as indicated by more profound reductions in Po2 and increases in HIF-luciferase response as compared with the renal cortex (5). This may be due to the medulla’s relatively high metabolic requirements and attenuated blood supply (5, 38).
Further evidence linking renal hypoxia and AKI has been reviewed recently (31). For example, renal tissue hypoxia has been measured following experimental models of contrast-induced nephropathy (24), sepsis-induced kidney injury (46), and ischemia-reperfusion injury (30). Additional experimental data provide a potential link between renal medullary tissue hypoxia and urinary Po2, suggesting that urinary Po2 may be an early real-time biomarker for tissue hypoxia (21). Preliminary clinical data demonstrate evidence of a direct link between reduced urinary Po2 and AKI in both adult (9) and pediatric patients (40) undergoing cardiac surgery. These studies raise the possibility that anemia-induced renal hypoxia may cause kidney injury. However, further clinical studies will be required to establish a causal link between anemia, renal tissue hypoxia, and AKI.
Cardiovascular adaptation to anemia is crucial to maintain brain PtO2.
Assessment of cerebral perfusion in the current experimental model of subacute anemia demonstrates preservation of cerebrovascular reactivity to CO2 and a specific (∼80%) increase in internal carotid blood flow, which is characteristic of preferential redistribution of blood flow to the brain, as also observed in acute anemia (42, 43). This likely contributed to the maintenance of cerebral PtO2 levels in the current study due to preferential oxygen delivery to the brain. This is thought to be achieved by active mechanisms that promote cerebrovascular dilation (13, 14, 32). The preferential adaptive increase in cerebral blood flow has also been demonstrated in other models of anemia, including acute hemodilution and chronic sickle cell anemia (3, 41). Despite the preserved tissue Po2 level during subacute anemia, we demonstrated an increase in HIF-dependent mRNA levels of EPO, HO-1, and GAPDH. This finding is consistent with other experimental studies that have also demonstrated increases in HIF-dependent mRNA expression in the absence of a clear reduction in brain PtO2 (12, 23). These data suggest that the adaptive cardiovascular responses did not completely match cerebral oxygen demand and that mild degrees of cerebral tissue hypoxia occurred. This also suggests that the biological sensitivity of cerebral cells to mild tissue hypoxia is greater than the sensitivity of our Po2 detection methodologies. Clinical evidence that the adaptive cerebrovascular responses are protective is provided by the observation that cerebral injury is much less prevalent than renal injury in anemic patients undergoing surgery (17, 20, 28).
Evidence of hierarchical tissue hypoxia during subacute anemia.
In our model, we observed evidence of increased regional splanchnic HIF/luciferase activity in vivo and increased hepatic EPO mRNA levels. Consistent with this finding, other experimental studies of hemodiluitonal anemia have demonstrated reduced splanchnic Po2 (43). In addition, no increase in EPO mRNA level was detected in the heart. By looking at the relative EPO mRNA level increases, we observed a hierarchical response to hypoxia by which the kidney demonstrates the largest response, with an intermediate or lower response in the liver and brain and no indication of a response in cardiac tissue. Differential responses in organ blood flow and hypoxic mRNA levels were also observed in models of acute hemodilutional anemia (42, 43). The potential physiological significance of these relative differences in organ-specific hypoxic cellular responses to anemia requires a more complete assessment.
Mechanism of RBC-induced anemia.
Characterization of this model of subacute anemia suggests that the reduction in Hb was secondary to a degree of early acute intravascular hemolysis and subsequent splenic sequestration of RBCs. This was demonstrated by a slight increase in plasma Hb concentrations at 6 h, followed by a marked increase in spleen weight on day 4. The temporal relationship of increased spleen weight and decreased Hb concentration supports the finding of previous studies that the spleen is a major site of RBC sequestration (4). It was important to demonstrate that this model did not cause systemic hypoxemia, as indicated by a physiological increase in SpO2 at the nadir Hb at 4 days. Previous studies characterizing the effect of TER119 and other anti-RBC antibodies on RBC hemolysis have demonstrated evidence of gross hematuria utilizing higher doses of anti-RBC antibodies (4, 34). We chose the lower dose of antibody to minimize the degree of hemolysis in our study. We observed a mild degree of plasma Hb (1.2 g/l) at 6 h following antibody injection. Although no gross hematuria was observed, the possibility that acute hemolysis led to some degree of renal injury could not be ruled out in this study. Furthermore, this degree of hemolysis at 6 h may have contributed to renal tissue hypoxia observed at 4 days. However, the concurrence of the nadir Hb and maximal degree of renal tissue hypoxia at 4 days support the mechanism of inadequate oxygen delivery by RBCs at a Hb value near 90 g/l without an increase in renal blood flow. This model of moderate subacute anemia of an intermediate duration may enable us to further assess the mechanisms of anemia-induced organ injury and mortality.
Limitations.
There are limitations to our study. We only studied one level of anemia over time. Although previous studies have demonstrated a clear relationship between the level of anemia and degree of hypoxic signaling (42), we did not undertake such a comparison in this study. A single injection of RBC-specific antibody did not result in gross hematuria or mortality. Although we were able to demonstrate that a second dose of antibody resulted in severe anemia, these animals were not studied further, as the goal of the experimental study was to assess the impact of moderate anemia on tissue hypoxia. Pilot studies demonstrated that lower antibody doses did not induce anemia and that higher antibody doses were associated with mortality (n = 3). We did not provide any evidence of organ dysfunction or injury in this model, and therefore, we did not conclusively demonstrate that tissue hypoxia could lead to organ injury. We note that the early small rise in free Hb observed following RBC-specific antibody administration might influence renal function in this model. Measurements of kidney weight and markers of renal function would be of value to further characterize this model of anemia. We did not study tissue-specific luciferase activity in vitro. As a result, we could not report on HIF/luciferase levels within brain tissue, as brain HIF/luciferase radiance is shielded by the skull in vivo. Therefore, we have shown HIF/luciferase activity in evidence of tissue hypoxia and hypoxia-related gene expression in anemia (EPO, HO1, and GAPDH), but we were unable to definitively establish tissue hypoxia ex vivo. Assessment of HIF/luciferase is a well-established technique to confirm tissue hypoxia; however, it is dependent upon biodistribution and excretion rates of luciferin (22), and hypoxia-independent mechanisms of hydroxylase activity have been reported, including tricarboxylic acid intermediates and iron chelators (37). It will be important for future studies to evaluate the tissue, cell, and molecular mechanisms due to anemia in greater detail. Finally, only male mice were included in this study due to the variability in baseline hemoglobin concentrations between male and female FVB mice (35). This may limit the overall generalizability of reported outcomes.
Perspectives and Significance
The current study demonstrated that the kidney is more susceptible to hypoxia than the brain during moderate subacute anemia. Our data provided clear evidence of renal tissue hypoxia, which was in part due to a lack of increase in renal blood flow. Anemia-induced renal hypoxia was manifested by a reduction in kidney PtO2 and a profound increase in hypoxic cellular response. Evidence of cerebral tissue hypoxia was less clear and likely due to elevated cerebral blood flow and preserved cerebrovascular reactivity. Despite no significant change in brain PtO2, an increase in HIF-dependent mRNA transcription suggests subtle degrees of tissue hypoxia. These experimental data may help us define the role of tissue hypoxia as a mechanism of organ injury in anemia.
GRANTS
Support for this study was provided by the Academic Health Science Centre Alternative Funding Plan (SMH-17-014; to G. M. T. Hare), a Department of Anesthesia, University of Toronto, Merit Award (to C. D. Mazer and G. M. T. Hare), a Department of Anesthesia, University of Toronto, Conn Graduate Award (to N. Mistry), the Children’s Discovery Institute (A. Doctor, G. M. T. Hare), and the National Institute of General Medical Sciences (R01-GM-113838; to A. Doctor).
DISCLOSURES
No conflicts of interest, financial or otherwise, are declared by the authors.
AUTHOR CONTRIBUTIONS
N.M., C.D.M., J.G.S., A.H.L., A.D., and G.M.H. conceived and designed research; N.M., L.S.C., M.S., Y.-Q.Z., N.R., A.G.H., and K.R.B. performed experiments; N.M., C.D.M., J.G.S., A.H.L., L.S.C., M.S., Y.-Q.Z., N.R., A.G.H., K.R.B., J.A.S., and G.M.H. analyzed data; N.M., C.D.M., J.G.S., A.H.L., L.S.C., M.S., Y.-Q.Z., A.G.H., A.D., J.A.F., K.R.B., J.A.S., and G.M.H. interpreted results of experiments; N.M., C.D.M., J.G.S., L.S.C., M.S., A.G.H., and G.M.H. prepared figures; N.M., C.D.M., L.S.C., Y.-Q.Z., J.A.S., and G.M.H. drafted manuscript; N.M., C.D.M., J.G.S., A.H.L., L.S.C., M.S., Y.-Q.Z., N.R., A.G.H., A.D., J.A.F., K.R.B., J.A.S., and G.M.H. edited and revised manuscript; N.M., C.D.M., J.G.S., A.H.L., L.S.C., M.S., Y.-Q.Z., N.R., A.G.H., A.D., J.A.F., K.R.B., J.A.S., and G.M.H. approved final version of manuscript.
ACKNOWLEDGMENTS
We express appreciation to Dr. Rahim Moineddin, who assisted with the statistical analysis. Preliminary data from this article was presented by N. Mistry at the 2017 Canadian Anesthesiologists’ Society annual meeting. The oral presentation received the Richard Knill Award for best scientific paper at the meeting.
REFERENCES
- 1.Baron DM, Hochrieser H, Posch M, Metnitz B, Rhodes A, Moreno RP, Pearse RM, Metnitz P; European Surgical Outcomes Study (EuSOS) group for Trials Groups of European Society of Intensive Care Medicine; European Society of Anaesthesiology . Preoperative anaemia is associated with poor clinical outcome in non-cardiac surgery patients. Br J Anaesth 113: 416–423, 2014. doi: 10.1093/bja/aeu098. [DOI] [PubMed] [Google Scholar]
- 2.Beattie WS, Karkouti K, Wijeysundera DN, Tait G. Risk associated with preoperative anemia in noncardiac surgery: a single-center cohort study. Anesthesiology 110: 574–581, 2009. doi: 10.1097/ALN.0b013e31819878d3. [DOI] [PubMed] [Google Scholar]
- 3.Cahill LS, Gazdzinski LM, Tsui AK, Zhou YQ, Portnoy S, Liu E, Mazer CD, Hare GM, Kassner A, Sled JG. Functional and anatomical evidence of cerebral tissue hypoxia in young sickle cell anemia mice. J Cereb Blood Flow Metab 37: 994–1005, 2017. doi: 10.1177/0271678X16649194. [DOI] [PMC free article] [PubMed] [Google Scholar]
- 4.Chen X, Ghaffar H, Jen CC, Lazarus AH. Antibody specific for the glycophorin A complex mediates intravenous immune globulin-resistant anemia in a murine model. Transfusion 54: 655–664, 2014. doi: 10.1111/trf.12300. [DOI] [PubMed] [Google Scholar]
- 5.Darby PJ, Kim N, Hare GM, Tsui A, Wang Z, Harrington A, Mazer CD. Anemia increases the risk of renal cortical and medullary hypoxia during cardiopulmonary bypass. Perfusion 28: 504–511, 2013. doi: 10.1177/0267659113490219. [DOI] [PubMed] [Google Scholar]
- 6.Dunkelgrun M, Hoeks SE, Welten GM, Vidakovic R, Winkel TA, Schouten O, van Domburg RT, Bax JJ, Kuijper R, Chonchol M, Verhagen HJ, Poldermans D. Anemia as an independent predictor of perioperative and long-term cardiovascular outcome in patients scheduled for elective vascular surgery. Am J Cardiol 101: 1196–1200, 2008. doi: 10.1016/j.amjcard.2007.11.072. [DOI] [PubMed] [Google Scholar]
- 7.Duque-Sosa P, Martínez-Urbistondo D, Echarri G, Callejas R, Iribarren MJ, Rábago G, Monedero P; Spanish group of renal dysfunction in cardiac surgery (GEDRCC-2) . Perioperative hemoglobin area under the curve is an independent predictor of renal failure after cardiac surgery. Results from a Spanish multicenter retrospective cohort study. PLoS One 12: e0172021, 2017. doi: 10.1371/journal.pone.0172021. [DOI] [PMC free article] [PubMed] [Google Scholar]
- 8.Esipova TV, Karagodov A, Miller J, Wilson DF, Busch TM, Vinogradov SA. Two new “protected” oxyphors for biological oximetry: properties and application in tumor imaging. Anal Chem 83: 8756–8765, 2011. doi: 10.1021/ac2022234. [DOI] [PMC free article] [PubMed] [Google Scholar]
- 9.Evans RG, Zhu MZ, Smith JA, Harrop GK, Thrift AG, Cochrane AD. Intra-operative urinary hypoxia during cardiac surgery on cardiopulmonary bypass predicts later development of acute kidney injury. FASEB J 31: 698–695, 2017. [Google Scholar]
- 10.Fowler AJ, Ahmad T, Phull MK, Allard S, Gillies MA, Pearse RM. Meta-analysis of the association between preoperative anaemia and mortality after surgery. Br J Surg 102: 1314–1324, 2015. doi: 10.1002/bjs.9861. [DOI] [PubMed] [Google Scholar]
- 11.Gupta PK, Sundaram A, Mactaggart JN, Johanning JM, Gupta H, Fang X, Forse RA, Balters M, Longo GM, Sugimoto JT, Lynch TG, Pipinos II. Preoperative anemia is an independent predictor of postoperative mortality and adverse cardiac events in elderly patients undergoing elective vascular operations. Ann Surg 258: 1096–1102, 2013. doi: 10.1097/SLA.0b013e318288e957. [DOI] [PubMed] [Google Scholar]
- 12.Hare GM, Mazer CD, Mak W, Gorczynski RM, Hum KM, Kim SY, Wyard L, Barr A, Qu R, Baker AJ. Hemodilutional anemia is associated with increased cerebral neuronal nitric oxide synthase gene expression. J Appl Physiol (1985) 94: 2058–2067, 2003. doi: 10.1152/japplphysiol.00931.2002. [DOI] [PubMed] [Google Scholar]
- 13.Hare GM, Worrall JM, Baker AJ, Liu E, Sikich N, Mazer CD. Beta2 adrenergic antagonist inhibits cerebral cortical oxygen delivery after severe haemodilution in rats. Br J Anaesth 97: 617–623, 2006. doi: 10.1093/bja/ael238. [DOI] [PubMed] [Google Scholar]
- 14.Hu T, Beattie WS, Mazer CD, Leong-Poi H, Fujii H, Wilson DF, Tsui AK, Liu E, Muhammad M, Baker AJ, Hare GM. Treatment with a highly selective β1 antagonist causes dose-dependent impairment of cerebral perfusion after hemodilution in rats. Anesth Analg 116: 649–662, 2013. doi: 10.1213/ANE.0b013e318280e26d. [DOI] [PubMed] [Google Scholar]
- 15.Johannes T, Mik EG, Nohé B, Unertl KE, Ince C. Acute decrease in renal microvascular PO2 during acute normovolemic hemodilution. Am J Physiol Renal Physiol 292: F796–F803, 2007. doi: 10.1152/ajprenal.00206.2006. [DOI] [PubMed] [Google Scholar]
- 16.Karkouti K, Djaiani G, Borger MA, Beattie WS, Fedorko L, Wijeysundera D, Ivanov J, Karski J. Low hematocrit during cardiopulmonary bypass is associated with increased risk of perioperative stroke in cardiac surgery. Ann Thorac Surg 80: 1381–1387, 2005. doi: 10.1016/j.athoracsur.2005.03.137. [DOI] [PubMed] [Google Scholar]
- 17.Karkouti K, Wijeysundera DN, Beattie WS; Reducing Bleeding in Cardiac Surgery (RBC) Investigators . Risk associated with preoperative anemia in cardiac surgery: a multicenter cohort study. Circulation 117: 478–484, 2008. doi: 10.1161/CIRCULATIONAHA.107.718353. [DOI] [PubMed] [Google Scholar]
- 18.Karkouti K, Wijeysundera DN, Yau TM, Callum JL, Cheng DC, Crowther M, Dupuis JY, Fremes SE, Kent B, Laflamme C, Lamy A, Legare JF, Mazer CD, McCluskey SA, Rubens FD, Sawchuk C, Beattie WS. Acute kidney injury after cardiac surgery: focus on modifiable risk factors. Circulation 119: 495–502, 2009. doi: 10.1161/CIRCULATIONAHA.108.786913. [DOI] [PubMed] [Google Scholar]
- 19.Kina T, Ikuta K, Takayama E, Wada K, Majumdar AS, Weissman IL, Katsura Y. The monoclonal antibody TER-119 recognizes a molecule associated with glycophorin A and specifically marks the late stages of murine erythroid lineage. Br J Haematol 109: 280–287, 2000. doi: 10.1046/j.1365-2141.2000.02037.x. [DOI] [PubMed] [Google Scholar]
- 20.Kulier A, Levin J, Moser R, Rumpold-Seitlinger G, Tudor IC, Snyder-Ramos SA, Moehnle P, Mangano DT; Investigators of the Multicenter Study of Perioperative Ischemia Research Group; Ischemia Research and Education Foundation . Impact of preoperative anemia on outcome in patients undergoing coronary artery bypass graft surgery. Circulation 116: 471–479, 2007. doi: 10.1161/CIRCULATIONAHA.106.653501. [DOI] [PubMed] [Google Scholar]
- 21.Lankadeva YR, Kosaka J, Evans RG, Bellomo R, May CN. Urinary oxygenation as a surrogate measure of medullary oxygenation during angiotensin II therapy in septic acute kidney injury. Crit Care Med 46: e41–e48, 2018. doi: 10.1097/CCM.0000000000002797. [DOI] [PubMed] [Google Scholar]
- 22.Lee KH, Byun SS, Paik JY, Lee SY, Song SH, Choe YS, Kim BT. Cell uptake and tissue distribution of radioiodine labelled D-luciferin: implications for luciferase based gene imaging. Nucl Med Commun 24: 1003–1009, 2003. doi: 10.1097/00006231-200309000-00009. [DOI] [PubMed] [Google Scholar]
- 23.Li M, Bertout JA, Ratcliffe SJ, Eckenhoff MF, Simon MC, Floyd TF. Acute anemia elicits cognitive dysfunction and evidence of cerebral cellular hypoxia in older rats with systemic hypertension. Anesthesiology 113: 845–858, 2010. doi: 10.1097/ALN.0b013e3181eaaef9. [DOI] [PMC free article] [PubMed] [Google Scholar]
- 24.Liss P, Aukland K, Carlsson PO, Palm F, Hansell P. Influence of iothalamate on renal medullary perfusion and oxygenation in the rat. Acta Radiol 46: 823–829, 2005. doi: 10.1080/02841850500335044. [DOI] [PubMed] [Google Scholar]
- 25.Loor G, Li L, Sabik JF 3rd, Rajeswaran J, Blackstone EH, Koch CG. Nadir hematocrit during cardiopulmonary bypass: end-organ dysfunction and mortality. J Thorac Cardiovasc Surg 144: 654–662.e654, 2012. [DOI] [PubMed] [Google Scholar]
- 26.Macgowan CK, Stoops SJ, Zhou YQ, Cahill LS, Sled JG. Evaluation of cerebrovascular impedance and wave reflection in mouse by ultrasound. J Cereb Blood Flow Metab 35: 521–526, 2015. doi: 10.1038/jcbfm.2014.229. [DOI] [PMC free article] [PubMed] [Google Scholar]
- 27.Miceli A, Romeo F, Glauber M, de Siena PM, Caputo M, Angelini GD. Preoperative anemia increases mortality and postoperative morbidity after cardiac surgery. J Cardiothorac Surg 9: 9050, 2014. doi: 10.1186/1749-8090-9-137. [DOI] [PMC free article] [PubMed] [Google Scholar]
- 28.Musallam KM, Tamim HM, Richards T, Spahn DR, Rosendaal FR, Habbal A, Khreiss M, Dahdaleh FS, Khavandi K, Sfeir PM, Soweid A, Hoballah JJ, Taher AT, Jamali FR. Preoperative anaemia and postoperative outcomes in non-cardiac surgery: a retrospective cohort study. Lancet 378: 1396–1407, 2011. doi: 10.1016/S0140-6736(11)61381-0. [DOI] [PubMed] [Google Scholar]
- 29.Naito Y, Tsujino T, Matsumoto M, Sakoda T, Ohyanagi M, Masuyama T. Adaptive response of the heart to long-term anemia induced by iron deficiency. Am J Physiol Heart Circ Physiol 296: H585–H593, 2009. doi: 10.1152/ajpheart.00463.2008. [DOI] [PubMed] [Google Scholar]
- 30.Oostendorp M, de Vries EE, Slenter JM, Peutz-Kootstra CJ, Snoeijs MG, Post MJ, van Heurn LW, Backes WH. MRI of renal oxygenation and function after normothermic ischemia-reperfusion injury. NMR Biomed 24: 194–200, 2011. doi: 10.1002/nbm.1572. [DOI] [PubMed] [Google Scholar]
- 31.Ow CPC, Ngo JP, Ullah MM, Hilliard LM, Evans RG. Renal hypoxia in kidney disease: Cause or consequence? Acta Physiol (Oxf) e12999, 2017. doi: 10.1111/apha.12999. [DOI] [PubMed] [Google Scholar]
- 32.Ragoonanan TE, Beattie WS, Mazer CD, Tsui AK, Leong-Poi H, Wilson DF, Tait G, Yu J, Liu E, Noronha M, Dattani ND, Mitsakakis N, Hare GM. Metoprolol reduces cerebral tissue oxygen tension after acute hemodilution in rats. Anesthesiology 111: 988–1000, 2009. doi: 10.1097/ALN.0b013e3181b87f0e. [DOI] [PubMed] [Google Scholar]
- 33.Safran M, Kim WY, O’Connell F, Flippin L, Günzler V, Horner JW, Depinho RA, Kaelin WG Jr. Mouse model for noninvasive imaging of HIF prolyl hydroxylase activity: assessment of an oral agent that stimulates erythropoietin production. Proc Natl Acad Sci USA 103: 105–110, 2006. doi: 10.1073/pnas.0509459103. [DOI] [PMC free article] [PubMed] [Google Scholar]
- 34.Schirmer DA, Song SC, Baliff JP, Harbers SO, Clynes RA, Krop-Watorek A, Halverson GR, Czerwinski M, Spitalnik SL. Mouse models of IgG- and IgM-mediated hemolysis. Blood 109: 3099–3107, 2007. doi: 10.1182/blood-2006-08-040139. [DOI] [PubMed] [Google Scholar]
- 35.Schneck K, Washington M, Holder D, Lodge K, Motzel S. Hematologic and serum biochemical reference values in nontransgenic FVB mice. Comp Med 50: 32–35, 2000. [PubMed] [Google Scholar]
- 36.Seicean A, Seicean S, Alan N, Schiltz NK, Rosenbaum BP, Jones PK, Kattan MW, Neuhauser D, Weil RJ. Preoperative anemia and perioperative outcomes in patients who undergo elective spine surgery. Spine 38: 1331–1341, 2013. doi: 10.1097/BRS.0b013e3182912c6b. [DOI] [PubMed] [Google Scholar]
- 37.Semenza GL. Hypoxia-inducible factor 1 (HIF-1) pathway. Sci STKE 2007: cm8, 2007. doi: 10.1126/stke.4072007cm8. [DOI] [PubMed] [Google Scholar]
- 38.Stafford-Smith M, Grocott HP. Renal medullary hypoxia during experimental cardiopulmonary bypass: a pilot study. Perfusion 20: 53–58, 2005. doi: 10.1191/0267659105pf780oa. [DOI] [PubMed] [Google Scholar]
- 39.Swaminathan M, Phillips-Bute BG, Conlon PJ, Smith PK, Newman MF, Stafford-Smith M. The association of lowest hematocrit during cardiopulmonary bypass with acute renal injury after coronary artery bypass surgery. Ann Thorac Surg 76: 784–791, 2003. doi: 10.1016/S0003-4975(03)00558-7. [DOI] [PubMed] [Google Scholar]
- 40.Tosun M, Ulugol H, Kırat B, Kilercik M, Erek E, Aksu U, Alhan C, Toraman F. Urine partial oxygen pressure as early marker of acute kidney injury after paediatric cardiac surgery. J Cardiothorac Vasc Anesth 31: S14–S15, 2017. doi: 10.1053/j.jvca.2017.02.078. [DOI] [Google Scholar]
- 41.Tsui AK, Marsden PA, Mazer CD, Adamson SL, Henkelman RM, Ho JJ, Wilson DF, Heximer SP, Connelly KA, Bolz SS, Lidington D, El-Beheiry MH, Dattani ND, Chen KM, Hare GM. Priming of hypoxia-inducible factor by neuronal nitric oxide synthase is essential for adaptive responses to severe anemia. Proc Natl Acad Sci USA 108: 17544–17549, 2011. doi: 10.1073/pnas.1114026108. [DOI] [PMC free article] [PubMed] [Google Scholar]
- 42.Tsui AK, Marsden PA, Mazer CD, Sled JG, Lee KM, Henkelman RM, Cahill LS, Zhou YQ, Chan N, Liu E, Hare GM. Differential HIF and NOS responses to acute anemia: defining organ-specific hemoglobin thresholds for tissue hypoxia. Am J Physiol Regul Integr Comp Physiol 307: R13–R25, 2014. doi: 10.1152/ajpregu.00411.2013. [DOI] [PubMed] [Google Scholar]
- 43.van Bommel J, Siegemund M, Henny CP, Ince C. Heart, kidney, and intestine have different tolerances for anemia. Transl Res 151: 110–117, 2008. doi: 10.1016/j.trsl.2007.11.001. [DOI] [PubMed] [Google Scholar]
- 44.van Bommel J, Trouwborst A, Schwarte L, Siegemund M, Ince C, Henny CP. Intestinal and cerebral oxygenation during severe isovolemic hemodilution and subsequent hyperoxic ventilation in a pig model. Anesthesiology 97: 660–670, 2002. doi: 10.1097/00000542-200209000-00021. [DOI] [PubMed] [Google Scholar]
- 45.Viola J, Gomez MM, Restrepo C, Maltenfort MG, Parvizi J. Preoperative anemia increases postoperative complications and mortality following total joint arthroplasty. J Arthroplasty 30: 846–848, 2015. doi: 10.1016/j.arth.2014.12.026. [DOI] [PubMed] [Google Scholar]
- 46.Wang Z, Holthoff JH, Seely KA, Pathak E, Spencer HJ III, Gokden N, Mayeux PR. Development of oxidative stress in the peritubular capillary microenvironment mediates sepsis-induced renal microcirculatory failure and acute kidney injury. Am J Pathol 180: 505–516, 2012. doi: 10.1016/j.ajpath.2011.10.011. [DOI] [PMC free article] [PubMed] [Google Scholar]
- 47.Wu WC, Schifftner TL, Henderson WG, Eaton CB, Poses RM, Uttley G, Sharma SC, Vezeridis M, Khuri SF, Friedmann PD. Preoperative hematocrit levels and postoperative outcomes in older patients undergoing noncardiac surgery. JAMA 297: 2481–2488, 2007. doi: 10.1001/jama.297.22.2481. [DOI] [PubMed] [Google Scholar]
- 48.Yu X, Menard M, Seabright G, Crispin M, Lazarus AH. A monoclonal antibody with anti-d-like activity in murine immune thrombocytopenia requires Fc domain function for immune thrombocytopenia ameliorative effects. Transfusion 55: 1501–1511, 2015. doi: 10.1111/trf.13032. [DOI] [PubMed] [Google Scholar]
- 49.Zhou YQ, Foster FS, Nieman BJ, Davidson L, Chen XJ, Henkelman RM. Comprehensive transthoracic cardiac imaging in mice using ultrasound biomicroscopy with anatomical confirmation by magnetic resonance imaging. Physiol Genomics 18: 232–244, 2004. doi: 10.1152/physiolgenomics.00026.2004. [DOI] [PubMed] [Google Scholar]


