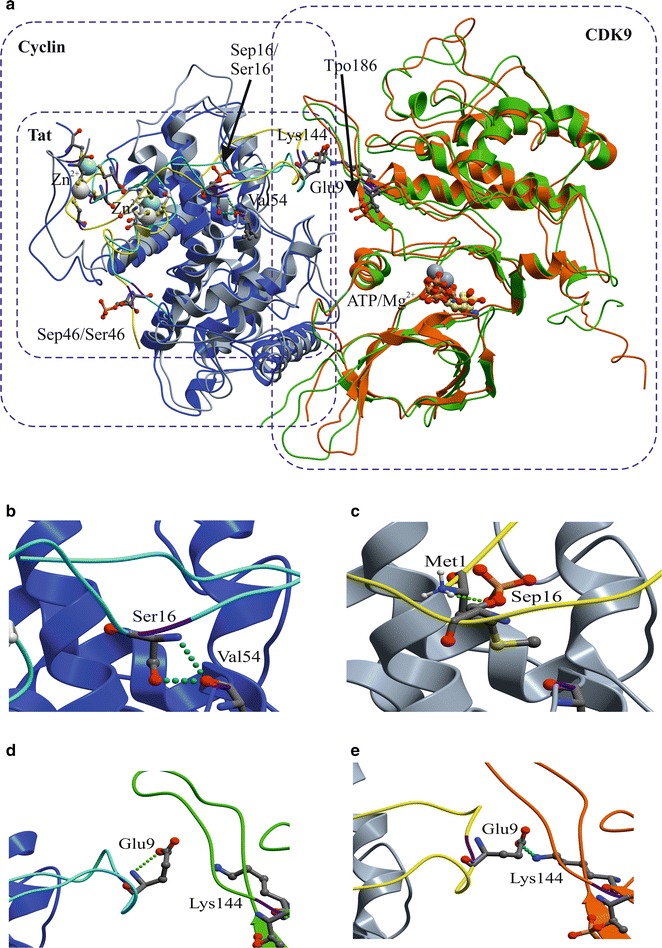
Fig. 9.

Molecular dynamics analysis (MD) of CDK9/Cyclin T1/Tat complex with phosphorylated Tat Ser-16 and Ser-46. a Spatial superposition of the CDK9/Cyclin T1/Tat complexes with non-phosphorylated Tat (S16&S46) and Tat phosphorylated on Ser-16 and Ser-46 (S16P&S46P) at 20 ns MD time, protein main chains are shown as follows: Cyclin T1—in blue and grey colors, CDK9—in green and carrot colors and Tat—in yellow and cyan colors, respectively. CDK9 Thr-186 was phosphorylated in all the MD simulations. ATP+Mg2+ is shown in ball-and-stick presentation. Initial conformation of the complexes were built by homology with crystal structure (PDB: 3MIA) as described in Methods. Arrows indicates the position of Ser-16 and phosphorylated Ser-16 (Sep16) and phosphorylated Thr 186 (Tpo186). Phosphorylated Ser-46 is abbreviated as Sep46. b Enlarged picture showing interaction of Tat Ser-16 with Cyclin T1 Val-54. b, c Enlarged pictures showing conformational change of Tat protein due to its phosphorylation. Initial interaction of Tat Ser-16 with Cyclin T1 Val-54 (b) is lost upon Ser-16 phosphorylation and the interaction with Tat Met-1 is formed (c). d, e Enlarged pictures showing interaction of Tat Glu-9 with CDK9 Lys-144 when Tat was phosphorylated (e) and no interaction when Tat was not phosphorylation (d)
