Abstract
The chitinase-like protein YKL-40 mediates airway inflammation, and serum levels are associated with asthma severity. However, asthma phenotypes associated with YKL-40 levels have not been precisely defined.
We conducted an unsupervised cluster analysis of asthma patients treated at the Yale Center for Asthma and Airways Disease (YCAAD, n=156) to identify subgroups according to YKL-40 level. The resulting YKL-40 clusters were cross-validated in cohorts from the Severe Asthma Research Program (SARP) (n=167) and the New York University Bellevue Asthma Repository (NYUBAR) (n=341). A sputum transcriptome analysis revealed molecular pathways associated with YKL-40 subgroups.
Four YKL-40 clusters (C1-4) were identified. C3 and C4 had high serum YKL-40 levels compared to C1 and C2. C3 was associated with earlier onset and longer duration of disease, severe airflow obstruction and near-fatal asthma exacerbations. C4 had the highest serum YKL-40 levels, adult onset, and less airflow obstruction but frequent exacerbations. An airway transcriptome analysis in C3 and C4 showed activation of non-Type 2 inflammatory pathways.
Elevated serum YKL-40 levels were associated with two distinct clinical asthma phenotypes: one with irreversible airway obstruction and another with severe exacerbations. The YKL-40 clusters are potentially useful for identification of individuals with severe or exacerbation-prone asthma.
Keywords: Severe asthma; CHI3L1 protein, human; CHI3L1/YKL-40 protein, human; Cluster analysis; Sputum transcriptome; Near-fatal asthma; Obesity; Airflow obstruction
INTRODUCTION
In subjects with asthma, high serum levels of the chitinase-like protein YKL-40, which is encoded by the CHI3L1 gene, are associated with severe asthma, lung function impairment, and exacerbations of disease (1). However, unsupervised learning models to more precisely define the phenotypes associated with YKL-40 have not been tested (2).
We have previously shown that the associations between asthma risk, disease severity and high serum levels of YKL-40 are partially mediated by the genetic effects of a single nucleotide polymorphism (SNP) in the CHI3L1 gene promoter and an intronic SNP.(3, 4) While human and mechanistic studies have demonstrated that YKL-40 is involved in airway remodeling(5, 6), they have not demonstrated a clear association between markers of Type 2 (T2) inflammation and YKL-40. (1, 2, 7) This suggests that YKL-40 may influence or be influenced by non-T2 inflammatory responses in asthma.
In recent years, cluster analyses have been successfully used to identify subgroups of patients characterized by similar features of asthma based on both clinical and molecular features of the disease. (8–11) In the Severe Asthma Research Program (SARP), Moore and colleagues used eleven clinical and physiologic features of asthma to identify five clusters of patients with distinct clinical characteristics.(9) These features have been replicated in independent cohorts, demonstrating that these clinical and physiologic features are important discriminators of asthma heterogeneity. (12, 13)
Because of the known association of YKL-40 with severe asthma and the evidence suggesting a connection between YKL-40 and non-T2 inflammatory pathways, we sought to use an unsupervised clustering method to understand the clinical and physiologic features of the disease and the distinct molecular mechanisms present in the airway of asthmatics with high serum levels of YKL-40. The goal of these experiments was twofold. First, we tested whether the addition of serum YKL-40 levels to previously validated clinical features of asthma severity in an unsupervised clustering analysis (9) would lead to the identification of specific clinical subgroups characterized by increased expression of YKL-40. Second, we sought to identify specific gene expression profiles in sputum associated with the YKL-40 clusters.
METHODS
Subjects
Study participants in the Yale Center for Asthma and Airways Disease (YCAAD) cohort, based in New Haven, Connecticut, completed a comprehensive phenotyping study visit. The inclusion and exclusion criteria and the YCAAD phenotyping protocol have been previously described. (1) Additional description of the methods is included in the online supplement. Study participants in the SARP and New York University Bellevue Asthma Repository (NYUBAR) cohorts completed study visits using established standard operating procedures, as previously described. (9, 14) The characteristics of these subjects have been reported in previous publications. (9, 12, 14, 15) These studies were conducted following institutional review board approval for all of the institutions involved, and all participants provided informed consent.
Measurement of serum and sputum YKL-40 levels
YKL-40 levels were measured in duplicate in serum (all cohorts) and sputum (YCAAD only) supernatant specimens by enzyme-linked immunosorbent assay (ELISA) (Quidel, San Diego, CA) as previously described. (1, 11)
Sputum induction and gene expression measurements
Sputum induction was performed in the YCAAD cohort only; additional details are described in the supplement.
Statistical analysis
All statistical, clustering and classifier analyses were performed using R software (R: A Language and Environment for Statistical Computing. R Foundation for Statistical Computing, Vienna, Austria). Results are reported as medians and interquartile ranges [25% to 75%; IQRs] unless otherwise specified. Continuous variables were tested using non-parametric tests, including the Wilcoxon test to compare two groups and the Kruskal-Wallis test to compare more than two groups. Categorical variables were analyzed with chi-square tests. P values of less than 0.05 were considered significant. Specific details on the clustering and gene expression analyses are described in the supplement.
RESULTS
Discovery and validation of YKL-40 clusters
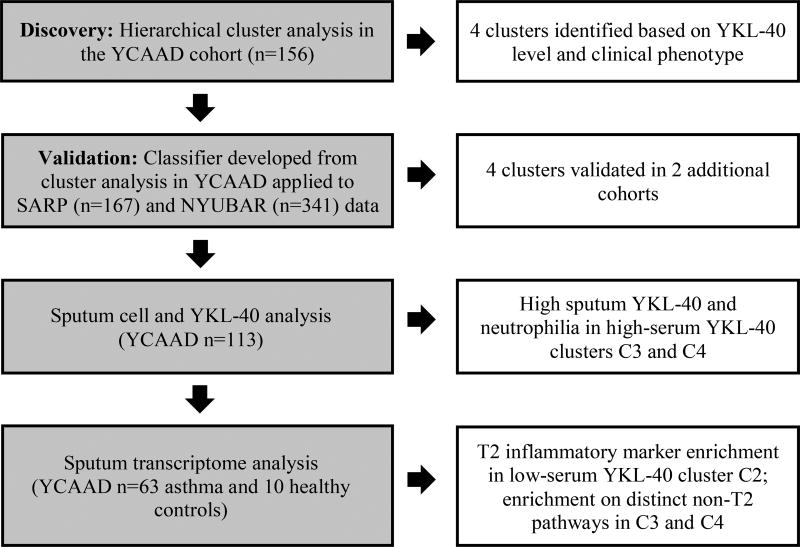
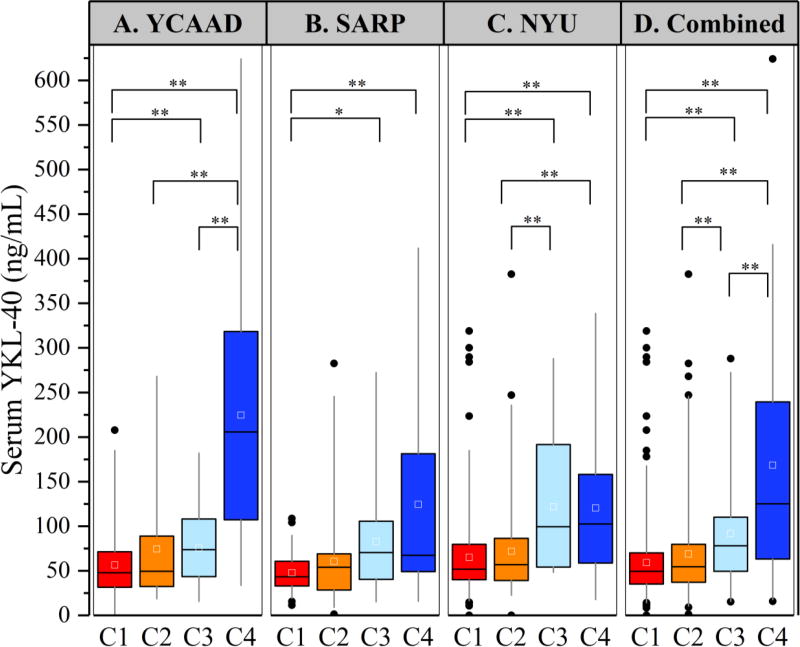
To identify subgroups of asthma patients associated with elevated serum YKL-40 levels, we conducted an unsupervised clustering analysis on 156 individuals from the YCAAD cohort using serum YKL-40 levels and 11 clinical and physiologic features of asthma, as described in Methods. (9) Figure 1 illustrates the study workflow. Four subgroups of disease patients with differing serum YKL-40 levels and distinct clinical and physiologic characteristics of disease (clusters C1-C4, Figure 2A) were identified. Cluster C1 had the lowest median YKL-40 value (48 [32–71] ng/mL), which was similar to the median value of C2 (50 [33–88] ng/mL). These median values were also similar to YKL-40 values (43 [20–184] ng/mL) in healthy subjects. (16) The high-YKL-40 cluster C3 had a higher median YKL-40 level than the median level of C1 and C2 combined (74 [6–108] vs 49 [32–74] ng/mL; p=0.05). C4 also had a higher median level than C1 and C2 combined (206 [110–311] vs 49 [32–74] ng/mL; p<0.01). The median YKL-40 level of C1 and C2 combined was lower than that of C3 and C4 combined (49 [32–74] vs 110 [68–222] ng/mL; p<0.01) (Table 1).
Figure 1.
Study workflow
Figure 2.
Serum YKL-40 Levels in the four YKL-40 asthma clusters. A: Serum YKL-40 levels in clusters C1–C4 in the YCAAD cohort. C3 and C4 had elevated serum levels of YKL-40 compared to C1 and C2. Serum YKL-40 levels were similar among the clusters in the SARP and NYUBAR cohorts (panels B and C, respectively) compared to the YCAAD cohort. Panel D shows the combined values for all cohorts (*p<0.05; **p<0.01).
Table 1.
Demographic and Clinical Characteristics of the YKL-40 Clusters in the YCAAD, SARP and NYUBAR Cohorts
| Total cohort | Cluster 1 | Cluster 2 | Cluster 3 | Cluster 4 | p value | |
|
| ||||||
| Discovery Cohort: YCAAD Subjects | 156 | 76 (49%) | 30 (19%) | 20 (13%) | 30 (19%) | |
|
| ||||||
| Age (years) | 49 (37–58) | 42 (17–52) | 49 (37–56) | 52 (44–57) | 60 (52–65) | <0.01 |
|
| ||||||
| Female gender | 117 (75%) | 70 (92%) | 7 (23%) | 13 (65%) | 27 (90%) | <0.01 |
|
| ||||||
| Race | ||||||
| White | 114 (73%) | 60 (79%) | 24 (80%) | 11 (55%) | 19 (63%) | 0.2 |
| African-American | 29 (19%) | 10 (13%) | 6 (20%) | 5 (25%) | 8 (27%) | |
| Other | 13 (8%) | 6 (8%) | 4 (20%) | 3 (10%) | ||
|
| ||||||
| Hispanic | 18 (12%) | 6 (8%) | 3 (10%) | 3 (15%) | 6 (20%) | 0.36 |
|
| ||||||
| BMI (kg/m2) | 28.9 (23.8–35.7) | 25.1 (22.2–32.0) | 30.0 (25.7–32.4) | 31.2 (27.1–37.1) | 32.9 (29.0–39.7) | <0.01 |
|
| ||||||
| Age of onset (years) | 21 (5–39) | 16 (5–31) | 30 (10–40) | 5 (3–14) | 42 (25–54) | <0.01 |
|
| ||||||
| Asthma duration (years) | 21 (10–33) | 18 (12–32) | 20 (6–29) | 40 (32–50) | 16 (7–30) | <0.01 |
|
| ||||||
| Severe by EPR-3 | 63 (40%) | 16 (21%) | 13 (43%) | 16 (80%) | 18 (60%) | <0.01 |
|
| ||||||
| Lifetime hospitalizations for asthma | 65 (42%) | 22 (29%) | 12 (40%) | 15 (75%) | 16 (53%) | <0.01 |
|
| ||||||
| Hospitalizations for asthma in the past year | 35 (22%) | 11 (15%) | 6 (20%) | 7 (35%) | 11 (37%) | 0.04 |
|
| ||||||
| ACT score | 17 (11–21) | 20 (17–23) | 13 (10–19) | 15 (9–20) | 10 (9–17) | <0.01 |
|
| ||||||
| FEV1 Pre-BD* | 82 (60–94) | 91 (85–103) | 72 (62–85) | 43 (34–53) | 72 (53–81) | <0.01 |
|
| ||||||
| FEV1 Post-BD* | 86 (71–98) | 96 (86–108) | 86 (76–98) | 51 (39–56) | 75 (61–86) | <0.01 |
|
| ||||||
| FEV1/FVC Post-BD | 74 (65–81) | 79 (73–85) | 70 (64–75) | 53 (41–66) | 71 (64–83) | <0.01 |
|
| ||||||
| Bronchodilator Response* | 5 (2–9) | 4 (2–7) | 12 (4–20) | 6 (4–8) | 5 (1–10) | <0.01 |
|
| ||||||
| ICS use | 127 (81%) | 55 (72%) | 25 (83%) | 20 (100%) | 27 (90%) | 0.02 |
|
| ||||||
| ICS dose (mcg/day) | 500 (0–675) | 320 (0–640) | 410 (0–830) | 640 (500–1000) | 640 (500–1000) | <0.01 |
|
| ||||||
| Oral or systemic CS | 18 (12%) | 3 (4%) | 3 (10%) | 3 (15%) | 9 (30%) | <0.01 |
|
| ||||||
| LABA use | 103 (66%) | 40 (53%) | 18 (60%) | 19 (95%) | 26 (87%) | <0.01 |
|
| ||||||
| Serum YKL-40 (ng/mL) | 63 (35–108) | 48 (32–71) | 50 (33–88) | 74 (46–108) | 206 (110–311) | <0.01 |
|
| ||||||
| Total cohort | Cluster 1 | Cluster 2 | Cluster 3 | Cluster 4 | p value | |
|
| ||||||
| Validation Cohort 1 | ||||||
|
| ||||||
| SARP Subjects | 167 | 84 (50%) | 57 (34%) | 14 (8%) | 12 (7%) | |
|
| ||||||
| Age (years) | 36 (26–47) | 33 (25–44) | 35 (25–43) | 51 (38–59) | 48 (46–54) | <0.01 |
|
| ||||||
| Female gender | 115 (68%) | 84 (100%) | 19 (33%) | 6 (43%) | 4 (33%) | <0.01 |
|
| ||||||
| Race | ||||||
| White | 119 (71%) | 60 (71%) | 41 (72%) | 11 (79%) | 7 (58%) | 0.56 |
| African-American | 41 (25%) | 19 (23%) | 15 (26%) | 2 (14%) | 5 (42%) | |
| Other | 7 (4%) | 5 (6%) | 1 (2%) | 1 (7%) | ||
|
| ||||||
| BMI (kg/m2) | 26.8 (23.5–32.4) | 26.1 (23.0–29.8) | 27.0 (24.0–32.8) | 28.6 (24.4–32.4) | 31.1 (27.1–33.3) | 0.17 |
|
| ||||||
| Age of onset (years) | 10 (4–26) | 11 (4–22) | 6 (2–22) | 5 (1–28) | 40 (38–46) | <0.01 |
|
| ||||||
| Asthma duration (years) | 19 (9–32) | 17 (9–29) | 20 (15–33) | 33 (29–45) | 7 (4–11) | <0.01 |
|
| ||||||
| Lifetime hospitalizations for asthma | 71 (43%) | 30 (36%) | 24 (42%) | 12 (86%) | 5 (42%) | 0.01 |
|
| ||||||
| FEV1 Pre-BD* | 80 (62–92) | 88 (80–98) | 73 (59–88) | 32 (28–41) | 58 (49–70) | <0.01 |
|
| ||||||
| FEV1 Post-BD* | 92 (79–102) | 96 (88–106) | 89 (79–100) | 44 (40–49) | 79 (71–98) | <0.01 |
|
| ||||||
| Bronchodilator Response* | 10 (5–16) | 7 (4–10) | 15 (12–22) | 10 (6–14) | 12 (10–22) | <0.01 |
|
| ||||||
| ICS use | 73 (44%) | 35 (42%) | 22 (39%) | 7 (50%) | 9 (75%) | <0.01 |
|
| ||||||
| Oral or systemic CS | 19 (12%) | 5 (6%) | 5 (9%) | 5 (36%) | 3 (25%) | <0.01 |
|
| ||||||
| LABA use | 83 (50%) | 37 (44%) | 25 (44%) | 10 (71%) | 11 (92%) | <0.01 |
|
| ||||||
| Serum YKL-40 (ng/mL) | 49 (34–68) | 43 (33–61) | 54 (28–69) | 70 (42–101) | 67 (50–165) | <0.01 |
|
| ||||||
| Total cohort | Cluster 1 | Cluster 2 | Cluster 3 | Cluster 4 | p value | |
|
| ||||||
| Validation Cohort 2 | ||||||
|
| ||||||
| NYUBAR Subjects | 341 | 205 (60%) | 97 (28%) | 15 (4%) | 24 (7%) | |
|
| ||||||
| Age (years) | 37 (25–50) | 34 (24–49) | 34 (26–43) | 46 (42–62) | 54 (48–62) | <0.01 |
|
| ||||||
| Female gender | 242 (71%) | 205 (100%) | 11 (11%) | 9 (60%) | 17 (71%) | <0.01 |
|
| ||||||
| Race | ||||||
| White | 75% (255) | 76% (159) | 68% (66) | 67% (10) | 83% (20) | 0.06 |
| African-American | 19% (66) | 20% (40) | 19% (19) | 27% (4) | 13% (3) | |
| Other | 6% (21) | 3% (6) | 13% (13) | 6% (1) | 4% (1) | |
|
| ||||||
| Hispanic | 188 (55%) | 119 (58%) | 47 (49%) | 9 (60%) | 13 (54%) | 0.46 |
|
| ||||||
| BMI (kg/m2) | 28.0 (24.0–33.0) | 28.0 (23.0–33.0) | 27.0 (24.0–32.0) | 32.0 (27.5–40.0) | 28.5 (24.0–33.5) | 0.09 |
|
| ||||||
| Age of onset (years) | 16 (8–28) | 18 (10–27) | 12 (6–22) | 9 (5–21) | 45 (39–53) | <0.01 |
|
| ||||||
| Asthma duration (years) | 16 (7–28) | 15 (6–25) | 18 (12–29) | 36 (32–42) | 8 (3–16) | <0.01 |
|
| ||||||
| Severe by EPR-3 | 209 (61%) | 121 (59%) | 50 (52%) | 15 (100%) | 23 (96%) | 0.01 |
|
| ||||||
| Hospitalizations for asthma in the past year | 36 (11%) | 14 (7%) | 11 (11%) | 7 (47%) | 4 (17%) | <0.01 |
|
| ||||||
| FEV1 Pre-BD* | 82 (71–93) | 86 (76–95) | 79 (68–89) | 40 (33–48) | 67 (55–72) | <0.01 |
|
| ||||||
| FEV1 Post-BD* | 87 (76–96) | 89 (80–99) | 86 (77–95) | 48 (45–51) | 73 (60–76) | <0.01 |
|
| ||||||
| Bronchodilator Response* | 4 (1–7) | 3 (1–6) | 5 (2–10) | 4 (1–9) | 6 (2–8) | 0.001 |
|
| ||||||
| ICS use | 191 (56%) | 109 (53%) | 45 (46%) | 15 (100%) | 22 (92%) | <0.01 |
|
| ||||||
| Oral or systemic CS | 199 (58%) | 115 (56%) | 51 (53%) | 15 (100%) | 18 (75%) | <0.01 |
|
| ||||||
| LABA use | 141 (41%) | 85 (42%) | 29 (30%) | 12 (80%) | 15 (63%) | <0.01 |
|
| ||||||
| Serum YKL-40 (ng/mL) | 56 (42–87) | 52 (40–80) | 57 (39–86) | 99 (60–177) | 103 (61–156) | <0.01 |
Data are n (%) or median (interquartile range) unless otherwise specified.
Percent of predicted
Definition of abbreviations: YCAAD: Yale Center for Asthma and Airways Disease; SARP: Severe Asthma Research Program; NYUBAR: New York University/Bellevue Asthma Registry; BMI: Body Mass Index; EPR-3: Expert Panel Report-3; ACT: Asthma Control Test; FEV1: Forced Expiratory Volume 1 Second; BD: Bronchodilator; FVC: Forced Vital Capacity; ICS: Inhaled Corticosteroids; CS: Corticosteroids; LABA: Long-Acting Beta Agonist.
To validate the YKL-40 clusters and their associated clinical, physiologic and biologic features, a classifier algorithm was developed using recursive partitioning on the YCAAD cohort (Supplemental Figure E1). This classifier was applied to the SARP (n=167) and NYUBAR (n=341) cohorts (Figures 2B and 2C and Table 1). Subgrouping of both the SARP and NYUBAR cohorts using this algorithm demonstrated clusters with YKL-40 levels similar to those of the YCAAD clusters (Figures 2B and 2C and Table 1). C1 and C2 had lower serum YKL-40 levels compared to C3 and C4 in both the SARP (46 [32–65] vs 68 [46–126] ng/mL, p=0.002) and NYUBAR cohorts (53 [40–81] vs 99 [59–162] ng/mL, p<0.001) (Table 2). Combining the data from the three cohorts showed that the serum YKL-40 level in C3 was 58% higher and C4 was 133% higher compared to C1 and C2 combined (Supplemental Table E2). Overall, this analysis of 3 cohorts of asthma revealed consistent subgroups of individuals with either normal (C1 and C2) or elevated serum levels of YKL-40 (C3 and C4).
Table 2.
Biomarkers in YCAAD, SARP and NYUBAR by YKL-40 Asthma Clusters
| Total cohort | Cluster 1 | Cluster 2 | Cluster 3 | Cluster 4 | p value | |
|---|---|---|---|---|---|---|
| YCAAD | 156 | 76 (49%) | 30 (19%) | 20 (13%) | 30 (19%) | |
| Sputum YKL-40 (ng/mL)* | 15 (0–40) | 10 (0–37) | 10 (0–26) | 28 (5–58) | 32 (8–43) | 0.16 |
| Serum IgE (IU/mL) | 91 (25–277) | 77 (23–220) | 85 (17–328) | 163 (48–341) | 72 (30–351) | 0.40 |
| FeNO (ppb) | 28 (19–53) | 25 (18–55) | 43 (23–60) | 20 (15–35) | 32 (21–50) | 0.02 |
| Absolute blood eosinophil count (cells/µL) | 165 (86–335) | 136 (84–276) | 170 (101–322) | 192 (86–399) | 170 (91–338) | 0.69 |
| Percent eosinophils in sputum* | 3 (1–7) | 2 (1–5) | 4 (2–8) | 2 (1–4) | 5 (2–12) | 0.08 |
| Percent neutrophils in sputum* | 37 (27–48) | 34 (27–44) | 37 (24–45) | 46 (34–55) | 43 (29–50) | 0.15 |
| Percent macrophages in sputum | 55 (42–65) | 60 (51–67) | 51 (42–67) | 47 (35–55) | 44 (35–58) | <0.01 |
| SARP | 167 | 84 (50%) | 57 (34%) | 14 (8%) | 12 (7%) | |
| Serum IgE (IU/mL) | 116 (34–301) | 73 (24–191) | 177 (60–354) | 162 (18–262) | 270 (200–333) | 0.03 |
| FeNO (ppb) | 25 (16–50) | 21 (11–52) | 29 (23–63) | 27 (16–40) | 52 (16–111) | 0.04 |
| Percent blood eosinophils | 3 (2–5) | 2.5 (1.8–4.0) | 4.0 (2.0–6.0) | 5.1 (4.0–7.5) | 4.5 (2.3–9.8) | <0.01 |
| NYUBAR | 341 | 205 (60%) | 97 (28%) | 15 (4%) | 24 (7%) | |
| Serum IgE (IU/mL) | 129 (41–345) | 119 (31–328) | 197 (74–443) | 130 (52–278) | 94 (46–173) | 0.02 |
Values are expressed as median (interquartile range).
Data available for (n=113: C1:54; C2:17; C3:18; C4:24)
Definition of abbreviations: YCAAD: Yale Center for Asthma and Airways Disease; SARP: Severe Asthma Research Program; NYUBAR: New York University/Bellevue Asthma Registry; IgE: Immunoglobulin E; IU: International Units; FeNO: Fraction of Exhaled Nitric Oxide; ppb: Parts per Billion.
Clinical and physiologic characteristics of the YKL-40 clusters
To determine the phenotype of each of the YKL-40 clusters (C1–C4), we compared their clinical characteristics (Table 1). In all three cohorts, individuals in YKL-40 C1 (the cluster with the lowest serum YKL-40 levels) were the most prevalent (53%), the youngest (median age 42 years) and predominantly female (97%). Compared to the high-YKL-40 clusters C3 and C4, YKL-40 C1 was also distinguished by a lower disease severity, low rates of exacerbations requiring hospitalization or mechanical ventilation (Figures 3A–C), normal lung function, and lower doses of medications.
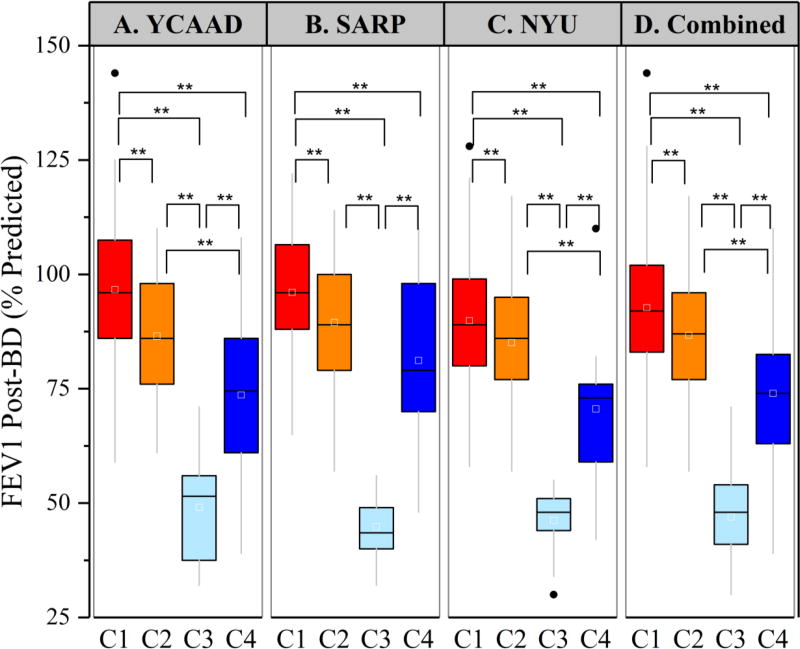
Figure 3.
Differences in lung function among the YKL-40 clusters in the 3 cohorts. Post-bronchodilator FEV1 was significantly different among the YKL-40 clusters in all three cohorts (panels A–C). Cluster C3 had severely reduced post-BD FEV1 in all three cohorts (**p<0.01).
YKL-40 cluster C2, which was also characterized by low serum YKL-40 levels, was the second most common cluster (27%) and was predominantly male (70%). C2 was the only cluster demonstrating bronchodilation following the administration of a short-acting β-agonist in all three cohorts (Table 1). Despite local differences in IgE levels (Table 2), Cluster C2 had higher IgE levels than C1 in all three cohorts (172 [66–392] vs 96 [29–252] IU/mL, p<0.01; Supplemental Table E2) and similar levels to C3 and C4. Therefore, clusters C1 and C2 had similar low YKL-40 levels but differed by bronchodilation response and IgE levels.
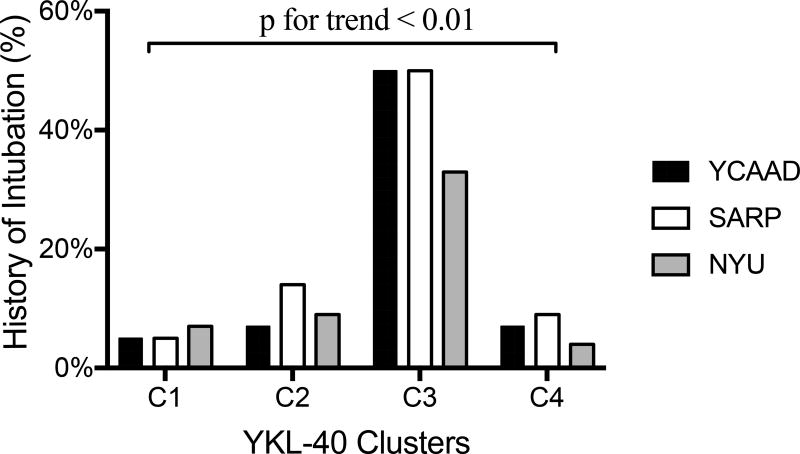
The high-YKL-40 cluster C3 included individuals who were older (median age 49 years) and had more severe disease than clusters C1 and C2. Compared with the other three clusters, C3 had the earliest asthma onset (median 6 years) and the longest duration of disease (median 36 years) (Supplemental Table E2), as well as the highest rates of near-fatal asthma (NFA) exacerbations requiring intubation (average 44%; Figure 4) and irreversible airflow obstruction (median post-bronchodilator [BD] forced expiratory volume 1 second [FEV1] 48%) (Supplemental Table E2). Moreover, 96% of patients in C3 were using inhaled and/or systemic corticosteroids. Despite the high rates of corticosteroid use, C3 also required additional controller medications (Table 1).
Figure 4.
Rates of near-fatal asthma exacerbations requiring mechanical ventilation in the YKL-40 clusters among the three cohorts. The rate was significantly higher in cluster C3 in all three cohorts (*p<0.01).
C4 was the cluster with the highest serum YKL-40 levels (Figure 2). C4 differed from C3 in several other key features, including older age of asthma onset (median 43 years) and shorter duration of disease (median 11 years) (Supplemental Table E2), as well as a lower rate of NFA (9%) and less-severe persistent airflow obstruction (median post-BD FEV1 74%; Figures 3 and 4, Supplemental Table E2). Interestingly, although statistically significant in YCAAD only, C4 had the highest rate of obesity among the clusters in YCAAD (67% vs 41%, p=0.007). A combined analysis of all three cohorts demonstrated that clusters C3 and C4 had higher rates of obesity than clusters C1 and C2 (57% vs 35%, p<0.01). Similarly to C1, C4 was predominantly female (73%) but differed by age of onset (43 vs 15 years, p<0.01). C4 had less bronchodilator response (BDR) compared to C2 (6% vs 9%, p=0.04) (Supplemental Table E2).
This analysis demonstrated consistent phenotypic characteristics within YKL-40 clusters in three asthma cohorts, including several features that were not observed in the original SARP clusters and thus were not included in the clustering algorithm (higher IgE in C2 and higher NFA rates in C3). A chi-square test comparing the YKL-40 clusters with the original SARP clusters demonstrated a statistically significant difference between the results of the two clustering approaches (p<0.001) (Supplemental Table E3). Overall, the most striking clinical findings were that C2 was characterized by elevated IgE, while C3 and C4 were characterized by severe disease and were discriminated by high serum YKL-40 levels, severe exacerbations and worse airflow obstruction.
Sputum cell characteristics and YKL-40 protein expression associated with YKL-40 clusters
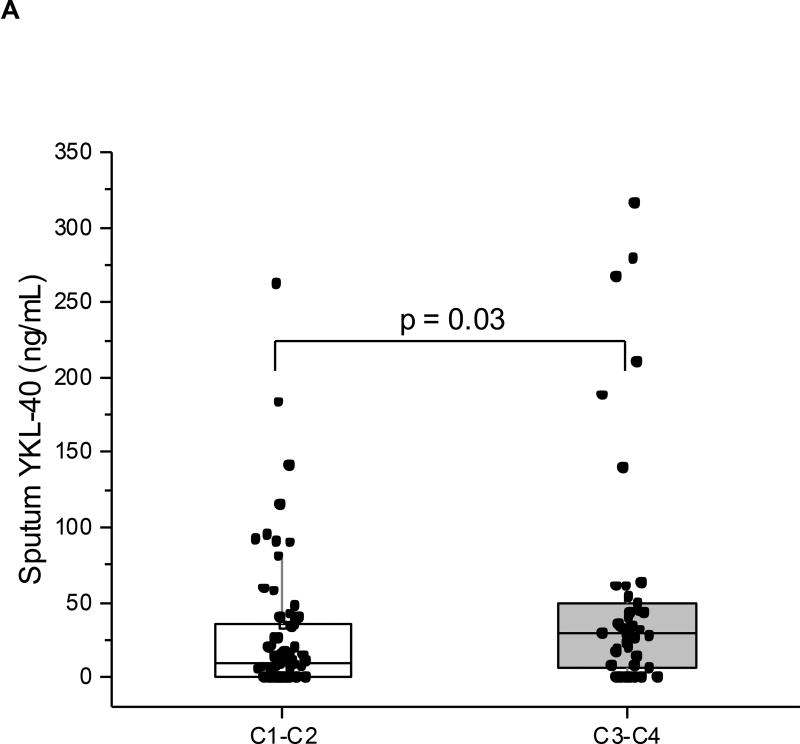
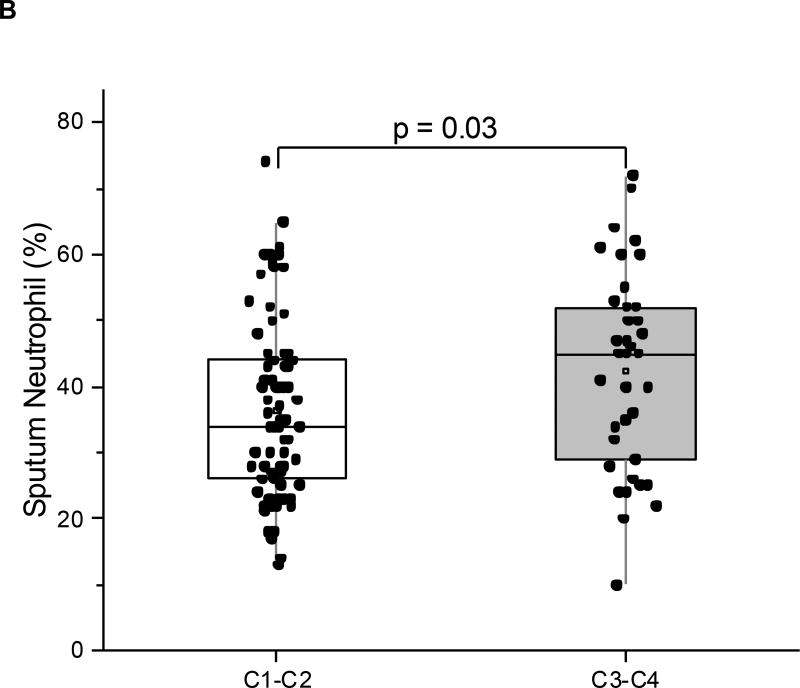
We next evaluated correlations between the YKL-40 clusters and cell and protein data from induced sputum in a YCAAD subset (n=113: C1:54; C2:17; C3:18; C4:24) (Table 2). Although pairwise comparisons across clusters did not identify particular differences in sputum cell counts or YKL-40 levels (Table 2), we examined whether the combination of clusters with high serum YKL-40, C3 and C4, had distinctive sputum characteristics when compared to the combination of clusters with low serum YKL-40, C1 and C2. The clusters with high serum YKL-40 levels, C3 and C4, demonstrated higher sputum YKL-40 protein levels (28.8 vs 9.6 ng/mL, p=0.03; Figure 5A) and higher neutrophil levels (45% vs 34%, p=0.03; Figure 5B) compared to the low-YKL-40 clusters, C1 and C2. In all the subjects in this YCAAD subset, sputum YKL-40 levels were also correlated with serum YKL-40 levels (rho=0.23, p=0.02; data not shown). Sputum macrophage percentages were higher in C1 and C2 compared with C3 and C4 (58 vs 44%, p<0.01). An analysis of sputum cell characteristics revealed no differences in sputum cellularity or cell viability across the four YKL-40 clusters (data not shown).
Figure 5.
Sputum neutrophils (A) and sputum YKL-40 levels (B) in the YCAAD cohort. Both values were increased in C1 and C2 compared to C3 and C4.
Sputum T2 inflammatory gene expression associated with YKL-40 clusters
Based on the observed clinical, physiologic and sputum differences among the YKL-40 clusters, we hypothesized that gene expression profiles in the airway would also differ among the clusters. Therefore, we analyzed mRNA expression in the sputum of a subset of the YCAAD subjects involved in the discovery of the YKL-40 clusters (n=63: C1:30; C2:8; C3:13; C4:12) and healthy controls (HC; n=10) (Supplemental Table E4). Sputum CHI3L1 mRNA expression did not differ significantly among the 63 YCAAD subjects or in pairwise comparisons between clusters and healthy controls (data not shown).
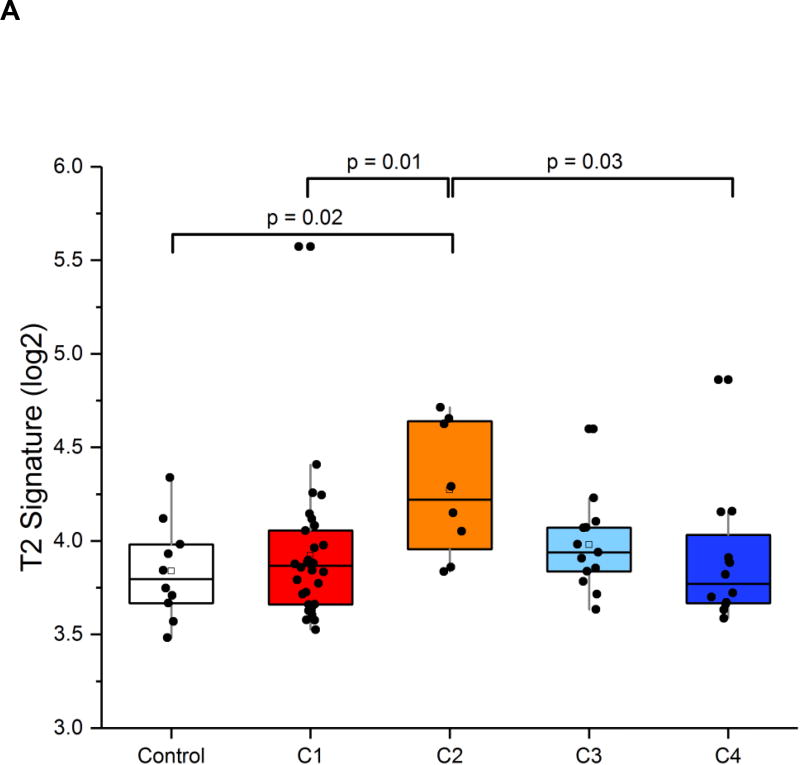
Based on the above-mentioned low YKL-40 expression and elevated IgE levels in C2, this cluster was predicted to be characterized by T2 inflammation. Consistent with this hypothesis, the T2 expression signature (the average mRNA expression of IL-4, IL-5 and IL-13) was highest in C2 compared to the other YKL-40 clusters (p=0.04; Figure 6A). A broader transcriptome analysis revealed additional transcriptional enrichment for the IL-5 signaling pathway in C2, providing additional evidence of T2 enrichment in this cluster (Supplemental Tables E7 and E8). The presence of the highest T2 mRNA expression in this cluster with low YKL-40 protein levels suggests that YKL-40 is primarily associated with non-T2 inflammatory pathways.(11, 17) In contrast, the high-serum-YKL-40 clusters, C3 and C4, were characterized by high sputum YKL-40 protein levels and airway neutrophilia and were not associated with sputum markers of T2 inflammation. Taken together, these results suggest that YKL-40 may be a non-T2 asthma biomarker.
Figure 6.
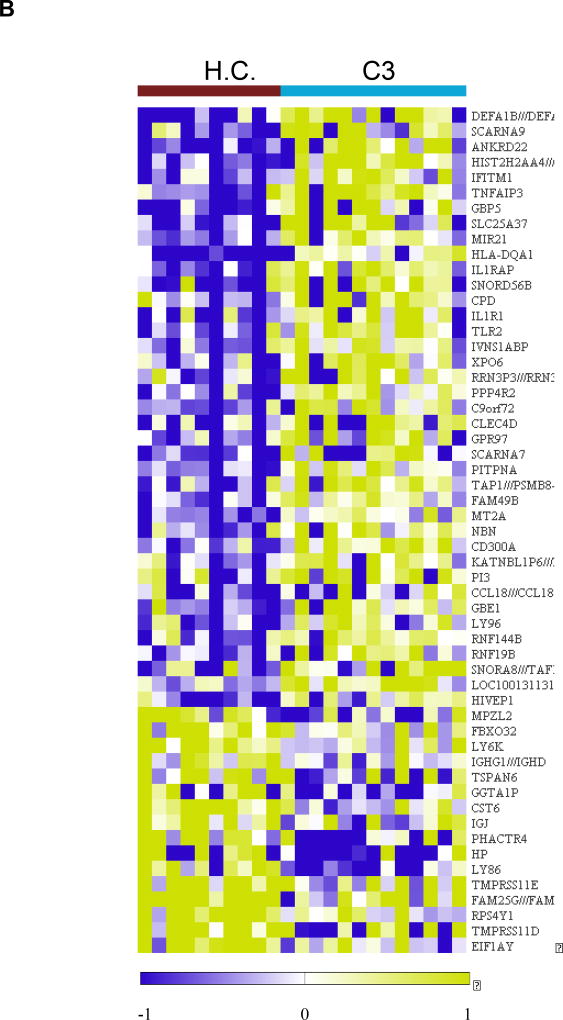
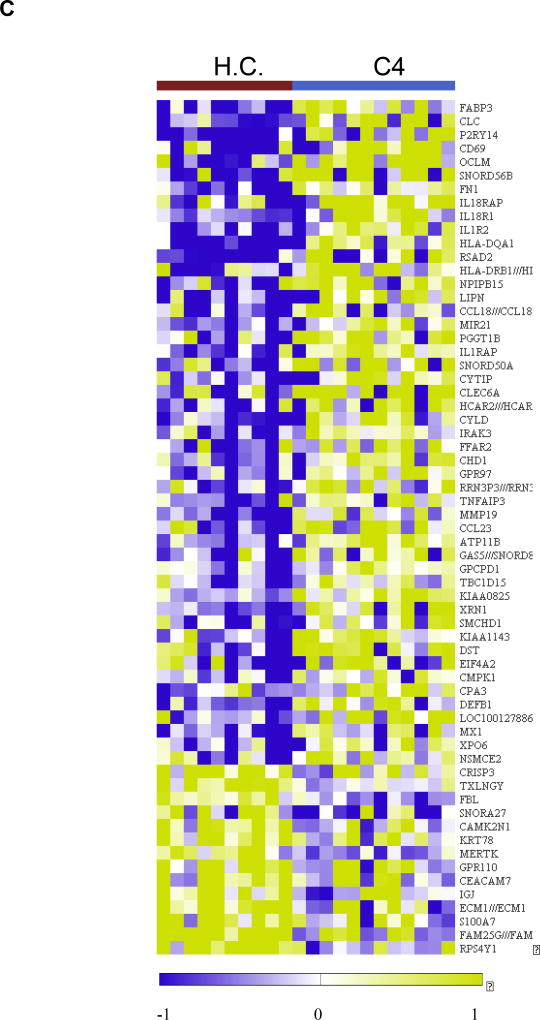
Analysis of the sputum transcriptome in the YKL-40 clusters and healthy controls in the YCAAD cohort. A: Mean T2 gene expression levels (IL-4, -5, and -13) among the YKL-40 clusters demonstrate lower levels of T2 gene expression in C3 and C1 and C4. B: Heatmap of the sputum gene expression in C3 compared to healthy controls (HC) shows activation of innate immunity pathways and the NETosis pathway. C: Heatmap of the sputum gene expression in C3 compared to HC shows activation of the IL-1 and IL-18 pathways in C4.
Sputum non-T2 immune gene expression associated with YKL-40 clusters
To further delineate the association between non-T2 inflammatory mechanisms and YKL-40, the 63 YCAAD subjects’ sputum expression profiles were compared to those of the healthy controls. Cluster C1 was enriched for genes involved in airway immunity and innate immune response to viral infection networks (Supplemental Tables E5 and E6).
The high-YKL-40 clusters C3 and C4 showed similar gene ontology enrichment for immune responses. Both C3 and C4 showed eleven genes with identical dysregulation and similar fold change magnitude (Supplemental Table E9). Supplemental Figure E2 illustrates the expression of 5 genes common to both clusters that have been previously linked to airway biology and asthma: TNFAIP3 (18–20); MIR21 (21, 22); HLA-DQA1 (23, 24); IL1RAP (25); and CCL18 (26–28).
Transcriptional changes specific to cluster C3 are presented in Figure 6B and Supplemental Table E10. The identified transcripts included several genes involved in the innate and adaptive immune responses, such as the defensins DEFA1, DEFA1B, and DEFA3; TLR2; IFITM1; and LY86 (Supplemental Figure E3). A pathway enrichment analysis of C3 transcripts identified several dysregulated pathways, including neutrophil extracellular trap (NET) formation (NETosis); immune response to bacterial infections in the airway; and inhibition of neutrophil migration by pro-resolving lipid mediators. This enrichment analysis suggested that among individuals in C3, there was activation of innate immunity and the NETosis pathways that are involved in sterile inflammation and autoimmunity (Supplemental Tables E10 and E11).
In contrast to C3, the transcriptional profile associated with C4 showed activation of several genes involved in the IL-1 and IL-18 pathways (Figures 6C; Supplemental Figure E4; Supplemental Tables E12 and E13) and no activation of NETosis.
DISCUSSION
In this study, we identified four YKL-40 asthma clusters using unsupervised clustering based on a combination of serum YKL-40 levels and clinical features of asthma. Two of the four YKL-40 clusters (C3 and C4) were characterized by high serum YKL-40 levels compared to the other two clusters (C1 and C2). The clusters had distinct clinical, physiologic, and sputum inflammatory cell features. Following their discovery in the YCAAD cohort, the YKL-40 clusters were validated in two additional cohorts, SARP and NYUBAR. Importantly, the YKL-40 clusters had distinct characteristics that separated them from the original SARP clusters and resulted from the inclusion of serum YKL-40 levels in the clustering algorithm, which linked these clinical characteristics to circulating levels of the YKL-40 protein. This clustering was supported by non-cluster features, including history of intubations and molecular differences in the sputum transcriptome. The known association between YKL-40 and non-T2 inflammation was supported by the discovery of T2 inflammatory enrichment in the low-YKL-40 cluster C2 combined with the enrichment of non-T2 inflammatory genes in high-YKL-40 clusters C3 and C4. Furthermore, the non-T2 networks observed in C3 were distinct from those in C4.
In all three cohorts, the subjects in C3 were linked by higher rates of NFA and severe airflow obstruction. These shared features may underlie the mechanisms leading to increased YKL-40 production in this group. Several molecular mechanisms may explain the association between YKL-40 and these clinical and physiological features. The first mechanism proposes a link between mechanical stress and YKL-40 in patients with NFA. Given that mechanical stress on the airway epithelium is known to lead to YKL-40 production (29), the exposure to airway stretch seen in NFA-related respiratory failure or in response to severe airflow obstruction may be responsible, at least in part, for the increased YKL-40 seen in C3.
The second mechanism posits that YKL-40 activates smooth muscle proliferation, leading to airway remodeling and severe airflow obstruction. This mechanism is based on the following observations: 1) in airway epithelial cells, exposure to YKL-40 causes increased IL-8 synthesis and smooth muscle proliferation in vitro; and 2) YKL-40 increases protease-activated receptor 2 activity, which enhances bronchial smooth muscle proliferation. (5, 6)
A novel finding of our study is the presence in cluster C3 of increases in both sputum neutrophils and the expression of genes involved in the formation of NETs. NETs act as extracellular DNA traps formed by neutrophils and eosinophils, and NETosis is a highly immunogenic cell death process associated with NET formation. NETosis has been associated with sterile inflammation, autoimmunity and chronic conditions associated with inflammation. (30) Previous reports have found NETs in the airway of individuals with allergic asthma, and our study provides support for the role of NETosis in this severe asthma subgroup characterized by high YKL-40. (31)
The identification of asthma cluster C3 is relevant given the association of cluster C3 with severe fixed airflow obstruction and NFA, as well as the potential to target NET production in the airway with inhaled recombinant DNAse (in a similar fashion to cystic fibrosis). (32)
In contrast to C3, YKL-40 cluster C4 had the highest serum YKL-40 level, older (adult) disease onset and less airflow obstruction. C4 was also characterized by poor asthma control; frequent, severe exacerbations requiring hospitalization; and a high rate of obesity (although statistically significant only in the YCAAD cohort). The association with obesity may explain, at least in part, the elevated YKL-40 levels in C4. It is known that visceral adipose tissue is a source of YKL-40. (33) More importantly, the association between obesity and asthma may be mediated through a combination of elevated YKL-40 due to visceral fat accumulation and T2 inflammation in asthma (34). Despite the similarities between C3 and C4 in terms of sputum neutrophil counts and the activation of the airway-associated genes TNFAIP3, HLA-DQA1, IL1RAP, CCL18, and MIR21, the C4 sputum gene expression profile showed distinct activation of the IL-1 and IL-18 pathways. The discrepancies between clusters C3 and C4, including contrasting gene expression profiles and different fold differences in serum YKL-40 levels, suggest that their molecular associations with YKL-40 may be mediated by at least two different non-T2 inflammatory mechanisms. Our finding that sputum CHI3L1 mRNA expression did not differ among clusters in the YCAAD cohort suggests that the higher serum YKL-40 levels in C3 and C4 may be related to mechanisms independent of elevated CHI3L1 mRNA expression in sputum cells (i.e., production by bronchial epithelial cells, smooth muscle; production by visceral fat).
The cluster analysis also identified two low-serum-YKL-40 clusters. C1 was an overwhelmingly female subgroup characterized by non-severe asthma and preserved lung function, while C2 was a high-T2 subgroup with IL-5 signaling pathway enrichment, similar to previously identified asthma clusters with high T2 gene expression (17, 35). These clinical differences and the presence of significant differences in serum YKL-40 levels confirm our ability to discriminate asthma subgroups using this approach. This novel framework for characterizing distinct subgroups of patients with asthma according to clinical features and serum YKL-40 will enable further studies to unveil the distinct mechanisms underlying these associations.
Our study does have some limitations, including its cross-sectional nature. We were unable to determine whether the YKL-40 clusters remained stable over time or were affected by changes in the environment or medications, including compliance with the latter. Therefore, prospective studies of these clusters are necessary to understand the interaction of these clusters with time and asthma therapy. Not all of the pairwise comparisons across the clusters in all cohorts demonstrated the same differences. This may be partially explained by local differences in the study cohorts despite the similar inclusion criteria, therapeutic effects, sample sizes and variations in classifier performance of the two validation cohorts. However, our approach revealed clusters with nearly identical physiologic and clinical characteristics and comparable YKL-40 levels among the three cohorts. Selection of other asthma features and models may have yielded different clustering results, however, we sought to balance cluster discovery and the ability to validate these novel clusters in independent cohorts. Our model may evolve over time as our understanding of YKL-40 biology improves and additional asthma cohorts incorporate sputum transcriptome in their patient characterization.
In conclusion, using a clustering analysis of subjects with asthma based on YKL-40 levels and clinical and physiologic features of the disease, we identified four distinct clusters of subjects. Two clusters were connected by elevated serum YKL-40 levels but were differentiated by the magnitude of the YKL-40 elevation and specific clinical/physiologic abnormalities. This study suggests that the use of YKL-40 levels in combination with clinical and physiologic features of asthma can identify specific subgroups of patients with distinct clinical features and risk for severe airflow obstruction, NFA and frequent severe exacerbations. The high-YKL-40 clusters C3 and C4 may be clinically and biologically relevant for identifying patients with severe asthma with non-T2 disease.
Supplementary Material
Acknowledgments
NYUBAR: The authors acknowledge the Colton family for their continued support, and Maria Elena Fernandez Beros, PhD. YCAAD: The authors acknowledge Sarah Marone and Eleni Kapagiannidou.
Sources of support
NIH T32HL007778-18 and T15LM007056-26. R01HL095390-03
1K01HL125474-01, R01HL069116, and GCRC RR03186, CTSA UL1 TR000038
FAMRI Young Clinical Scientist Award 113393
Aerocrine Fellow Award 2010
References
- 1.Chupp GL, Lee CG, Jarjour N, Shim YM, Holm CT, He S, et al. A chitinase-like protein in the lung and circulation of patients with severe asthma. N Engl J Med. 2007;357(20):2016–27. doi: 10.1056/NEJMoa073600. [DOI] [PubMed] [Google Scholar]
- 2.James AJ, Reinius LE, Verhoek M, Gomes A, Kupczyk M, Hammar U, et al. Increased YKL-40 and Chitotriosidase in Asthma and Chronic Obstructive Pulmonary Disease. Am J Respir Crit Care Med. 2016;193(2):131–42. doi: 10.1164/rccm.201504-0760OC. [DOI] [PubMed] [Google Scholar]
- 3.Ober C, Tan Z, Sun Y, Possick JD, Pan L, Nicolae R, et al. Effect of variation in CHI3L1 on serum YKL-40 level, risk of asthma, and lung function. N Engl J Med. 2008;358(16):1682–91. doi: 10.1056/NEJMoa0708801. [DOI] [PMC free article] [PubMed] [Google Scholar]
- 4.Gomez JL, Crisafi GM, Holm CT, Meyers DA, Hawkins GA, Bleecker ER, et al. Genetic variation in chitinase 3-like 1 (CHI3L1) contributes to asthma severity and airway expression of YKL-40. J Allergy Clin Immunol. 2015;136(1):51–8. e10. doi: 10.1016/j.jaci.2014.11.027. [DOI] [PMC free article] [PubMed] [Google Scholar]
- 5.Tang H, Sun Y, Shi Z, Huang H, Fang Z, Chen J, et al. YKL-40 induces IL-8 expression from bronchial epithelium via MAPK (JNK and ERK) and NF-κB pathways, causing bronchial smooth muscle proliferation and migration. J Immunol. 2013;190(1):438–46. doi: 10.4049/jimmunol.1201827. [DOI] [PubMed] [Google Scholar]
- 6.Bara I, Ozier A, Girodet PO, Carvalho G, Cattiaux J, Begueret H, et al. Role of YKL-40 in bronchial smooth muscle remodeling in asthma. Am J Respir Crit Care Med. 2012;185(7):715–22. doi: 10.1164/rccm.201105-0915OC. [DOI] [PubMed] [Google Scholar]
- 7.Jia G, Erickson RW, Choy DF, Mosesova S, Wu LC, Solberg OD, et al. Periostin is a systemic biomarker of eosinophilic airway inflammation in asthmatic patients. J Allergy Clin Immunol. 2012;130(3):647–54. e10. doi: 10.1016/j.jaci.2012.06.025. [DOI] [PMC free article] [PubMed] [Google Scholar]
- 8.Haldar P, Pavord ID, Shaw DE, Berry MA, Thomas M, Brightling CE, et al. Cluster analysis and clinical asthma phenotypes. Am J Respir Crit Care Med. 2008;178(3):218–24. doi: 10.1164/rccm.200711-1754OC. [DOI] [PMC free article] [PubMed] [Google Scholar]
- 9.Moore WC, Meyers DA, Wenzel SE, Teague WG, Li H, Li X, et al. Identification of asthma phenotypes using cluster analysis in the Severe Asthma Research Program. Am J Respir Crit Care Med. 2010;181(4):315–23. doi: 10.1164/rccm.200906-0896OC. [DOI] [PMC free article] [PubMed] [Google Scholar]
- 10.Modena BD, Tedrow JR, Milosevic J, Bleecker ER, Meyers DA, Wu W, et al. Gene expression in relation to exhaled nitric oxide identifies novel asthma phenotypes with unique biomolecular pathways. Am J Respir Crit Care Med. 2014;190(12):1363–72. doi: 10.1164/rccm.201406-1099OC. [DOI] [PMC free article] [PubMed] [Google Scholar]
- 11.Yan X, Chu JH, Gomez J, Koenigs M, Holm C, He X, et al. Noninvasive Analysis of the Sputum Transcriptome Discriminates Clinical Phenotypes of Asthma. Ann Am Thorac Soc. 2016;13(Suppl 1):S104–5. doi: 10.1513/AnnalsATS.201510-681MG. [DOI] [PMC free article] [PubMed] [Google Scholar]
- 12.Patrawalla P, Kazeros A, Rogers L, Shao Y, Liu M, Fernandez-Beros ME, et al. Application of the asthma phenotype algorithm from the Severe Asthma Research Program to an urban population. PLoS One. 2012;7(9):e44540. doi: 10.1371/journal.pone.0044540. [DOI] [PMC free article] [PubMed] [Google Scholar]
- 13.Bourdin A, Molinari N, Vachier I, Varrin M, Marin G, Gamez AS, et al. Prognostic value of cluster analysis of severe asthma phenotypes. J Allergy Clin Immunol. 2014;134(5):1043–50. doi: 10.1016/j.jaci.2014.04.038. [DOI] [PubMed] [Google Scholar]
- 14.Reibman J, Marmor M, Filner J, Fernandez-Beros ME, Rogers L, Perez-Perez GI, et al. Asthma is inversely associated with Helicobacter pylori status in an urban population. PLoS One. 2008;3(12):e4060. doi: 10.1371/journal.pone.0004060. [DOI] [PMC free article] [PubMed] [Google Scholar]
- 15.Liu M, Rogers L, Cheng Q, Shao Y, Fernandez-Beros ME, Hirschhorn JN, et al. Genetic variants of TSLP and asthma in an admixed urban population. PLoS One. 2011;6(9):e25099. doi: 10.1371/journal.pone.0025099. [DOI] [PMC free article] [PubMed] [Google Scholar]
- 16.Johansen JS, Lottenburger T, Nielsen HJ, Jensen JE, Svendsen MN, Kollerup G, et al. Diurnal, weekly, and long-time variation in serum concentrations of YKL-40 in healthy subjects. Cancer Epidemiol Biomarkers Prev. 2008;17(10):2603–8. doi: 10.1158/1055-9965.EPI-07-2766. [DOI] [PubMed] [Google Scholar]
- 17.Peters MC, Mekonnen ZK, Yuan S, Bhakta NR, Woodruff PG, Fahy JV. Measures of gene expression in sputum cells can identify TH2-high and TH2-low subtypes of asthma. J Allergy Clin Immunol. 2014;133(2):388–94. doi: 10.1016/j.jaci.2013.07.036. [DOI] [PMC free article] [PubMed] [Google Scholar]
- 18.Kang NI, Yoon HY, Lee YR, Won M, Chung MJ, Park JW, et al. A20 attenuates allergic airway inflammation in mice. J Immunol. 2009;183(2):1488–95. doi: 10.4049/jimmunol.0900163. [DOI] [PubMed] [Google Scholar]
- 19.Simpson LJ, Patel S, Bhakta NR, Choy DF, Brightbill HD, Ren X, et al. A microRNA upregulated in asthma airway T cells promotes TH2 cytokine production. Nat Immunol. 2014;15(12):1162–70. doi: 10.1038/ni.3026. [DOI] [PMC free article] [PubMed] [Google Scholar]
- 20.Schuijs MJ, Willart MA, Vergote K, Gras D, Deswarte K, Ege MJ, et al. Farm dust and endotoxin protect against allergy through A20 induction in lung epithelial cells. Science. 2015;349(6252):1106–10. doi: 10.1126/science.aac6623. [DOI] [PubMed] [Google Scholar]
- 21.Lu TX, Munitz A, Rothenberg ME. MicroRNA-21 is up-regulated in allergic airway inflammation and regulates IL-12p35 expression. J Immunol. 2009;182(8):4994–5002. doi: 10.4049/jimmunol.0803560. [DOI] [PMC free article] [PubMed] [Google Scholar]
- 22.Liu Y, Yang K, Shi H, Xu J, Zhang D, Wu Y, et al. MiR-21 modulates human airway smooth muscle cell proliferation and migration in asthma through regulation of PTEN expression. Exp Lung Res. 2015;41(10):535–45. doi: 10.3109/01902148.2015.1090501. [DOI] [PubMed] [Google Scholar]
- 23.Lasky-Su J, Himes BE, Raby BA, Klanderman BJ, Sylvia JS, Lange C, et al. HLA-DQ strikes again: genome-wide association study further confirms HLA-DQ in the diagnosis of asthma among adults. Clin Exp Allergy. 2012;42(12):1724–33. doi: 10.1111/cea.12000. [DOI] [PMC free article] [PubMed] [Google Scholar]
- 24.Pino-Yanes M, Gignoux CR, Galanter JM, Levin AM, Campbell CD, Eng C, et al. Genome-wide association study and admixture mapping reveal new loci associated with total IgE levels in Latinos. J Allergy Clin Immunol. 2015;135(6):1502–10. doi: 10.1016/j.jaci.2014.10.033. [DOI] [PMC free article] [PubMed] [Google Scholar]
- 25.Savenije OE, Mahachie John JM, Granell R, Kerkhof M, Dijk FN, de Jongste JC, et al. Association of IL33-IL-1 receptor-like 1 (IL1RL1) pathway polymorphisms with wheezing phenotypes and asthma in childhood. J Allergy Clin Immunol. 2014;134(1):170–7. doi: 10.1016/j.jaci.2013.12.1080. [DOI] [PubMed] [Google Scholar]
- 26.de Nadaï P, Charbonnier AS, Chenivesse C, Sénéchal S, Fournier C, Gilet J, et al. Involvement of CCL18 in allergic asthma. J Immunol. 2006;176(10):6286–93. doi: 10.4049/jimmunol.176.10.6286. [DOI] [PubMed] [Google Scholar]
- 27.Kim HB, Kim CK, Iijima K, Kobayashi T, Kita H. Protein microarray analysis in patients with asthma: elevation of the chemokine PARC/CCL18 in sputum. Chest. 2009;135(2):295–302. doi: 10.1378/chest.08-0962. [DOI] [PMC free article] [PubMed] [Google Scholar]
- 28.Gavala ML, Kelly EA, Esnault S, Kukreja S, Evans MD, Bertics PJ, et al. Segmental allergen challenge enhances chitinase activity and levels of CCL18 in mild atopic asthma. Clin Exp Allergy. 2013;43(2):187–97. doi: 10.1111/cea.12032. [DOI] [PMC free article] [PubMed] [Google Scholar]
- 29.Park JA, Drazen JM, Tschumperlin DJ. The chitinase-like protein YKL-40 is secreted by airway epithelial cells at base line and in response to compressive mechanical stress. J Biol Chem. 2010;285(39):29817–25. doi: 10.1074/jbc.M110.103416. [DOI] [PMC free article] [PubMed] [Google Scholar]
- 30.Branzk N, Papayannopoulos V. Molecular mechanisms regulating NETosis in infection and disease. Semin Immunopathol. 2013;35(4):513–30. doi: 10.1007/s00281-013-0384-6. [DOI] [PMC free article] [PubMed] [Google Scholar]
- 31.Dworski R, Simon HU, Hoskins A, Yousefi S. Eosinophil and neutrophil extracellular DNA traps in human allergic asthmatic airways. J Allergy Clin Immunol. 2011;127(5):1260–6. doi: 10.1016/j.jaci.2010.12.1103. [DOI] [PMC free article] [PubMed] [Google Scholar]
- 32.Papayannopoulos V, Staab D, Zychlinsky A. Neutrophil elastase enhances sputum solubilization in cystic fibrosis patients receiving DNase therapy. PLoS One. 2011;6(12):e28526. doi: 10.1371/journal.pone.0028526. [DOI] [PMC free article] [PubMed] [Google Scholar]
- 33.Catalán V, Gómez-Ambrosi J, Rodríguez A, Ramírez B, Rotellar F, Valentí V, et al. Increased circulating and visceral adipose tissue expression levels of YKL-40 in obesity-associated type 2 diabetes are related to inflammation: impact of conventional weight loss and gastric bypass. J Clin Endocrinol Metab. 2011;96(1):200–9. doi: 10.1210/jc.2010-0994. [DOI] [PubMed] [Google Scholar]
- 34.Ahangari F, Sood A, Ma B, Takyar S, Schuyler M, Qualls C, et al. Chitinase 3-like-1 regulates both visceral fat accumulation and asthma-like Th2 inflammation. Am J Respir Crit Care Med. 2015;191(7):746–57. doi: 10.1164/rccm.201405-0796OC. [DOI] [PMC free article] [PubMed] [Google Scholar]
- 35.Woodruff PG, Boushey HA, Dolganov GM, Barker CS, Yang YH, Donnelly S, et al. Genome-wide profiling identifies epithelial cell genes associated with asthma and with treatment response to corticosteroids. Proc Natl Acad Sci U S A. 2007;104(40):15858–63. doi: 10.1073/pnas.0707413104. [DOI] [PMC free article] [PubMed] [Google Scholar]
Associated Data
This section collects any data citations, data availability statements, or supplementary materials included in this article.


