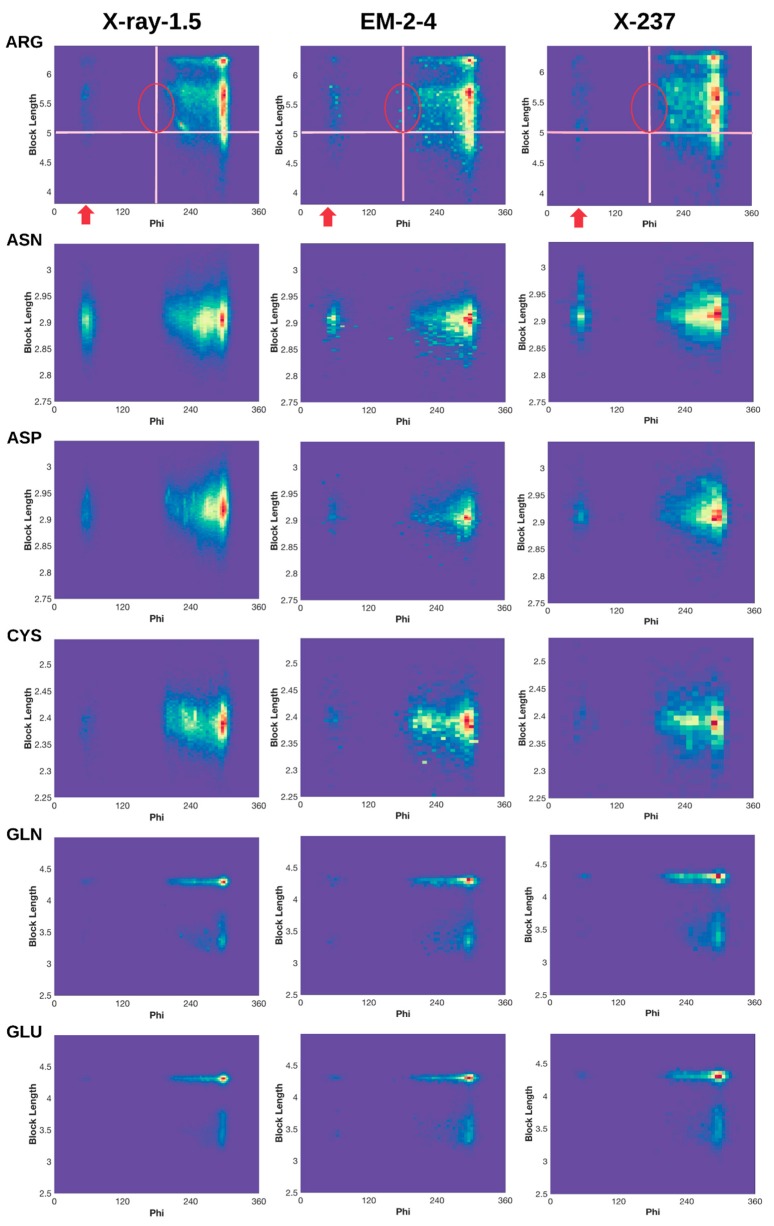
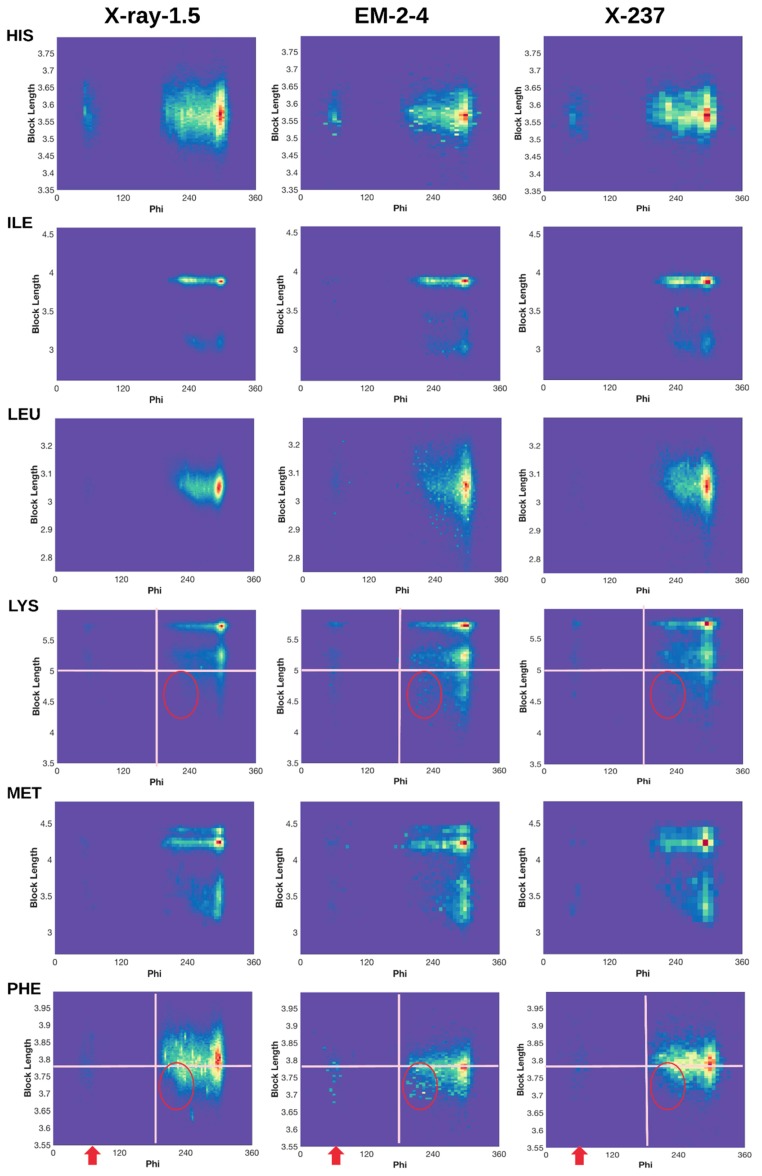
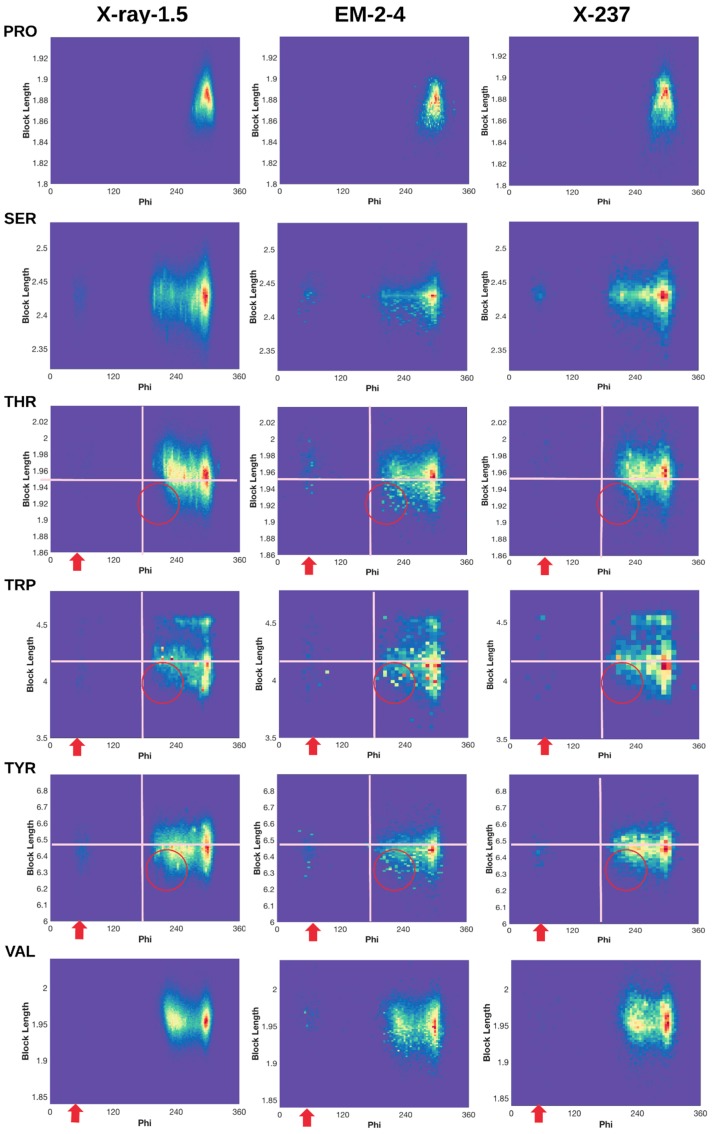
Figure 3.
Normalized 2D histogram of (ϕ, dBlock) for 18 residue types (Alanine (ALA) and Glycine (GLY) not included). Normalized 2D histograms of X-ray-1.5 data set (left column), EM-2-4 data set (middle column), and X-ray-237 data set (right column) were plotted using the ndhist function of MATLAB such that the most popular (ϕ, dBlock) is colored red and the least popular is in dark blue [41]. Visually observed difference regions are labeled with red arrows and circles. Cross lines are drawn to assist comparison.


