Abstract
The presence of integral membrane proteins induces the formation of distinct domains in the lipid bilayer portion of biological membranes. Qualitative application of both continuous wave (CW) and saturation recovery (SR) electron paramagnetic resonance (EPR) spin-labeling methods allowed discrimination of the bulk, boundary, and trapped lipid domains. A recently developed method, which is based on the CW EPR spectra of phospholipid (PL) and cholesterol (Chol) analog spin labels, allows evaluation of the relative amount of PLs (% of total PLs) in the boundary plus trapped lipid domain and the relative amount of Chol (% of total Chol) in the trapped lipid domain [M. Raguz, L. Mainali, W. J. O’Brien, and W. K. Subczynski (2015), Exp. Eye Res., 140:179–186]. Here, a new method is presented that, based on SR EPR spin-labeling, allows quantitative evaluation of the relative amounts of PLs and Chol in the trapped lipid domain of intact membranes. This new method complements the existing one, allowing acquisition of more detailed information about the distribution of lipids between domains in intact membranes. The methodological transition of the SR EPR spin-labeling approach from qualitative to quantitative is demonstrated. The abilities of this method are illustrated for intact cortical and nuclear fiber cell plasma membranes from porcine eye lenses. Statistical analysis (Student’s t-test) of the data allowed determination of the separations of mean values above which differences can be treated as statistically significant (P ≤ 0.05) and can be attributed to sources other than preparation/technique.
Keywords: saturation-recovery, EPR, spin label, membrane domains, fluidity, eye lens
1. Introduction
During the last 35 years, the National Biomedical EPR Center at the Medical College of Wisconsin has been using and developing saturation recovery (SR) electron paramagnetic resonance (EPR) techniques. (The methodology and theory of SR was reviewed in [1–4].) In particular, these techniques have been used in studies of model and biological membranes. Introduction of the loop-gap resonator (LGR) [5] into an SR EPR spectrometer in 1986 [6] provided many benefits in comparison with the cylindrical bimodal cavity resonator, which consisted of two crossed TE112 modes [7]. The relatively low resonator quality factors, Q, and high efficiency parameters, Λ, of the LGRs were found to be highly advantageous. For model and biological membrane studies, the main benefits coming from the use of the LGR are small sample volume and short spectrometer dead time. Capabilities of the X-band SR EPR spectrometers equipped with the LGR allowed development of T1-sensitive oximetry methods, including the absolute T1 method [7–9], which have been used intensively in studies of model and biological membranes. The absolute T1 oximetry method allowed measurements of the local oxygen diffusion-concentration product at the membrane depth of the nitroxide moiety of the lipid spin label. These measurements allowed evaluation of the membrane permeability coefficient for oxygen [9]. The T1 values of spin-labeled lipids (for deoxygenated samples) provide a relative measure of membrane fluidity that complements order-parameter analysis [10, 11].
The development of the T1-sensitive SR EPR method, named “discrimination by oxygen transport (DOT) [12],” was a break-through in studies of the lateral organization of lipid bilayer membranes. This method is based on the fact that even small differences in lipid packing in coexisting domains or phases affect oxygen partitioning and oxygen diffusion, which can be easily detected by observing the different T1s from spin labels in these two locations in the presence of oxygen. SR signals in the presence of oxygen can be fitted only by a double-exponential function. The spin label alone most often cannot differentiate between these domains, giving very similar (indistinguishable) continuous wave (CW) EPR spectra and similar T1 values. The DOT approach allowed discrimination of membrane domains and membrane phases induced by the presence of Chol [13–15] as well as domains in dimyristoylphosphatidylcholine (DMPC) membranes reconstituted with bacteriorhodopsin [12]. The DOT approach was also applied to study the organization of the influenza viral membrane where protein-rich raft and bulk domains were discriminated and the lipid exchange rates between these domains were estimated [16].
In intact biological membranes that are dense with integral membrane proteins and have a high Chol content, four purported lipid domains are expected, namely bulk, boundary, and trapped lipids as well as the pure Chol bilayer domain (CBD) (Fig. 1A). In the plasma membranes of fiber cells from human and porcine eye lenses, which are dense in integral membrane proteins and have a high Chol content, we were able to discriminate only three of these domains using CW and SR EPR [17–19]. The CBD was not discriminated; even so, this domain was clearly seen in lens lipid membranes prepared from the total lipid extracted from eye lenses [19, 20]. Problems with discriminating the CBD can be related to the fact that properties of Chol-analog spin labels in the CBD are similar to those of Chol-analog spin labels in the surrounding PL bilayer. (See [14] for additional detail.)
Fig. 1.
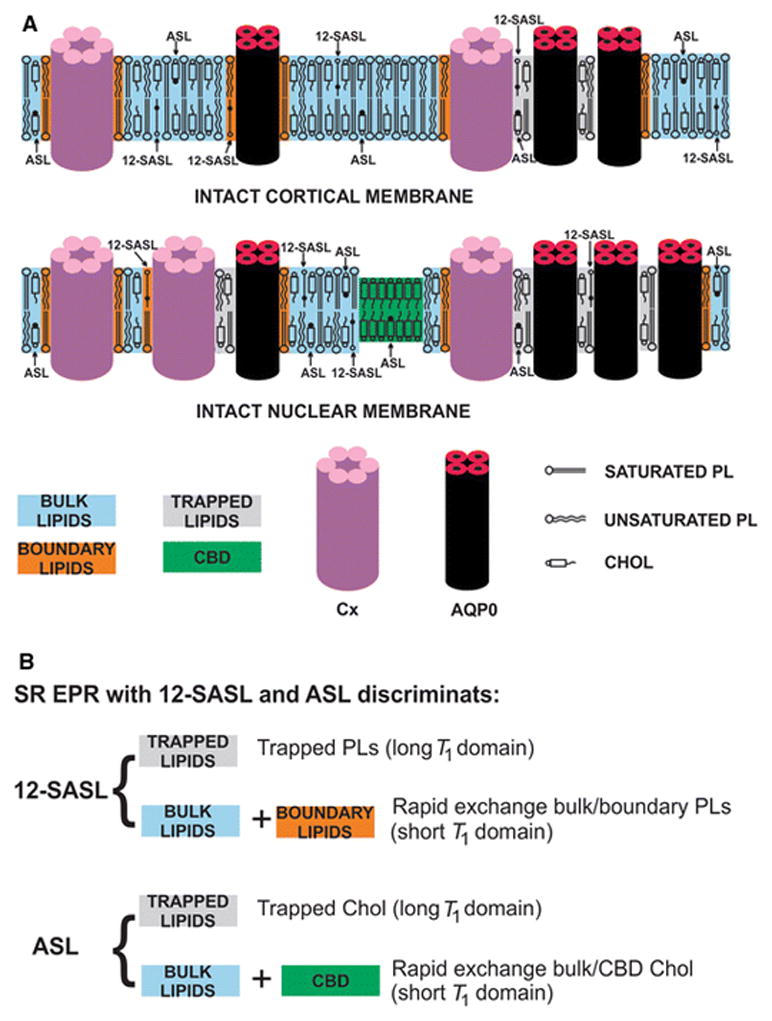
(A) Schematic drawing of the intact porcine cortical and nuclear membranes. Purported lipid domains induced by the high Chol content and the presence of integral membrane proteins (mainly connexins [Cx] and aquaporins [AQPO]) are indicated. Phospholipid spin label 12-SASL is distributed between bulk lipids, boundary lipids and trapped lipids; while Chol analog ASL is distributed between bulk and trapped lipids. (It can be also located in the CBD.) Note that Chol as well as ASL are excluded from boundary lipids. The nitroxide moieties of spin labels are indicated by black dots. (B) Lipid environments that can be discriminated using the SR EPR spin-labeling method.
Using CW EPR and PL- and Chol-analog spin labels, we were able to discriminate bulk lipids from the boundary plus trapped lipid domain in intact fiber cell plasma membranes from the eye lenses [17–19]. Surprisingly, even in the deoxygenated samples, SR signals coming from PL- and Chol-analog spin labels can be fitted only by a double-exponential function with two T1 values, indicating that spin labels are located in two distinct environments [17, 18]. In deoxygenated samples, T1 depends primarily on the rate of motion of the nitroxide moiety within the lipid bilayer [1, 10, 11, 21]. Thus, these two T1s discriminate and characterize two lipid environments in intact membranes with different membrane fluidity. PL-analog spin labels with a short T1 were assigned to a location in the rapid exchange bulk/boundary lipid domain, and those with a long T1 were assigned to a location in the trapped lipid domain [17, 18] (Fig. 1B). Because Chol and Chol-analog spin labels are substantially excluded from the boundary lipids [22, 23], the Chol-analog spin label with a short T1 is assigned to a location in the rapid exchange bulk/CBD lipid domain and that with a longer T1 is assigned to a location in the trapped lipid domain (Fig. 1B).
The methods described above allow only a qualitative description of the lateral organization of fiber cell plasma membranes. The recently developed method, which is based on the deconvolution of CW EPR spectra of PL- and Chol-analog spin labels, allows evaluation of the relative amounts of PLs in the bulk lipid domain and in the boundary plus trapped lipid domain and Chol in the bulk lipid domain plus CBD and in the trapped lipid domain [24]. Here, a method is presented based on the SR EPR spin labeling that allows quantitative evaluation of the amount of PLs in the rapid exchange bulk/boundary lipid domain and in the trapped lipid domain and Chol in the rapid exchange bulk/CBD lipid domain and in the trapped lipid domain of intact membranes. Thus, this method complements the existing one, allowing more detailed information about the distribution of lipids between domains to be obtained. Because the majority of our research focuses on eye lenses, method is illustrated for intact fiber cell plasma membranes from porcine eye lenses. (See Fig. 1 for additional explanation.)
2. Materials and Methods
2.1. Materials
Doxylstearic acid spin label (12-SASL) and spin-labeled Chol analog (androstane spin label [ASL]) were purchased from Molecular Probes (Eugene, OR). Other chemicals of at least reagent grade were purchased from Sigma-Aldrich (St. Louis, MO).
2.2. Isolation and spin labeling of intact membranes
These procedures used here are the same as those described previously [24]. Cortical and nuclear intact membranes were isolated separately from the tissue of eight porcine lenses from two-year-old animals. As discussed previously, spin-labeled membrane suspensions were transferred to a 0.6 mm i.d. capillary made of gas-permeable methylpentene polymer (TPX) and used for SR EPR measurements [25].
2.3. SR measurements
To further increase the signal-to-noise ratio, samples in TPX capillaries were centrifuged as described in [25]. Samples were thoroughly deoxygenated directly in the resonator with nitrogen, which was also used for temperature control. All measurements were carried out at 37°C. SR EPR signals were obtained at X-band on a home-built spectrometer with the LGR. The basic microwave circuit is a simplified version of that described in [26].
Two major hardware improvements were made on the apparatus used to acquire the data presented in this paper. The coil driver amplifier used to perform on/off-line EPR field jumping in the signal differencing mode was replaced, and the pump arm in the SR bridge was upgraded. The PIN switch used to create the pump pulses in the pump arm was replaced with a higher isolation model. The previous PIN switch unit (American Microwave Frederick, MD), model SW-2184-1A, was replaced with a Kratos Defense and Security Solutions, Inc. (Syosset, NY), model F9114A. The new unit exhibits a very clean switching characteristic with less than 100 mV of video leakage in the output. The unit also switches very quickly and has off-to-on and onto-off transition times of less than 2 ns. The switch isolation of the F9114A in the off mode is 85 dB, which is 20 dB better than the previous switch. In order to provide more saturating pump power to the sample, the pump arm power amplifier was replaced with a new power amplifier. The new amplifier is a Ciao Wireless, Inc. (Camarillo, CA), model CA810-4413-1. The amplifier has a +33 dBm output at the 1 dB gain compression point. It is configured in the system to provide +30 dBm (1 W) at the coaxial input to the LGR at a pump attenuator setting of 0 dB. The pump arm in the SR system is now capable of delivering a pulse width as narrow as 10 ns at a 1 W power level to the LGR. The availability of this level of pump power ensures saturation of the sample with the narrow pump pulse widths needed to detect the faster components present in multiexponential signals.
On/off-line field differencing is a strategy used to improve the baseline of SR signals. In this operational mode, on-line EPR SR signals are averaged, and then the average of an equal number of off-line signals is subtracted from the on-line signal average. On- and off-line field jumping can be provided by the main magnet field control system, or through a set of modulation coils also used for the EPR setup. The modulation coil jumping is faster, reducing the total runtime of the experiment. However, due to limitations of the field modulation amplifier in the system, the coil jumps previously were limited to less than 15 G. The new amplifier can provide up to ±3 amperes for 34 G peak-to-peak field modulation amplitude at the sample for larger jumps. The current-sense feedback in the amplifier results in a faster response time through the coil. (The field jumps can occur in less than 200 μs at the full 34 G amplitude.) The field amplitude is sufficient to jump completely off the low field line of the nitroxide in a downfield direction to ensure full subtraction of instrumental artifacts from magnetic resonance. New software allows use of the computer to set the square wave field modulation amplitude. The field jumping is synchronized in the software with the bi-phase modulation of the pump microwaves. The phase modulation in the pump arm is used to suppress the free induction decay (FID) component in the resultant pulse signal. When these improvements were implemented in the SR system, it was found that the receiver dead time after the pump pulse was reduced to 100 ns from the previous value of 300 ns. This is the receiver delay or blanking time required to protect the receiver from the effects of the saturating pump pulse. This reduction greatly aids data analysis of signals with double-exponential content, particularly when fitting signals containing faster components.
The spin-lattice relaxation times, T1s, of spin labels were determined by analyzing the SR signals of the most intensive central line obtained by short-pulse (300 ns) experiments [9, 16, 27]. Typically, 105–106 decays were acquired with 2,048 data points on each decay and a 20 ns time increment. The total accumulation time was about 1 min. SR signals were fitted by single- and double-exponential functions. In the data presented in this paper, double (but not single) exponential fits were always required with decay times greater than 2 μs. The uncertainties in the measurements of decay time from the fits were usually less than 0.05%, whereas the decay times determined from sample to sample were within a precision of ±5% and ±10% for longer and shorter recovery time constants. When necessary, the CW EPR spectra were recorded with a Bruker EMX spectrometer equipped with temperature-control accessories.
2.4. Statistical analysis
The Student’s t-test was used to determine the significance of experimental differences. P ≤ 0.05 was considered to be statistically significant.
3. Results and Discussion
Figure 1 shows a schematic drawing of the intact porcine cortical and nuclear membranes illustrating the presence of the purported lipid domains induced by high Chol content and the presence of integral membrane proteins. This figure is a guideline, providing a clear understanding of the present experimental results and our interpretation of the data. The bulk lipid domain is formed by the part of the lipid bilayer that is not affected by the presence of integral membrane proteins, and it has the same (or almost the same) properties as a lipid bilayer membrane formed from the total lipid extract from the intact membrane. The boundary lipid domain around integral membrane proteins is formed by protein-bound, immobilized PLs [28], and the exchange rate between boundary and bulk lipids is of the order of magnitude of 107 s−1 or greater [29–31]. The trapped lipid domain is formed by lipids in contact with two proteins and/or by lipids in contact with proteins and boundary lipids [12]. The exchange rate with other domains is of the order of magnitude of 105 s−1 or less [16]. The CBD is a highly fluid pure Chol bilayer immersed in the bulk lipids [14, 32, 33]. Figure 1 in Ref. [24] depicts chemical structures of the spin labels used in these experiments and their approximate locations and orientations in the lipid bilayer.
3.1. Optimization of spectrometer parameters
Two main spectrometer parameters can significantly affect SR measurements, the pump power and the observing power. This is especially significant when two-component SR signals are observed giving two T1 values and two pre-exponential coefficient values in one experiment. First, the pump power must be high enough to saturate both signals; it really must be a saturating power. Second, the observing power should be small enough that it will not induce an artifactual shortening of both T1s. These optimizations were performed for both samples, namely for cortical and nuclear intact fiber cell plasma membranes from porcine eye lenses, and for both spin labels, namely 12-SASL and ASL.
To ensure that we are using a saturating pump power, SR signals were recorded as a function of increasing pump power. In Fig. 2, the amplitude of the SR signal is plotted as a function of the pump power, indicating that a pump power greater than +27 dBm and +24 dBm for 12-SASL and ASL, respectively, substantially saturates the SR signal. To ensure that both components of the SR signals (with different T1 values) are saturated, we also plotted the pre-exponential coefficients of both SR signals, which were obtained after fitting experimental signals to double exponentials as a function of the pump power. Results for 12-SASL (Fig. 3A) and ASL (Fig. 3B) indicate that the available pump power is high enough to saturate both components with shorter and longer T1s for both spin labels. During these experiments, all other spectrometer parameters and recording parameters were kept constant (the observing power was set to −12 dBm and the number of points removed before final fitting was set to 30) to ensure that only the effects of pump power were evaluated. Figures 2 and 3 present the results obtained for nuclear membranes. Similar plots were also obtained for cortical membranes (data not shown), confirming that, for these samples too, the available pump power is high enough to saturate both components in the SR signals from 12-SASL and ASL. In further experiments, we used the maximal available pump power, namely +30 dBm (1 W). Before the implementation of the improvements in the SR system, the available pump power was half of that, namely 0.5 W. To ensure that we can compare previous T1 measurements with new measurements, we performed T1 measurements at full available pump power (1 W) and at half pump power (0.5 W). Data for cortical and nuclear fiber cell membranes and for both spin labels are listed in the Table 1. As expected, the pump power did not affect the measured T1 values.
Fig. 2.
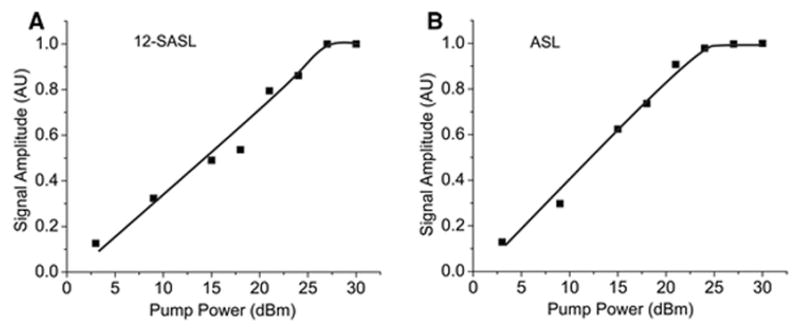
Plot of the amplitude of the recorded SR EPR signal versus pump power for 12-SASL and ASL in nuclear fiber cell plasma membranes from porcine eye lenses.
Fig. 3.
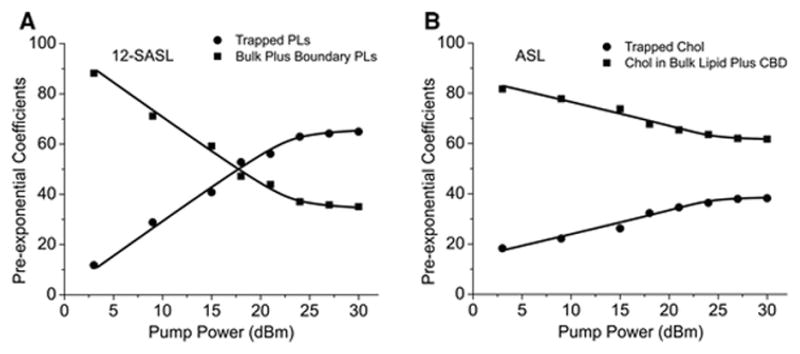
Plot of pre-exponential coefficients (% of the total SR signal amplitude) versus pump power for each component of the recorded SR signal of 12-SASL and ASL in nuclear fiber cell plasma membranes from porcine eye lenses.
Table 1.
T1s (means and standard deviations) obtained with double exponential fits of SR signals for 12-SASL and ASL in porcine lens cortical and nuclear membranes.
| Pump power | T1 (12-SASL) | T1 (ASL) | ||
|---|---|---|---|---|
| Cortex | Cortex | |||
| 1 W | 5.15 ± 0.62 μs | 3.0 ± 0.51 μs | 5.23±0.38 μs | 2.20±0.10 μs |
| 0.5 W | 5.25 ± 0.68 μs | 3.1 ± 0.47 μs | 5.16±0.40 μs | 2.23±0.10 μs |
| Nucleus | Nucleus | |||
| 1 W | 6.15 ± 0.30 μs | 2.44 ± 0.47 μs | 6.86±0.20 μs | 2.25±0.12 μs |
| 0.5 W | 5.96 ± 0.21 μs | 2.20 ± 0.24μs | 6.68±0.21 μs | 2.0±0.09 μs |
In similar experiments, we established that the observing power of −12 dBm is low enough that it does not affect the measured T1 values. Figure 4 presents the results for both spin labels (12-SASL and ASL in intact nuclear fiber cell plasma membranes from porcine eye lenses), which indicate that, for a wide range of observing power (from −20 up to −8 dBm), the T1 values of both components of the SR signals measured at the saturating pump power (+30 dBm) are constant. We chose a rather high observing power of −12 dBm to increase the signal-to-noise ratio. The observed independencies of T1 on observing power are characteristic of broad spin-label signals with short T2 values. Similar results were obtained for 12-SASL and ASL in intact cortical fiber cell plasma membranes from porcine eye lenses, indicating that the T1s do not change in the wide range of observing power (from −20 to −8 dBm) for these samples either.
Fig. 4.
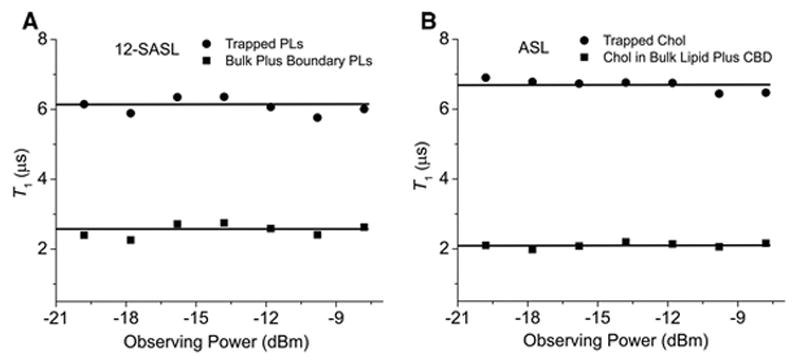
Plot of T1 values versus observing power for each component of the recorded SR signal of 12-SASL and ASL in nuclear fiber cell plasma membranes from porcine eye lenses. As was emphasized by Percival and Hyde [43], in SR experiments the condition γe2B12T1T2 ≪ 1 should be satisfactory. Otherwise, T1 will be decreased from its true value. Here, γe is the gyromagnetic ratio for the electron, and B1 is the amplitude of the observed microwave magnetic field. Data reported here satisfy this condition for the wide range of observing power (from −20 up to −8 dBm). In further experiments, we chose −12 dBm as an observing power.
3.2. Optimization of recording conditions
Optimal recording conditions for SR signals depend on the problem that must be solved. If the SR signals have one component (experimental data are fitted to a single exponential), the most reliable results are obtained by using long-pulse widths on the order of T1s [7]. These conditions ensure maximal saturation of the signal and minimal contribution of alternate relaxation pathways. Although use of long pump pulses maximizes the SR signal amplitude, it should be noted that it is not required for correct T1 measurements. If the SR signals have two components, short-pulse experiments are preferred [9, 16, 27]. This condition minimizes the cross-relaxation between components but does not affect obtained T1 values. Short-pulse experiments were performed to discriminate membrane domains. These experiments were qualitative but allowed determination of relevant T1 values in short-pulse experiments. Not too much attention was paid to the pre-exponential coefficients in double-exponential SR signals.
The present SR approach is based on the pre-exponential coefficient measurements for both components in the SR signals (see Sect. 3.4), and these pre-exponential coefficients must be estimated just after the end of the saturating pulse. To increase the accuracy of these measurements, the delay time—which allows safe recording of the SR signal after the saturating pump pulse—must be as short as possible. The SR spectrometer improvements described in Sect. 2.3 allowed the receiver delay time to be decreased to 100 ns. However, additional points must be removed from the dataset post-acquisition to ensure a reliable fit for data containing double exponentials. Thus, the strategy in recording the SR signals is to begin recording just after the receiver delay time, with all 2048 points in the dataset. A double-exponential fit is performed on the initial dataset and the results of the fit recorded. The beginning points of the dataset are then removed, and the resultant dataset is again fit for two exponentials. The results of the second fit are recorded again, several more points are removed from the dataset, the data fit is repeated, and the results are compared to those of the previous fits. This process is repeated, removing, fitting, and comparing with the previous fit results until the T1 values obtained from the fitting of both components in the set converge to constant values independent of further point removal. This optimization was performed for both spin labels. Data presented in Fig. 5 include measurements for nuclear membranes. It was found that reliable fits were obtained with the removal of typically 30 points from the beginning of the 2048 dataset. Similar measurements were performed for cortical membranes with similar conclusions (data not shown). Of course, the number of points that should be removed depends on the time increment between points. In all measurements reported in this paper, a sample interval of 20 ns was used, and fits were performed with the removal of 30 points from the beginning of the dataset.
Fig. 5.
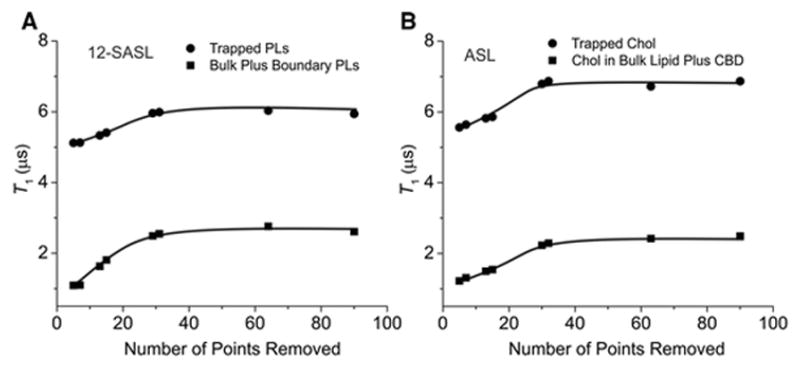
Plot of T1 values obtained from fitting the recorded SR signal to the double-exponential function versus the number of points removed at the beginning of the recorded signal before running the fitting program. Data obtained for 12-SASL and ASL in nuclear fiber cell plasma membranes from porcine eye lenses. Reliable fits to two exponential functions were obtained by removing 30 points or more from the beginning of the recorded signal. Data presented in this figure indicate that in the investigated systems, other relaxation processes exist that shortened the two measured T1 values. These processes ended after about 700 ns, when the measured T1s converged to constant values.
For studies with model membranes, T1s vary from 1 to 10 μs, and the correlation times of the spin labels located at different depths are in the range of 1–25 ns [10, 11]. For all of these cases, we observed single exponential SR signals. For these rates of motion, the spin label nuclear relaxation time is of the order of 100 ns [1]. Both processes contribute to the spectral diffusion because they transfer saturation to different regions of the spectrum [34, 35]. Because the characteristic times of these processes are two to three orders of magnitude faster than T1s of membrane-located spin labels, these processes should be completed during the saturating pump pulse (300 ns) and during the delay time after the end of the saturating pump pulse (700 ns). They should not contribute significantly to the SR signal. Our control experiments, to a certain degree of confidence, allow us to extend these assumptions also to measurements with biological membranes at 37°C. However, data presented in Fig. 5 indicate that other processes exist which artificially shortened T1s at the beginning of the recorded SR signal (before the 30 beginning points are removed). These processes can be related to additional, yet undefined, relaxations characterizing investigated systems (see Sect. 3.3).
3.3. In intact membranes, SR signals from 12-SASL and ASL can be fitted with only double exponentials
All lipid spin labels that can be incorporated into the intact cortical and nuclear fiber cell plasma membranes (n-PC and ASL) of human and animal eye lenses show two-component SR signals (can be fitted by a double exponential function) [17, 18]. In further measurements based on the deconvolution of CW EPR spectra for the evaluation of amounts of lipids in membrane domains, we selected 12-SASL (to quantify PLs) and ASL (to quantify Chol) [24].
Representative SR signals for PL- (12-SASL) and Chol-analog (ASL) spin labels in intact nuclear fiber cell membranes are shown in Fig. 6. Both SR signals are successfully fit only with double-exponential functions. SR signals from 12-SASL and ASL applied to intact cortical membranes can also be fitted satisfactory with only two exponentials (signals not shown). This indicates that two lipid environments with different fluidities are detected in the lipid bilayer portion of the intact fiber cell plasma membranes, both with 12-SASL and ASL. It should be noted once more that all experiments were performed for deoxygenated samples.
Fig. 6.
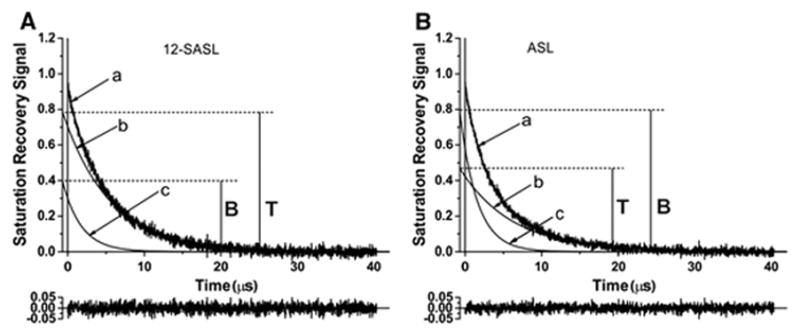
Representative SR signals of 12-SASL and ASL in deoxygenated nuclear fiber cell plasma membranes from porcine eye lenses recorded with 30 points removed from the beginning of the dataset (a). These signals can be successfully fitted with only a double-exponential function with time constants of 6.15 ± 0.30 μs (b) and 2.44 ± 0.47 μs (c) for 12-SASL and with time constants of 6.86 ± 0.2 μs (b) and 2.25 ± 0.12 μs (c) for ASL. The residual, shown at the bottom, indicates the goodness of the fit. The contribution of each component to the experimental signal is given by the pre-exponential coefficients obtained from the fitting program. Because the SR signal is recorded with an instrumental delay (in this case 0.1 μs) after the end of the saturating pulse and because of the delay in the applying the fitting program (in our case 0.6 μs), the exponentials for (b) and (c) components have to be extrapolated back (in our case 0.7 μs) to get the actual ratio of their pre-exponential coefficients T/B. In Fig. 6A, (c) signal coming from the bulk plus boundary PLs and (b) signal coming from the trapped PLs is presented. In Fig. 6B, (c) signal coming from the bulk plus CBD Chol and (b) signal coming from the trapped Chol is presented.
The PL-analog spin label (12-SASL) can be located in the bulk, boundary, and trapped lipid domains. However, when the exchange rate of lipids (spin labels) between coexisting domains is greater than the T1−1, we measure an averaged T1−1, and domains cannot be discriminated using the SR approach. This is the case for bulk and boundary lipid domains that cannot be discriminated using the SR spin-labeling method. The lipid exchange rate between these domains is too fast (107 s−1 or greater [29–31]) when compared with the spin-lattice relaxation rate of lipid spin labels in membranes between 105 and 106 s−1 (T1 from 1 to 10 μs). Thus, the SR EPR approach with 12-SASL can discriminate the rapid exchange bulk/boundary lipid domain from the trapped lipid domain. The CW EPR approach with 12-SASL can discriminate the bulk lipid domain from the boundary plus trapped lipid domain [17, 18, 24]. Thus, both approaches complement each other.
The Chol-analog spin label (ASL), in principle, can be located in all purported lipid domains of intact fiber cell plasma membranes. Here too, some restrictions should be applied. Because Chol molecules (and Chol-analog spin labels) are substantially excluded from the boundary lipids [22, 23], this domain would not be considered as a place where ASL (and Chol molecules) would be located. The spin-lattice relaxation time alone also cannot discriminate between the bulk domain and the CBD because the fluidity of these domains (dynamics of Chol molecules [14, 33]) is similar, giving similar T1 values of ASL. Thus, the SR EPR approach with ASL can discriminate only the rapid exchange bulk/CBD lipid domain from the trapped lipid domain. Because ASL is not located in the boundary domain, the CW EPR approach with ASL also discriminates Chol located in the same domains, namely the rapid exchange bulk/CBD lipid domain from the trapped lipid domain [17, 18, 24].
The statement that SR signals from 12-SASL and ASL can be fitted only with double exponentials in intact membranes is only true when the optimized spectrometer parameters and recording conditions are used (see Sects. 3.1 and 3.2). As indicated at the end of Sect.3.2 (also see Fig. 5), other processes shortened measured two T1 values. They ended after about 700 ns (delay time of 100 ns plus time of 30 removed points – 600 ns) when measured T1s converge to constant values independent of further point removal. Thus, these two T1s are real characteristics of the investigated system and should characterize relaxation processes of the spin labels after the end of the saturating pulse (independent of the number of points cut). Thus, these two T1 values can be fixed, allowing SR signals to be fit to three exponentials just after the end of the delay time. We did so for both 12-SASL and ASL with only the five first points removed. (The beginning of the recording always contains some unpredictable processes connected with switches.) Results for nuclear fiber cell membranes are presented in Fig. 7. As shown by the residual and standard deviations of T1 values for the third exponential, the fits are very good. Also, their contributions to SR signals (at the moment of the recording, 200 ns after the end of the saturating pulse) are about 10%. As expected, the characteristic decay time of the third exponential is much shorter than measured T1s for 12-SASL and ASL. The short values of these T1s suggest the presence of paramagnetic metal ions (relaxation agents) bound to integral membrane proteins, which can shorten relaxation times of spin labels in their close proximity. In preparing the intact membranes, we did not control the presence (or absence) of paramagnetic metal ions. We will refrain from further discussing the possible mechanisms of these processes; however, we could reliably fit our data to three exponentials. We will return to this problem in our future works, by controlling the presence of paramagnetic metal ions in intact membranes or/and by the comparing results with those obtained for appropriate model systems.
Fig. 7.
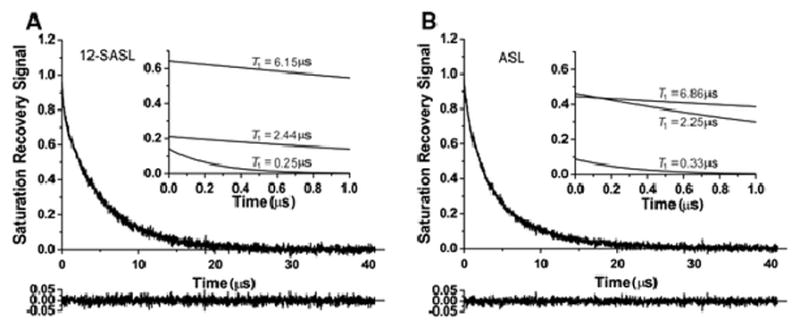
SR signals with fitted curves and residuals (the experimental signal minus the fitted curve) for 12-SASL and ASL in deoxygenated nuclear fiber cell plasma membranes from porcine eye lenses. Signals were fitted successfully with a triple-exponential function with only five points removed at the beginning of the dataset and two time constants taken from Fig. 6 and fixed (6.15 μs and 2.44 μs for 12-SASL and 6.86 μs and 2.25 μs for ASL). The third-time constant obtained from the fitting program was 0.25 ± 0.03 μs for 12-SASL and 0.33 ± 0.04 μs for ASL. The contributions of the third component to the experimental signal given by the pre-exponential coefficient were 14.3% and 8.8% for 12-SASL and ASL, respectively. The residual, shown at the bottom, indicates the goodness of the fit. The inserts show the courses of the three fitted curves during the first 1 μs of the SR signal. The contribution of the fast, third component to the analysis of the data (after 0.7 μs) can be neglected.
3.4. Pre-exponential coefficients
By fitting the SR signal of a certain spin label to the double-exponential curve, three parameters can be extracted, namely two rate constants and the ratio of the pre-exponential coefficients of both fractions of the spin labels located in different environments. In our case (deoxygenated samples without any other relaxation agents), these two rate constants describe pure spin-lattice relaxation processes for spin label fractions in both discriminated environments (by spin-lattice relaxation times, T1s, or spin-lattice relaxation rates, T1−1s). These parameters are a good description of the properties (fluidities) of discriminated domains and are used in many SR EPR spin labeling approaches applied to membrane research [36, 37]. We refer to all of these approaches as qualitative SR EPR approaches. They give significant information about the lateral organization of model and biological membranes as well as about the changes of membrane properties with membrane depth [12, 13]. In some restricted conditions, information about the size of the discriminated domains can be obtained [16]. However, quantification of these domains with only those parameters is not possible.
The contribution of each component to the experimental SR EPR signal is given by the pre-exponential coefficients obtained from the fitting program. The new SR EPR approach is based on the analysis of pre-exponential coefficients form the foundation of the quantitative SR EPR that we developed here and are using to quantify the amounts of lipids in domains discriminated in intact fiber cell plasma membranes of eye lenses. Based on the SR EPR signal of 12-SASL (Fig. 6A), we evaluated the relative amounts of PLs in the rapid exchange bulk/boundary lipid domain and in the trapped lipid domain. The relative distribution of Chol is indicated by the distribution of a Chol-analog spin label ASL. The SR EPR signal of ASL in nuclear fiber cell membranes is shown in Fig. 6B. Using ASL, we evaluated the relative amounts of Chol in the rapid exchange bulk/CBD lipid domain and in the trapped lipid domain.
To evaluate the relative amounts of lipids in distinct membrane domains, corrections of the ratios of pre-exponential coefficients obtained from fitting the SR signals to the double-exponential curves have to be performed. Because the SR signal was recorded with a delay after the end of the saturating pulse (coming from the spectrometer setup [Sect. 2.3.] and from removing the beginning of the recorded SR signal [Sect. 3.2.]), the exponentials for each component have to be extrapolated back to get the actual ratio of their pre-exponential coefficients just after the end of the saturating pulse. As discussed in Sect. 3.1, both components were saturated. This procedure is illustrated in Fig. 6A for 12-SASL and in Fig. 6B for ASL.
The deconvolution of CW EPR spectra of 12-SASL and ASL in intact porcine fiber cell membranes into their components were performed earlier [24]. Component spectra for ASL come from bulk lipids plus purported CBD (fast motion spectrum) and trapped lipids (very slow motion spectrum). The same assignment was for the short and the long T1 component of the SR signal. Thus, the transformation of the SR data to the final amounts of ASL (Chol) in discriminated environments is straightforward because components of absorption spectra (T0/B0 in Fig. 8B) and components of SR signals (T/B in Fig. 6B) are coming from the same environments. Components of CW spectrum for 12-SASL are coming from bulk lipids (fast motion spectrum) and boundary plus trapped lipids (very slow motion spectrum with overlapping (not distinguished) components from boundary and trapped lipids). However, the assignment for the short and the long T1 component of the SR signal is different. The short T1 component is assigned to 12-SASL located in the rapid exchange bulk/boundary lipid domain and the long T1 component to 12-SASL located in trapped lipids. Because we do not know proportions of the bulk and boundary lipids in the rapid exchange bulk/boundary lipid domain discriminated by SR method we can make only evaluations of the amount of 12-SASL (PLs) for two extreme cases assuming that only bulk lipids or only boundary lipids are present in the discriminated domain. In the former case the ratio of T0/B0, as indicated in Fig. 8A, can be used. In the latter case both components (boundary lipids and trapped lipids) exhibit similar absorption spectra with the ratio of amplitude equal to 1. In that case the ratio of pre-exponential coefficients gives directly the ratio of amounts of PLs in discriminated domains. The true values should lie between these two evaluations indicated in black and red in Fig. 8A.
Fig. 8.
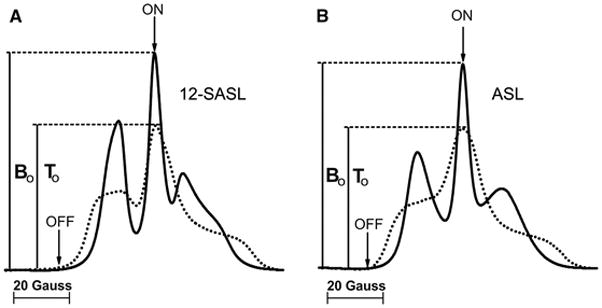
EPR absorption spectra of 12-SASL and ASL in deoxygenated nuclear fiber cell plasma membranes from porcine eye lenses. In Fig. 8A, the solid line shows the spectrum coming from 12-SASL in the bulk lipid domain and the dotted line shows the spectrum coming from 12-SASL in the boundary plus trapped lipid domain. In Fig. 8B, the solid line shows the spectrum coming from ASL in the bulk plus CBD and the dotted line shows the spectrum coming from ASL in the trapped lipid domain. In both cases, spectra were recorded for the same spin label amounts (concentration) in both environments. (The areas under both absorption spectra are the same.) The ratio of amplitudes of absorption EPR spectra from the same spin label amounts T0/B0 is used for the correction of data obtained from SR as the ratio of pre-exponential coefficients T/B. With that correction (based on Figs. 6A and 8A), the amount of PLs in the trapped lipid domain (% of total PLs) equals {(TB0/BT0)/(1+ TB0/BT0)}(100%). Similarly (based on Figs. 6B and 8B), the amount of Chol in the trapped lipid domain (% of total Chol) equals {(TB0/BT0)/(1+ TB0/BT0)}(100%). In SR experiments, a saturating microwave pump pulse located at the field position of maximum intensity in the EPR absorption spectrum (ON) saturates the spin system and, thus, the EPR absorption signal amplitude is zero. The recovery of the signal to the Boltzmann equilibrium is detected at the same field position with a low observing power. Positions of the on- and off-line field jumping points, used to improve the baseline of the SR signals, are indicated as ON and OFF.
3.5. Amounts of PLs (% of total PLs) and Chol (% of total Chol) in lipid domains of intact membranes
With all these optimizations (described in Sects. 3.1. and 3.2.) and corrections (described in Sect. 3.4.), we finally were able to evaluate the relative amounts of both PL (from 12-SASL data) and Chol (from ASL data) in discriminated domains. The results are expressed as the % of total PLs (Fig. 9A) and the % of total Chol (Fig. 9B) for PL and Chol, respectively, in trapped lipid domains of porcine cortical and nuclear fiber cell plasma membranes. To perform the statistical analysis, results were obtained for independently isolated cortical and nuclear membranes from eight porcine lenses. Isolation was performed separately for each lens. We assume that the sample-to-sample differences due to the animals’ age (two years old) and the environmental conditions in which they were raised are minimal, because they all were obtained from the same meat factory. Thus, the scattering of data (indicated in Fig. 9 as separate points) can be attributed only to preparation/technique-related changes.
Fig. 9.
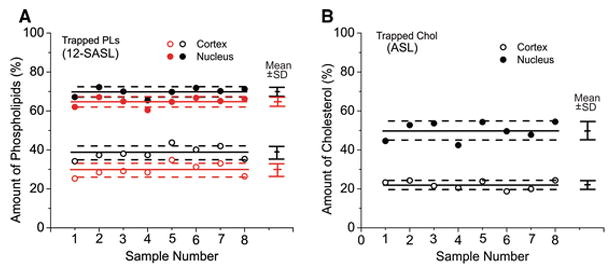
Amounts of PLs (A, % of total PLs) and Chol (B, % of total Chol) in the trapped lipid domain uniquely formed due to the presence of membrane proteins in intact cortical (open symbols) and nuclear (filled symbols) lens membranes obtained separately from eight porcine lens. Mean values (Mean) and standard deviations (SD) for each group are indicated as solid lines and bars, respectively. Broken lines indicate the interval around mean values outside of which the differences between means are statistically significant (P ≤ 0.05). These results were obtained based on the analysis of SR signals for 12-SASL and ASL as indicated in Figs. 6A and 6B, respectively. Transformation of the data from the ratio of pre-exponential coefficients to the ratio of amounts of PLs and Chol was performed as described in Figs. 8A and 8B, respectively. In A, results in black are evaluated with the assumption that short T1 component in the SR signal of 12-SASL is coming exclusively from bulk lipids and results in rad are evaluated with the assumption that the short T1 component is coming exclusively from boundary lipids.
Mean values and standard deviations (indicated in Fig. 9 by bars) for measured amounts of PLs and Chol in trapped lipid domains of intact cortical and nuclear fiber cell plasma membranes from porcine eye lenses are presented in Figs. 9A and 9B, respectively. Statistical analysis (Student’s t-test) of the data allowed determination of the separations of mean values above which differences can be treated as statistically significant (P ≤ 0.05) and can be attributed to sources other than preparation/technique. The amounts of PLs in trapped domains have to be separated by 3.45% in cortical membranes and 3.33% in nuclear membranes, and the amounts of Chol in trapped domains by 3.45% in cortical membranes and 3.33% in nuclear membranes to be considered statistically significant. These separations are indicated by broken lines in Fig. 9. It can be immediately seen that differences between cortical and nuclear membranes are statistically significant. This makes sense because membranes of the lens nucleus contain more integral membrane proteins and because, in aged fiber cells, these proteins form aggregates and arrays that should enhance the amounts of trapped lipids. Also, the presence of the purported CBD in nuclear fiber cell porcine membranes and its absence in cortical porcine membranes (see [19]) can explain the greater relative amount of PL than Chol in trapped lipid domains. Some amount of Chol molecules in nuclear membranes should form CBDs, decreasing the relative amount of Chol in other domains.
For human single lenses, we are not able to separate sample-to-sample changes coming from preparation/technique factors from those connected with health history of donors. All preparation and measurement procedures are the same for porcine and human lenses and we assumed that scattering of the data coming from preparation/technical factors should be the same. Because of that the differences defined for porcine lenses will be used for comparison of amounts of lipids in domains in human lens membranes prepared from eyes of single lens. Greater separations will indicate that differences were statistically significant with (P ≤ 0.05) and that they do not come from preparation/technique sources.
4. Concluding Remarks
We would like to comment about future directions in the development of the T1-sensitive SR EPR spin-labeling approaches at the National Biomedical EPR Center. It was shown that T1s of lipid-type spin labels in membranes increase when the microwave frequency increases from 2 to 35 GHz [38]. The T1s measured at W-band (94 GHz), however, were shorter than when measured at Q-band (35 GHz) [39, 40], which is an anomalous result requiring further research. It is concluded that the longest T1 values generally will be found at Q-band, noting that long values are advantageous for measurements using T1-sensitive EPR techniques, although W-band has its own advantages over other frequencies. The new capabilities in measuring T1 values using SR EPR at Q- and W-band have been demonstrated in model membranes with the use of PL- and Chol-analog spin labels and compared with results obtained earlier at X-band [10, 40–42].
First, T1-sensitive SR EPR spin-labeling approaches at Q- and W-band have the potential to be a powerful tool for studying small-volume samples (reported sample volumes at Q- and W-band range from 30 to 150 nL, compared with typical LGR sample volumes of 3 μL at X-band). Other beneficial factors include a higher resonator efficiency parameter Λ (the Λ is between 10 and 20 for Q- and W-band LGRs) and low resonator quality factor Q. (The LGR with a water sample has a loaded Q factor of approximately 100.) One significant consequence of high Λ and low resonator Q is that the dead time between the end of the pulse and the start of data collection can be reduced because there is less stored energy in the resonator when the pulse ends. Shortening the dead time is crucial for discriminating membrane domains and should allow for the discrimination of domains with high lipid exchange rates. Also, the accuracy of the measurements of the contribution of each pre-exponential coefficient to the recorded SR signal amplitude should be significantly improved.
Very significant, especially for the transition of the qualitative SR to the quantitative, is a new technique for canceling FID contamination, which was introduced for Q-band SR [38] and has been extended to W-band [39]. As practiced in this laboratory, at X-band, the pump and observing powers are derived from the same source, and signals are a superposition of FID and SR responses. The technique of 180° pump-phase modulation, which modulates the signal of the FID response but not that of the SR response, permits separation of the superimposed signals. In Q- and W-band spectrometers, the pump and observing powers are derived from separate synthesizers. The synthesizers are phase-locked, but the pump synthesizer is offset from the observe by a small frequency difference, typically 1 kHz. A benefit of this method is that the two frequencies are well within the spin packet width but cannot drift with respect to each other. With the pump and observed frequencies separated by this difference, FID signals are effectively averaged away, leaving only the SR signal.
In the present paper, we wanted to achieve two major goals. First, we wanted to develop a new SR EPR spin-labeling method for the quantification of membrane domains in intact membranes. Second, we wanted to indicate separations of the amounts above which differences can be treated as statistically significant (P ≤ 0.05) and are due to sources other than preparation/technique. We think that we successfully achieved both of these goals, illustrating the abilities of the method for intact fiber cell plasma membranes isolated from single porcine eye lenses. The individual (single donor or single lens) experimental approach is critical for investigating properties of human lenses, because the health history of the donor is a major factor in data analysis. Also, for this type of study, it is necessary to separate age/cataract-related changes from preparation/technique-related changes. In the future, we will use this method to compare the amounts of lipids in domains in human lens membranes prepared from the eyes of single donors and from single lenses.
Acknowledgments
This work was supported by grants EY015526, EB001980, and EY001931 from the National Institutes of Health, USA.
References
- 1.Robinson BH, Haas DA, Mailer C. Science. 1994;263:490–493. doi: 10.1126/science.8290958. [DOI] [PubMed] [Google Scholar]
- 2.Hyde JS. In: Frontiers in Modern EPR. Eaton GR, Eaton SS, Salikhov KM, editors. World Science; Singapore: 1998. pp. 607–618. [Google Scholar]
- 3.Eaton SS, Eaton GR. Biol Magn Reson. 2005;24:3–18. [Google Scholar]
- 4.Yang Z, Bridges M, Lerch MT, Altenbach C, Hubbell WL. Methods Enzymol. 2015;564:3–27. doi: 10.1016/bs.mie.2015.07.016. [DOI] [PubMed] [Google Scholar]
- 5.Hyde JS, Froncisz W. J Magn Reson. 1982;47:515–521. [Google Scholar]
- 6.Prabhananda BS, Hyde JS. J Chem Phys. 1986;85:6705–6712. [Google Scholar]
- 7.Kusumi A, Subczynski WK, Hyde JS. Proc Natl Acad Sci USA. 1982;79:1854–1858. doi: 10.1073/pnas.79.6.1854. [DOI] [PMC free article] [PubMed] [Google Scholar]
- 8.Yin JJ, Hyde JS. Z Phys Chem. 1987;153:57–65. [Google Scholar]
- 9.Subczynski WK, Hyde JS, Kusumi A. Proc Natl Acad Sci USA. 1989;86:4474–4478. doi: 10.1073/pnas.86.12.4474. [DOI] [PMC free article] [PubMed] [Google Scholar]
- 10.Mainali L, Hyde JS, Subczynski WK. J Magn Reson. 2013;226:35–44. doi: 10.1016/j.jmr.2012.11.001. [DOI] [PMC free article] [PubMed] [Google Scholar]
- 11.Mainali L, Feix JB, Hyde JS, Subczynski WK. J Magn Reson. 2011;212:418–425. doi: 10.1016/j.jmr.2011.07.022. [DOI] [PMC free article] [PubMed] [Google Scholar]
- 12.Ashikawa I, Yin JJ, Subczynski WK, Kouyama T, Hyde JS, Kusumi A. Biochemistry. 1994;33:4947–4952. doi: 10.1021/bi00182a025. [DOI] [PubMed] [Google Scholar]
- 13.Subczynski WK, Wisniewska A, Hyde JS, Kusumi A. Biophys J. 2007;92:1573–1584. doi: 10.1529/biophysj.106.097568. [DOI] [PMC free article] [PubMed] [Google Scholar]
- 14.Raguz M, Mainali L, Widomska J, Subczynski WK. Chem Phys Lipids. 2011;164:819–829. doi: 10.1016/j.chemphyslip.2011.08.001. [DOI] [PMC free article] [PubMed] [Google Scholar]
- 15.Mainali L, Raguz M, Subczynski WK. J Phys Chem B. 2013;117:8994–9003. doi: 10.1021/jp402394m. [DOI] [PMC free article] [PubMed] [Google Scholar]
- 16.Kawasaki K, Yin JJ, Subczynski WK, Hyde JS, Kusumi A. Biophys J. 2001;80:738–748. doi: 10.1016/S0006-3495(01)76053-5. [DOI] [PMC free article] [PubMed] [Google Scholar]
- 17.Raguz M, Mainali L, O’Brien WJ, Subczynski WK. Exp Eye Res. 2015;132:78–90. doi: 10.1016/j.exer.2015.01.018. [DOI] [PMC free article] [PubMed] [Google Scholar]
- 18.Raguz M, Mainali L, O’Brien WJ, Subczynski WK. Exp Eye Res. 2014;120:138–151. doi: 10.1016/j.exer.2014.01.018. [DOI] [PMC free article] [PubMed] [Google Scholar]
- 19.Mainali L, Raguz M, O’Brien WJ, Subczynski WK. Exp Eye Res. 2012;97:117–129. doi: 10.1016/j.exer.2012.01.012. [DOI] [PMC free article] [PubMed] [Google Scholar]
- 20.Mainali L, Raguz M, O’Brien WJ, Subczynski WK. Curr Eye Res. 2017;42:721–731. doi: 10.1080/02713683.2016.1231325. [DOI] [PMC free article] [PubMed] [Google Scholar]
- 21.Mailer C, Nielsen RD, Robinson BH. J Phys Chem A. 2005;109:4049–4061. doi: 10.1021/jp044671l. [DOI] [PubMed] [Google Scholar]
- 22.Bieri VG, Wallach DF. Biochim Biophys Acta. 1975;406:415–423. doi: 10.1016/0005-2736(75)90020-6. [DOI] [PubMed] [Google Scholar]
- 23.Warren GB, Houslay MD, Metcalfe JC, Birdsall NJ. Nature. 1975;255:684–687. doi: 10.1038/255684a0. [DOI] [PubMed] [Google Scholar]
- 24.Raguz M, Mainali L, O’Brien WJ, Subczynski WK. Exp Eye Res. 2015;140:179–186. doi: 10.1016/j.exer.2015.09.006. [DOI] [PMC free article] [PubMed] [Google Scholar]
- 25.Subczynski WK, Felix CC, Klug CS, Hyde JS. J Magn Reson. 2005;176:244–248. doi: 10.1016/j.jmr.2005.06.011. [DOI] [PubMed] [Google Scholar]
- 26.Quine RW, Eaton SE, Eaton GR. Rev Sci Instrum. 1992;63:4251–4262. [Google Scholar]
- 27.Yin JJ, Subczynski WK. Biophys J. 1996;71:832–839. doi: 10.1016/S0006-3495(96)79284-6. [DOI] [PMC free article] [PubMed] [Google Scholar]
- 28.Jost PC, Griffith OH, Capaldi RA, Vanderkooi G. Proc Natl Acad Sci U S A. 1973;70:480–484. doi: 10.1073/pnas.70.2.480. [DOI] [PMC free article] [PubMed] [Google Scholar]
- 29.East JM, Melville D, Lee AG. Biochemistry. 1985;24:2615–2623. doi: 10.1021/bi00332a005. [DOI] [PubMed] [Google Scholar]
- 30.Ryba NJ, Horvath LI, Watts A, Marsh D. Biochemistry. 1987;26:3234–3240. doi: 10.1021/bi00385a045. [DOI] [PubMed] [Google Scholar]
- 31.Marsh D. Eur Biophys J. 1997;26:203–208. [Google Scholar]
- 32.Raguz M, Mainali L, Widomska J, Subczynski WK. Biochim Biophys Acta. 2011;1808:1072–1080. doi: 10.1016/j.bbamem.2010.12.019. [DOI] [PMC free article] [PubMed] [Google Scholar]
- 33.Plesnar E, Subczynski WK, Pasenkiewicz-Gierula M. J Phys Chem B. 2013;117:8758–8769. doi: 10.1021/jp402839r. [DOI] [PMC free article] [PubMed] [Google Scholar]
- 34.Fleissner MR, Bridges MD, Brooks EK, Cascio D, Kalai T, Hideg K, Hubbell WL. Proc Natl Acad Sci U S A. 2011;108:16241–16246. doi: 10.1073/pnas.1111420108. [DOI] [PMC free article] [PubMed] [Google Scholar]
- 35.Haas DA, Mailer C, Robinson BH. Biophys J. 1993;64:594–604. doi: 10.1016/S0006-3495(93)81418-8. [DOI] [PMC free article] [PubMed] [Google Scholar]
- 36.Subczynski WK, Widomska J, Wisniewska A, Kusumi A. Methods in Molecular Biology, Lipid Rafts. Vol. 398. Humana Press; Totowa: 2007. pp. 143–157. [DOI] [PubMed] [Google Scholar]
- 37.Subczynski WK, Raguz M, Widomska J. Methods Mol Biol. 2010;606:247–269. doi: 10.1007/978-1-60761-447-0_18. [DOI] [PMC free article] [PubMed] [Google Scholar]
- 38.Hyde JS, Yin JJ, Subczynski WK, Camenisch TG, Ratke JJ, Froncisz W. J Phys Chem B. 2004;108:9524–9529. [Google Scholar]
- 39.Froncisz W, Camenisch TG, Ratke JJ, Anderson JR, Subczynski WK, Strangeway RA, Sidabras JW, Hyde JS. J Magn Reson. 2008;193:297–304. doi: 10.1016/j.jmr.2008.05.008. [DOI] [PMC free article] [PubMed] [Google Scholar]
- 40.Subczynski WK, Mainali L, Camenisch TG, Froncisz W, Hyde JS. J Magn Reson. 2011;209:142–148. doi: 10.1016/j.jmr.2011.01.003. [DOI] [PMC free article] [PubMed] [Google Scholar]
- 41.Mainali L, Raguz M, Camenisch TG, Hyde JS, Subczynski WK. J Magn Reson. 2011;212:86–94. doi: 10.1016/j.jmr.2011.06.014. [DOI] [PMC free article] [PubMed] [Google Scholar]
- 42.Mainali L, Sidabras JW, Camenisch TG, Ratke JJ, Raguz M, Hyde JS, Subczynski WK. Appl Magn Reson. 2014;45:1343–1358. doi: 10.1007/s00723-014-0578-7. [DOI] [PMC free article] [PubMed] [Google Scholar]
- 43.Percival PW, Hyde JS. Rev Sci Instrum. 1975;46:1522–1529. [Google Scholar]


