

Abstract
Mitochondria are dynamic organelles that undergo continuous cycles of fusion and fission. Monitoring and quantification of mitochondrial dynamics has proved to be challenging because these processes are distinctly different from movement and apposition. While the majority of contact events do not lead to fusion, fission can occur without translocation, leaving the two mitochondria juxtaposed. The advent of photoactivateable fluorescent proteins has enabled researchers to distinguish mitochondrial fusion and fission. These genetically encoded fluorophores can be targeted to the mitochondrial compartments of interest to visualize how these intermix and segregate between dynamic mitochondria over time. The PAGFPmt-based mitochondrial dynamics assay has proved to be a powerful technique for revealing the treatments and cellular processes that affect fusion and fission. By using this technique in combination with other parameters, such as measurements of mitochondrial membrane potential, we have begun to understand the processes that control fusion and fission as well as the significance of mitochondrial dynamics.
1. Mitochondrial Dynamics
Mitochondrial dynamics refers to two distinct processes that are both essential for normal cellular function. First, dynamics can refer to the movement and redistribution of mitochondria. For example, mitochondria must redistribute during mitosis to populate both daughter cells. Second, mitochondrial dynamics also refer to processes of fusion and fission that mitochondria continuously undergo. Fusion of both the outer and inner membranes of mitochondria leads to the intermixing of membrane proteins. In addition, matrix solutes and mitochondrial DNA are able to mix upon fusion of two mitochondria. These processes underlie complementation processes that play an important role in the maintenance of the mitochondrial population. On the cellular level, mitochondrial dynamics affects respiration, calcium handling, mitosis, and apoptosis (Detmer and Chan, 2007; Herzig and Martinou, 2008; Jeong and Seol, 2008; Szabadkai et al., 2006). At the level of the organism, mitochondrial dynamics is involved in disease, aging, and development (Chan, 2006; Chen et al., 2003; Zuchner et al., 2004).
The number, shape, and size of mitochondria are mediated by the balance of fusion and fission. Under most physiological conditions, mitochondrial shape and size remain relatively constant (within 1 or 2 μm) because fusion and fission events occur in pairs (Twig et al., 2008). When perturbations in mitochondrial dynamics occur, either favoring fission or fusion, dramatic changes in mitochondrial morphology have been observed (Bereiter-Hahn and Voth, 1994; Hoffmann and Avers, 1973; Mozdy and Shaw, 2003; Nunnari et al., 1997; Scott et al., 2003).
In recent years, much interest has been devoted to studying the proteins, processes, and treatments that affect mitochondrial fusion and fission. To this end, various tools have been developed to observe, monitor, and quantify mitochondrial dynamics. The quantification of fusion in particular can be complicated because it is necessary to differentiate between apposition, partial fusion, and full fusion. This is further complicated by the finding that fusion of the inner and outer mitochondrial membranes is independent events (Malka et al., 2005). For these reasons, looking at morphological changes alone, at the light microscopy resolution, does not allow for the measurement of fusion and fission events. By using a photoactivateable form of GFP (PAGFP), we have been able to differentiate between these events. Furthermore, simultaneous measurements of other biophysical parameters add another level of understanding and can aid in the differentiation of certain fission and fusion events (Twig et al., 2006).
PAGFP can be targeted to different parts of the mitochondrion in order to examine the mixing properties that underlie fusion events between these organelles. Once targeted, spatially precise photoconversion can be used to induce GFP fluorescence. The movement and dilution of photoconverted GFP within an individual mitochondrion or mitochondrial population can then be tracked by time lapse confocal imaging. We have found that targeting PAGFP to the mitochondrial matrix is useful for assessing size and fusion because the fluorophore diffuses freely in this space. When full fusion occurs and the matrix temporarily becomes continuous between mitochondria, the fluorophore is transferred between organelles and provides an indicator for the establishment of matrix continuity and the transfer of matrix solutes. Mitochondrial DNA in the matrix has also been shown to be redistributed between mitochondria upon fusion. If PAGFP is targeted to a membrane bound protein, it is possible to visualize how this protein becomes redistributed when two mitochondria fuse. For example, we have observed that redistribution of the inner membrane bound protein, ABC-me, does not occur at the same time as matrix solute equilibration (Twig et al., 2006).
1.1. Monitoring dynamics
In recent years, imaging based methodologies for the observation of mitochondrial fusion and fission have allowed investigators to begin characterizing the processes that control mitochondrial dynamics. The use of genetically encoded fluorescent proteins has further enabled investigators to observe fusion events between mitochondria. Full fusion is characterized by luminal continuity and is responsible for the passage of DNA, proteins, and matrix solutes between mitochondria. By targeting fluorescent indicators to the mitochondrial matrix, it is possible to observe these complete fusion events by imaging the passage of fluorophores between mitochondria.
2. PAGFPmt
Targeting PAGFP to the mitochondrial matrix delineates the borders of the mitochondrial inner membrane. By photoconverting regions within a mitochondrion with a 2-photon laser, photoconverted GFP molecules in the matrix will trace the extent of luminal continuity (Twig et al., 2006) as GFP molecules move freely through the matrix space. The movement of GFP within this space is not hindered despite protein density and high viscosity of the matrix (Partikian et al., 1998). In addition to quantifying mitochondrion size, the diffusion ability of GFP molecules within the mitochondrial matrix can be used to observe mitochondrial fusion events in real time. PAGFPmt can be used alone or in combination with other probes for a number of different applications that can measure the following parameters; mitochondrial movement, membrane potential of individual mitochondria over time, fusion frequency, fusion site/localization, fusion rate of a cell’s mitochondrial population, and the transfer and organization of proteins in fusing mitochondria. Although this review will focus on the quantification of mitochondrial dynamics, the methodologies described can be easily applied to the measurement of all these parameters.
2.1. Photoconversion
The photoactivateable form of GFP increases fluorescence intensity (FI) 100-fold after irradiation with 413 nm light (Patterson and Lippincott-Schwartz, 2002). The development of a photoactivatable GFP that is useful at physiological conditions has opened new doors in the study of temporal and spatial dynamic interactions within a cell. Combined with 2-photon laser stimulation, it is possible to specifically stimulate individual organelles within a living cell and to monitor its interactions with other organelles.
Wild-type GFP is a mixed population of fluorophores with a major and minor absorbance peaks at 397 and 475 nm, respectively. Intense illumination with ultraviolet light causes the fluorophore population to give rise to the anionic form which demonstrates an increase in the minor peak absorbance. This causes an increase in fluorescence with subsequent 488 nm excitation. PAGFPmt is a variant that possesses a minor absorbance peak (475 nm) that is significantly lower than wild type. This further enlarges the increase in fluorescence emission detected following photoconversion if excitation is done with a 488 nm laser.
2.2. Targeting mitochondrial matrix
We added a mitochondrial matrix targeting sequence to PAGFP cDNA (Karbowski et al., 2004; Twig et al., 2006). DNA coding for the mitochondrial targeting sequence of COXVIII was amplified by PCR and inserted 5′ to GFP thereby targeting it to the mitochondrial matrix. Transfection of this construct works well in many systems such as COS7 cells, primary human myocytes, hippocampal neurons, and MEF cells (Karbowski et al., 2004). Expression of PAGFPmt becomes evident after 48 h. PAGFPmt expression can be visualized by eye with blue light excitation and green emission. Alternatively expression can be verified by western blot analysis with GFP antibody. Transfection is a stressful treatment and in some cells may lead to a change in mitochondrial architecture and dynamics. If cells are transfected with the PAGFPmt plasmid using lipofection, it is recommended that mitochondrial architecture of transfected and non-transfected cells be compared. We have observed some level of mitochondrial fragmentation to occur due to the stress of lipofection in the clonal beta cell line, INS1. To prevent lipofection induced stress, we generated lentiviral and adenoviral vectors. Although the initial infection may cause some degree of cell death (1–10%) after 48 h, this becomes less evident over time and is not observed in subsequent passages of the cell line.
2.3. Generating lentiviral and adenoviral vectors
We have packaged PAGFPmt for lentiviral and adenoviral delivery using pWPI (Trono) or pAdEasy (Adenoeasy), respectively. We find lentiviral transduction highly efficient in cell lines such as INS1 while adenoviral transduction exhibits better efficiency in primary preparations such as beta cells from the islets of Langerhans. In addition, lentiviral transduction allows the PAGFPmt to integrate into the host genome. We have found expression to be stable for as many as 10 passages. Freezing the cells and storing in liquid nitrogen leads to noticeably lower expression when the cells are thawed for use. This may be due to selection influences during the freeze thaw cycle.
3. Tracking Individual Fusion and Fission Events
By tagging individual mitochondria with photoconverted PAGFPmt, we have observed individual fusion events (Fig. 16.1). These events occur under normal conditions and without stimulation or stress. By generating time lapse z-stacks we find that we are able to capture these events and document and quantify their occurrence. A fusion event is characterized by the transfer of photoconverted PAGFPmt molecules from the tagged mitochondrion to another previously unlabeled unit (Fig. 16.1). Fission events typically follow fusion events and are characterized by the loss of PAGFPmt continuity. We have observed that the average duration of a fusion event is ~1 min. It is notable that fission can occur without a change in the apposition of the two daughter mitochondria, a process we refer to as “hidden fission” (Twig et al., 2006). We find that fission events often generate daughter mitochondria with disparate membrane potential that can be appreciated when using a potential sensitive dye such as TMRE. Daughter mitochondria resulting from a fission event will appear more red when hyperpolarized and stained with TMRE or more green when depolarized due to the presence of PAGFPmt. Therefore, some “hidden fission” events can be identified by the two daughter mitochondria having disparate changes in membrane potential.
Figure 16.1.
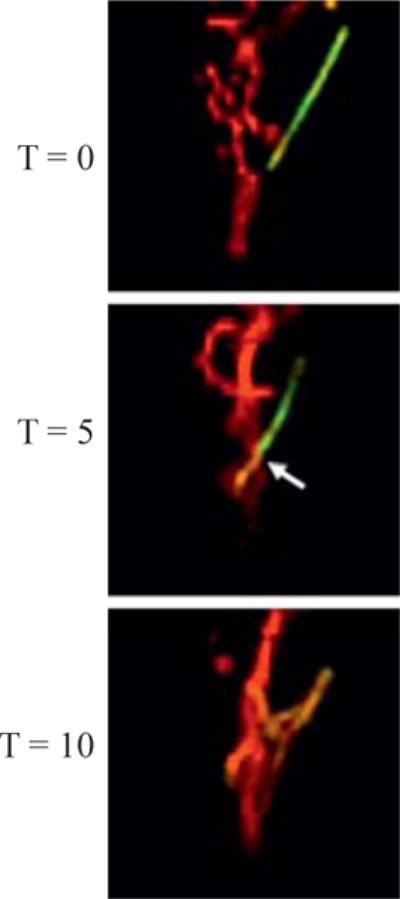
Mitochondrial fusion results in the transfer of PAGFPmt. At time zero, a photolabeled PAGFPmt positive mitochondrion is depicted as an isolated unit within an INS1 cell. Five min later, this mitochondrion has moved and undergone fusion with an adjacent mitochondrion. The arrow points to the presumptive fusion site. PAGFPmt has been transferred to another mitochondrion which now appears yellow due to the mixing of the green and red fluorophore. At T = 10 min, more fusion events have occurred and the average PAGFPmt fluorescence intensity has gone down due to dilution of photoconverted molecules.
3.1. Co-labeling mitochondria with TMRE versus dsRED versus Mitotracker Red
Mitochondria were labeled with the mitochondrion-specific dye tetramethylrhodamine ethyl ester perchlorate (TMRE; Invitrogen). TMRE concentration should be adjusted for the cell type with a lower concentration being preferred. Keep in mind that laser toxicity is proportional to the dye concentration in the mitochondria. Typically, for freshly isolated primary cells, 3–5 nM should be sufficient; immortalized cell lines may require higher concentrations, 7–15 nM. Freshly prepared TMRE was added to culture in DMSO to give a final concentration and incubated for 45 min in a 37 °C incubator before imaging. Cells loaded with TMRE should be kept in dark to avoid phototoxicity. At the end of the loading period, the dye is not removed from the media. TMRE can be used to dynamically monitor membrane potential in mitochondria. Increases in TMRE fluorescence indicate hyperpolarization while decreases report depolarization. Since membrane potential influences mitochondrial fusion, it is expected that mitochondria with reduced TMRE intensity will have reduced probability for a fusion event within the duration of the experiment. During a fission event, the concentration of matrix targeted PAGFPmt in the two daughters is identical. It is therefore possible to use the ratio (R) of TMRE/PAGFPmt for ratio imaging and comparison of membrane potential between the two daughter mitochondria generated during the fission event. The membrane potential difference between daughter (a) and daughter (b) can be calculated in millivolts (Δψ = 61.5 Log(Ra/Rb)) in experiments performed at 37 °C.
Other fluorophores such as the dsRED protein and Mitotracker Red dye (MTR, Invitrogen) can be used to identify and characterize non-fusing mitochondria. In mitochondria, we have observed that slight increase in the intensity of 2-photon laser (750 nm) will result in dsRED bleaching during the photoconversion of PAGFPmt. This characteristic can be used to identify non-fusing mitochondria, because these will have very high dsRED fluorescence. In addition, cells expressing mitochondrial dsRED can be fixed with 4% paraformaldehyde for 15 min while preserving fluorescence and mitochondrial architecture. This allows the user to further characterize the non-fusing mitochondrial subpopulation. For example, using an antibody to probe for the mitochondrial fusion protein OPA1 in fixed cells, we have found that OPA1 expression is decreased in the non-fusing population (Twig et al., 2008). MTR loading into mitochondria is dependent on Δψ. Therefore, short pulses of MTR exposure can be used to identify polarized mitochondria versus those that are depolarized. Once the dye is loaded, it does not leave the mitochondria during fixation allowing further characterization of MTR stained mitochondria by immunofluorescence.
3.2. Spatially precise photoconversion with 2-photon laser
Cells transfected or virally transduced with PAGFPmt should be allowed to accumulate the protein in the mitochondrial matrix for 48 h. A transition to its active (fluorescent) form is achieved by photoisomerization with a 2-photon laser (750 nm) to give a 375-nm photon equivalence at the focal plane. This allows for selective photoconversion of areas as small as 0.5 μm2 with a thickness of less than 0.5 μm. In the absence of photoconversion, PAGFPmt protein molecules remained stable in their pre-converted form. The presence of pre-converted PAGFPmt was detected with high-intensity excitation at 488 nm (25-mW laser set at 1%) in combination with a fully opened pinhole. Spatially precise laser excitation can be used to label individual segments of the mitochondrial network at a time. The extent that photoconverted PAGFPmt is able to travel within a mitochondrion can be measured in order to quantify the size distribution of mitochondrial populations.
3.3. Confocal imaging
Confocal microscopy was performed on live cells in glass bottomed dishes (MatTek, Ashland, MA) with a Zeiss LSM 510 Meta microscope with a plan apochromat 100× (numerical aperture 1.4) oil immersion objective. Three configurations were set using the multitrack mode: one for detection of the pre-converted PAGFPmt (higher 488 nm intensity), a second for photoconversion (750 nm with 2P laser), and a third for recording photoconverted PAGFPmt (low intensity 488 nm). Red-emitting TMRE was excited with a 1-mW, 543 nm helium/neon laser set at 0.3%, and emission was recorded through a BP 650–710 nm filter. Photoconverted PAGFPmt protein was excited with a 25-mW, 488 nm argon laser set between 0.2 and 0.5%. Emission was recorded through a BP 500–550 nm filter.
4. Quantifying Networking Activity in Whole Cells: Whole Cell Mitochondrial Dynamics Assay
PAGFPmt can be similarly used to monitor and quantify networking activity in a whole cell (Karbowski et al., 2004). By photoconverting PAGFPmt in a subpopulation of mitochondria, we have been able to observe the spread of photoconverted PAGFPmt signal throughout a cell via fusion and fission events and by mitochondrial movement as well (Fig. 16.2). Fusion events not only lead to the spread of the photoconverted PAGFPmt across the networking population, but it also leads to a dilution in the concentration of photoconverted molecules. This is translated into a reduction in the average GFP fluorescent intensity in the mitochondria that carry the photoconverted form. Therefore, by monitoring the decrease in PAGFPmt fluorescence intensity over time, we can distinguish fusion events that result in the transfer of PAGFPmt between mitochondria from the spread of PAGFPmt due to mitochondrial movement alone. This type of analysis can be used to compare the rate of mitochondrial dynamics between cells and due to various treatments. For example, we have reported that mitochondrial fusion is halted in pancreatic beta cells with exposure to toxic nutrient levels.
Figure 16.2.
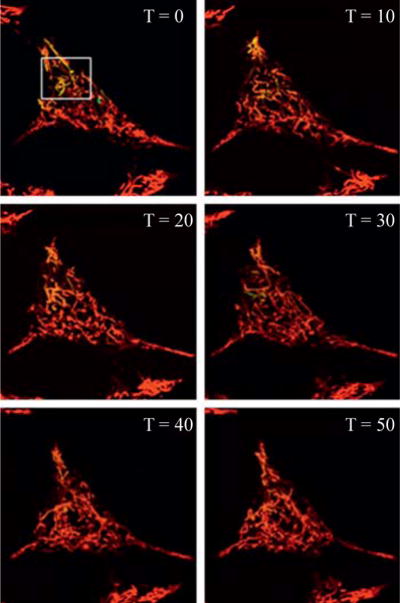
Monitoring mitochondrial fusion within the entire population. At time zero, the white box designates the area targeted with 2-photon laser for photoconversion of PAGFPmt to an active form. Notice that by the time the imaging acquisition has started, noticeable movement of mitochondria has already occurred. Subsequent images are obtained every 10 min for 50 min. Images are a single slice through the middle of an INS1 cell. The PAGFPmt signal is diluted over time leading to the appearance of yellow mitochondria. The yellow mitochondria appear more red over time due to further dilution of the green fluorophore.
4.1. Photoconversion of mitochondrial subpopulations for the whole cell mitochondrial dynamics assay
The size of the mitochondrial subpopulation to be photoconverted should be kept constant if the user wishes to compare the rate of fusion between different conditions or cells. Photoconverting larger subpopulations will lead to shorter equilibration times. Two numerical values can be used to quantify the rate of mitochondrial dynamics:
The extent of dilution after a specified period of time (30 min or 1 h)
Time to steady state (equilibration time), defined by time after which no further dilution is measured
Although the size of the area of photoconversion can be kept constant by using the same zoom value for activation, the number of mitochondria and size of the photoconverted population can still vary. This is due to the ability of matrix targeted GFP molecules to diffuse freely through any mitochondria with interconnected lumen and variations in the density of mitochondria. We find that with INS1 cells, activating an area that is 20% of the total cell area with 2P laser will provide an average equilibration time of around 45 min.
The same laser settings used for the monitoring of single mitochondria can be used for activating subpopulations. However, it is important to ensure that the 2-photon laser intensity is sufficient to photoconvert GFP while leaving the TMRE signal intact. The loss of TMRE fluorescence is indicative of phototoxicity and mitochondrial depolarization.
For our experiments, we used a Coherent Mira 900 fs laser (Santa Clara, CA). We determined the minimum intensity and duration of laser exposure that initiated changes in Δψm and/or mitochondrial morphology in cells treated with TMRE. The parameters utilized in the reported experiments were well below these thresholds. To determine the safety limits of 2-photon laser stimulation in INS1 cells, excitation was delivered over a wide range of intensities and durations. We found that excitation for 600 ms/μm2 at 1 mW laser intensity at the objective is the threshold dosage for INS1 and COS7 cells above which a reduction in mitochondrial membrane potential can be observed. All subsequent experiments using 2-photon illumination were conducted with duration of 150 ms/μm2 and an intensity of 1 mW. Due to variability in laser output, it is suggested that the user determine these values for the particular system being used. These intensity values can be used as a starting point and fine tuned.
4.2. Time lapse confocal imaging for cellular mitochondrial dynamics quantification
It is sufficient to collect six images from different focal planes at each time point (this is compared to 20 images or more that would be required for 3D reconstruction) because the extent of fusion activity is derived from the dilution of the photoconverted PAGFPmt. After photoconversion, a z-stack of six images is collected every 5 min for 50 min. This can be adjusted to ensure that photobleaching or phototoxicity does not reduce the cellular PAGFPmt or TMRE fluorescent intensity. It is conceivable that PAGFPmt bleaching may contribute to a decrease in PAGFPmt signal over time. This would present an artifact in the analysis and quantification of PAGFPmt dilution. When fusion is inhibited, we find that the PAGFPmt intensity/(pixel area) remains stable over 50 min. For this measurement pixel area is defined as the total area of photoconverted PAGFP. Figure 16.3 shows that without fusion and dilution of PAGFPmt, there is no bleaching due to repeated excitation and no loss of fluorescence intensity over a period of 50 min.
Figure 16.3.
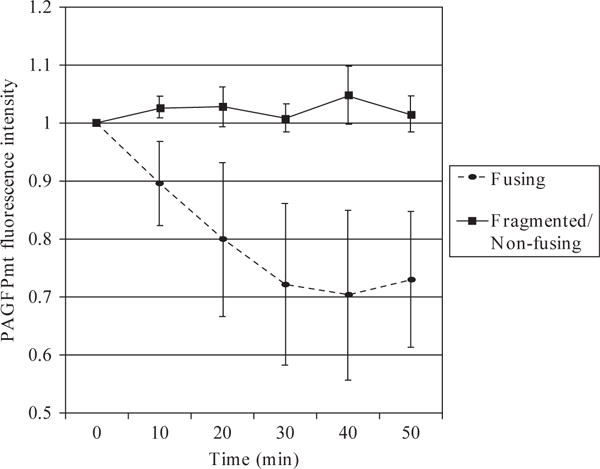
The average intensity of PAGFPmt fluorescence is monitored in order to assess mitochondrial fusion activity. An area encompassing 20% of the total cell is targeted with 2-photon laser activation in order to convert PAGFPmt into its active form. Z-stacks consisting of six slices each are taken every 10 min for 50 min. The average PAGFPmt fluorescence intensity is measured and normalized to time zero. The decrease in fluorescence indicates that under normal conditions, when INS1 cell mitochondria form elongated elaborate structures, fusion occurs between mitochondria (n = 6). When we induce apoptosis and mitochondria become fragmented, there is no observed dilution of the PAGFPmt signal (n = 6). Notice that the fluorescence intensity remains stable throughout the recording time indicating that photobleaching does not occur using the image acquisition parameters.
4.3. Analysis
Monitoring the dilution of photoconverted PAGFPmt is an efficient way of quantification the sharing of GFP between mitochondria (Fig. 16.3). Theoretically, when one mitochondrion carrying a matrix targeted photoconverted PAGFPmt fuses with another, the number of photoconverted molecules equilibrates between the two units and each ends up with half, causing a decrease in fluorescence intensity.
4.3.1. Monitoring GFP dilution
Quantification of fusion was performed using Metamorph (Molecular Devices CA) by measuring the average FI of the mitochondria that became PAGFPmt positive. The procedure involved first the elimination of non-mitochondrial pixels from the green (PAGFPmt) image followed by the measurement of green FI from mitochondria that were PAGFPmt and TMRE positive.
Prior to measuring FI, we used an “Integrated Morphometry Analysis” function designed for these experiments in order to extract TMRE (or dsRED) positive structures that were larger than 10 pixels. These areas were interpreted as mitochondria, and their PAGFPmt was recorded. This procedure enabled the selection of mitochondrial structures from which PAGFPmt was measured using very low threshold levels in the green channel (approximately 10% of the image average intensity) assuring that over 90% of the mitochondrial pixels were included for analysis. We verified that all intensity measurements were below saturation, see Section 5.2.
A low threshold (~10%) was applied to the green channel to identify the PAGFPmt positive mitochondria. Average FI (PAGFPmt) was measured from thresholded areas using Region Measurement. To set the threshold level, a test-threshold function first measured the average green FI of the mitochondria. The lower (inclusive) threshold was set at two thirds of this average. An upper threshold was not necessary since saturated images were carefully avoided during collection.
The FI values of PAGFPmt at each time point were normalized to the FI value immediately after photoconversion and then fitted to a hyperbolic function:
F and Fplateau denote FI at time t and in the plateau phase. T50 denote the time interval to a 50% decrease in normalized GFP FI ([1 − Fplateau]/2). All fitting procedures and statistical tests were conducted using Kaleida–Graph software (Synergy Software, Reading, PA). Paired student’s T-tests were performed to calculate statistical significance.
4.3.2. Monitoring GFP spread
Using colocalization of PAGFPmt and TMRE as a metric for quantification is problematic for a number of reasons. The decrease in GFP intensity with each fusion event is so prominent that it affects the perceived colocalization and confounds the results. We have found that at later time points, the GFP intensity can become so weak that its colocalization with red pixels becomes unreliable. With photoconversion of 10–20% of the cell area, we typically find that the GFP intensity at equilibrium is on average 60% lower compared to the beginning of the trial. In addition, in order to perform the colocalization analysis, it is necessary to scan an interlaced z-series through the cell. This is because fusion events can occur in any orientation. Higher rates of image acquisition should be avoided in order to prevent artifacts caused by photobleaching. GFP intensity dilution can report fusion events occurring outside of the focal plane.
5. Potential Artifacts and Important Controls
There are a number of sources for potential artifacts that can lead to errors in the calculation of mitochondrial fusion measurements. This section will address these concerns and discuss ways to avoid these problems. It should be noted that any values for settings provided are for reference only and have only been tested on our system. The optimal settings may differ between systems, even from the same manufacturer.
5.1. Phototoxicity generated by 2-photon laser excitation
Photoconversion of PAGFPmt into its fluorescent form requires careful calibration of the 2-photon laser intensity. This potential problem has been addressed in detail in Section 2.1. We have observed that high 2-photon laser intensity can damage mitochondria and cause instability of Δψ as well as permanent depolarization. This could confound measurements of mitochondrial fusion rates because depolarized mitochondria are unable to undergo fusion (Griffin et al., 2006; Meeusen et al., 2004; Twig et al., 2008). By using TMRE to co-stain mitochondria in the PAGFPmt fusion assay, it is possible to monitor if the photoconversion event itself caused depolarization of mitochondria. In order to determine the correct laser parameters to use for PAGFPmt photoconversion, increasing doses of laser intensity must be tested to determine if the TMRE fluorescence intensity is affected. It is important to consider that in order to use such low photoconversion stimuli, it is necessary to have sufficient expression of mitochondrial PAGFPmt. With our lentiviral delivery system, we find that increases in dosage of virus for transduction correlates with greater expression efficiency.
5.2. Photobleaching and saturation
During image acquisition, it is essential to carefully monitor the images for the effects of photobleaching or saturation. Photobleaching occurs when the 488 nm excitation laser is too strong. This can confound the measurements of PAGFPmt dilution and overestimate the level of mitochondrial fusion. To determine the laser intensity that does not cause bleaching, PAGFPmt intensity should be monitored over time in a system where mitochondrial fusion is blocked. It has been shown that MEF cells lacking MFN1 have mitochondria that are fragmented and unable to undergo fusion. These cells do not exhibit dilution of the mitochondrial PAGFPmt signal over time (Karbowski et al., 2004). We have found that INS1 cells treated with high levels of fatty acid and glucose also exhibit mitochondrial fragmentation and generate a non-fusing mitochondrial sub-population. Using this system, we have been able to show that our image acquisition protocol does not cause photobleaching as reported by a photoconverted PAGFPmt signal that remains stable for the duration of the recording, up to 2 h. Alternatively, if a non-fusing condition can not be achieved, the whole cell PAGFPmt FI should be monitored over time. When appropriate 488 laser intensity is used, spreading of PAGFPmt signal should not result in the reduction of whole cell PAGFPmt FI. This can be measured by dividing the GFP fluorescence by the entire pixel area of the cell. On our Zeiss LSM 510 system, we find that using a 25 mW 488 nm argon laser set at 0.2–0.5% does not cause photobleaching even when six image z-stacks are obtained every 5 min for a recording time of 1 h.
PAGFPmt fluorescence saturation is also problematic because it can significantly limit the dynamic range of the fluorescence intensity curve. This would cause some fusion events, especially early in the recording time frame to go unrecognized. In addition to exceedingly strong 488 nm excitation, high gain settings for the image collection CCD camera are a likely culprit for saturation issues. Using the image acquisition software, it is important to ensure that the PAGFPmt image is not saturated after photoconversion to its fluorescent form.
5.3. Thresholding
For image analysis, it is necessary to set a lower inclusive threshold in order to define which pixels are to be included in the quantification of intensity over time. The parameters we have chosen for the determination of this threshold have been described earlier in this chapter. Careful consideration must be applied when choosing this threshold value because picking one that is too low will introduce noise from non-mitochondrial fluorescence and one that is too high will limit the bottom end of the PAGFPmt intensity dynamic range. To prevent this issue, it is necessary to ensure that the chosen threshold value is suitable not only at time zero, right after photoconversion, but also at the end time point. It is important to make sure that pixels are not lost toward the end of the recording time, when equilibrium has been reached.
6. Comparison with an Alternative Method
Polyethylene glycol (PEG) fusion has been used in a number of laboratories in order to study fusion activity within a population of mitochondria in eukaryotic cells. Basically, cells expressing mitochondrial matrix GFP and mitochondrial matrix RFP are placed in coculture for 24 h. Prior to fusion, de novo synthesis of proteins is halted with cyclohexamide. PEG is added in order to fuse cells and observations are performed at different time points in order to observe the mixing of the mitochondria GFP and RFP signals. A complete fusion event creates a yellow mitochondrion indicative of the mixing of green and red fluorophores. There are a number of limitations to this methodology. Firstly, dramatic alterations in the plasma membrane are necessary in order to fuse two cells together. This may lead to alterations in fusion ability simply due to the stress induced by the addition of PEG. The PEG fusion assay also requires that a cell with red mitochondria and another with green mitochondria end up in close enough proximity for fusion to occur between these cells. This requires precision at the time of plating to ensure that the plating densities of both cell types are optimal. With PEG fusion, the user cannot specify which mitochondrion or group of mitochondria is to be analyzed for fusion ability. Comparing fusion rates measured using the cell fusion and PAGFPmt-based assays reveals significant disparity. PEG fusion analyses in different cell types reveal that some fusion events occur within 90–120 min with complete equilibration taking place between 7 and 24 h (Chen et al., 2003; Legros et al., 2002; Mattenberger et al., 2003). In comparison, the PAGFPmt-based assay, reports that full equilibration can be observed within 1 h with t ½ (average time required to reach a 50% reduction in fluorescence intensity) ranging from 30 min to 1 h (Karbowski et al., 2004; Twig et al., 2006, 2008). The advent of photoactivateable fluorescent proteins provides an alternative approach for monitoring dynamics that addresses some of the limitations of PEG fusion.
Acknowledgments
We thank Dr Jennifer Lippincott-Schwartz for sharing PAGFP construct with us. This work was supported by National Institutes of Health Grants 5R01HL071629–03 and 5R01DK074778. We thank Drs Daniel Dagan, Gilad Twig, and Sarah Haigh for their comments and helpful advice in writing the manuscript. We thank Drs David Nicholls and Gyorgy Hajnoczky for helpful discussion and for their insights.
References
- Bereiter-Hahn J, Voth M. Dynamics of mitochondria in living cells: Shape changes, dislocations, fusion, and fission of mitochondria. Microsc Res Tech. 1994;27:198–219. doi: 10.1002/jemt.1070270303. [DOI] [PubMed] [Google Scholar]
- Chan DC. Mitochondria: Dynamic organelles in disease, aging, and development. Cell. 2006;125:1241–1252. doi: 10.1016/j.cell.2006.06.010. [DOI] [PubMed] [Google Scholar]
- Chen H, Detmer SA, Ewald AJ, Griffin EE, Fraser SE, Chan DC. Mitofusins Mfn1 and Mfn2 coordinately regulate mitochondrial fusion and are essential for embryonic development. J Cell Biol. 2003;160:189–200. doi: 10.1083/jcb.200211046. [DOI] [PMC free article] [PubMed] [Google Scholar]
- Detmer SA, Chan DC. Functions and dysfunctions of mitochondrial dynamics. Nat Rev Mol Cell Biol. 2007;8:870–879. doi: 10.1038/nrm2275. [DOI] [PubMed] [Google Scholar]
- Griffin EE, Detmer SA, Chan DC. Molecular mechanism of mitochondrial membrane fusion. Biochim Biophys Acta. 2006;1763:482–489. doi: 10.1016/j.bbamcr.2006.02.003. [DOI] [PubMed] [Google Scholar]
- Herzig S, Martinou JC. Mitochondrial dynamics: To be in good shape to survive. Curr Mol Med. 2008;8:131–137. doi: 10.2174/156652408783769625. [DOI] [PubMed] [Google Scholar]
- Hoffmann HP, Avers CJ. Mitochondrion of yeast: Ultrastructural evidence for one giant, branched organelle per cell. Science. 1973;181:749–751. doi: 10.1126/science.181.4101.749. [DOI] [PubMed] [Google Scholar]
- Jeong SY, Seol DW. The role of mitochondria in apoptosis. BMB Rep. 2008;41:11–22. doi: 10.5483/bmbrep.2008.41.1.011. [DOI] [PubMed] [Google Scholar]
- Karbowski M, Arnoult D, Chen H, Chan DC, Smith CL, Youle RJ. Quantitation of mitochondrial dynamics by photolabeling of individual organelles shows that mitochondrial fusion is blocked during the Bax activation phase of apoptosis. J Cell Biol. 2004;164:493–499. doi: 10.1083/jcb.200309082. [DOI] [PMC free article] [PubMed] [Google Scholar]
- Legros F, Lombes A, Frachon P, Rojo M. Mitochondrial fusion in human cells is efficient, requires the inner membrane potential, and is mediated by mitofusins. Mol Biol Cell. 2002;13:4343–4354. doi: 10.1091/mbc.E02-06-0330. [DOI] [PMC free article] [PubMed] [Google Scholar]
- Malka F, Guillery O, Cifuentes-Diaz C, Guillou E, Belenguer P, Lombes A, Rojo M. Separate fusion of outer and inner mitochondrial membranes. EMBO Rep. 2005;6:853–859. doi: 10.1038/sj.embor.7400488. [DOI] [PMC free article] [PubMed] [Google Scholar]
- Mattenberger Y, James DI, Martinou JC. Fusion of mitochondria in mammalian cells is dependent on the mitochondrial inner membrane potential and independent of microtubules or actin. FEBS Lett. 2003;538:53–59. doi: 10.1016/s0014-5793(03)00124-8. [DOI] [PubMed] [Google Scholar]
- Meeusen S, McCaffery JM, Nunnari J. Mitochondrial fusion intermediates revealed in vitro. Science. 2004;305:1747–1752. doi: 10.1126/science.1100612. [DOI] [PubMed] [Google Scholar]
- Mozdy AD, Shaw JM. A fuzzy mitochondrial fusion apparatus comes into focus. Nat Rev Mol Cell Biol. 2003;4:468–478. doi: 10.1038/nrm1125. [DOI] [PubMed] [Google Scholar]
- Nunnari J, Marshall WF, Straight A, Murray A, Sedat JW, Walter P. Mitochondrial transmission during mating in Saccharomyces cerevisiae is determined by mitochondrial fusion and fission and the intramitochondrial segregation of mitochondrial DNA. Mol Biol Cell. 1997;8:1233–1242. doi: 10.1091/mbc.8.7.1233. [DOI] [PMC free article] [PubMed] [Google Scholar]
- Partikian A, Olveczky B, Swaminathan R, Li Y, Verkman AS. Rapid diffusion of green fluorescent protein in the mitochondrial matrix. J Cell Biol. 1998;140:821–829. doi: 10.1083/jcb.140.4.821. [DOI] [PMC free article] [PubMed] [Google Scholar]
- Patterson GH, Lippincott-Schwartz J. A photoactivatable GFP for selective photolabeling of proteins and cells. Science. 2002;297:1873–1877. doi: 10.1126/science.1074952. [DOI] [PubMed] [Google Scholar]
- Scott SV, Cassidy-Stone A, Meeusen SL, Nunnari J. Staying in aerobic shape: How the structural integrity of mitochondria and mitochondrial DNA is maintained. Curr Opin Cell Biol. 2003;15:482–488. doi: 10.1016/s0955-0674(03)00070-x. [DOI] [PubMed] [Google Scholar]
- Szabadkai G, Simoni AM, Bianchi K, De SD, Leo S, Wieckowski MR, Rizzuto R. Mitochondrial dynamics and Ca2+ signaling. Biochim Biophys Acta. 2006;1763:442–449. doi: 10.1016/j.bbamcr.2006.04.002. [DOI] [PubMed] [Google Scholar]
- Twig G, Elorza A, Molina AJ, Mohamed H, Wikstrom JD, Walzer G, Stiles L, Haigh SE, Katz S, Las G, Alroy J, Wu M, et al. Fission and selective fusion govern mitochondrial segregation and elimination by autophagy. EMBO J. 2008;27:433–446. doi: 10.1038/sj.emboj.7601963. [DOI] [PMC free article] [PubMed] [Google Scholar]
- Twig G, Graf SA, Wikstrom JD, Mohamed H, Haigh SE, Elorza A, Deutsch M, Zurgil N, Reynolds N, Shirihai OS. Tagging and tracking individual networks within a complex mitochondrial web with photoactivatable GFP. Am J Physiol Cell Physiol. 2006;291:C176–C184. doi: 10.1152/ajpcell.00348.2005. [DOI] [PubMed] [Google Scholar]
- Zuchner S, Mersiyanova IV, Muglia M, Bissar-Tadmouri N, Rochelle J, Dadali EL, Zappia M, Nelis E, Patitucci A, Senderek J, Parman Y, Evgrafov O, et al. Mutations in the mitochondrial GTPase mitofusin 2 cause Charcot-Marie-Tooth neuropathy type 2A. Nat Genet. 2004;36:449–451. doi: 10.1038/ng1341. [DOI] [PubMed] [Google Scholar]