

Abstract
Objective
To outline new design directions for informatics solutions that facilitate personal discovery with self-monitoring data. We investigate this question in the context of chronic disease self-management with the focus on type 2 diabetes.
Materials and methods
We conducted an observational qualitative study of discovery with personal data among adults attending a diabetes self-management education (DSME) program that utilized a discovery-based curriculum. The study included observations of class sessions, and interviews and focus groups with the educator and attendees of the program (n = 14).
Results
The main discovery in diabetes self-management evolved around discovering patterns of association between characteristics of individuals’ activities and changes in their blood glucose levels that the participants referred to as “cause and effect”. This discovery empowered individuals to actively engage in self-management and provided a desired flexibility in selection of personalized self-management strategies. We show that discovery of cause and effect involves four essential phases: (1) feature selection, (2) hypothesis generation, (3) feature evaluation, and (4) goal specification. Further, we identify opportunities to support discovery at each stage with informatics and data visualization solutions by providing assistance with: (1) active manipulation of collected data (e.g., grouping, filtering and side-by-side inspection), (2) hypotheses formulation (e.g., using natural language statements or constructing visual queries), (3) inference evaluation (e.g., through aggregation and visual comparison, and statistical analysis of associations), and (4) translation of discoveries into actionable goals (e.g., tailored selection from computable knowledge sources of effective diabetes self-management behaviors).
Discussion
The study suggests that discovery of cause and effect in diabetes can be a powerful approach to helping individuals to improve their self-management strategies, and that self-monitoring data can serve as a driving engine for personal discovery that may lead to sustainable behavior changes.
Conclusions
Enabling personal discovery is a promising new approach to enhancing chronic disease self-management with informatics interventions.
Keywords: Chronic disease (C23.550.291.500), Self-care (N02.421.784.680)
1. Background and significance
Health and healthcare are becoming increasingly driven by data [1–3]. Increased availability of clinical data collected within the Electronic Health Record (EHR) has enabled new clinical decision-support tools [4,5]; secondary analysis of these data has led to new discoveries in medicine and pharmacology [6,7]. Increasing availability of genetic data led to the growing interest in personalizing medical treatment using precision medicine approaches [8]. To a large degree, these advances have been influenced by the extensive body of work on clinical decision-making and the role of data in improving medical reasoning and judgment [9–12] coupled with novel informatics and data science methods for analyzing clinical data [13,14].
Parallel to this increased reliance on clinical and genetic data, self-monitoring data are increasingly seen as an important contributor to improvements in both medical care and self-management [15,16]. Self-monitoring has long been accepted as standard practice in a variety of chronic diseases and conditions [17]. One such disease, type 2 diabetes, affects 29.1 million people in the United States [18], is associated with a number of complications [19], can lead to depression and reduced self-worth [20,21], and has a devastating economic impact [22]. Standards of Medical Care in Diabetes by the American Diabetes Association (ADA) suggest that self-monitoring of blood glucose (BG) levels may help to guide self-management in diabetes [23]. The American Association of Diabetes Educators (AADE) includes self-monitoring among its’ seven essential self-care behaviors [24]. In response to these recommendations, new self-monitoring solutions in diabetes help individuals keep track not only of their blood glucose levels but also of relevant daily activities, including sleep and physical exercise. Yet more recent studies of self-monitoring in diabetes increasingly call into question its benefits for self-management, particularly for individuals with type 2 diabetes who are not using insulin. Recent systematic reviews showed that these individuals receive marginal benefits from monitoring their blood glucose levels, or no benefits at all [25–27].
This lack of clear benefits presents a need for deeper understanding and theorizing regarding the role of self-monitoring data in self-management of type 2 diabetes, and, potentially, other chronic conditions. In recent years, there emerged several frameworks that examine how individuals engage with personal data; these include Personal Informatics framework [28], Self-Experimentation framework [29], and Sensemaking framework [30]. These frameworks often incorporate reflection and discovery as an essential step in individuals’ engagement with their personal data and suggest including visual representations of collected data for facilitating discovery. However, the definitions of reflection and discovery in this body of work tend to be broad and generic, raising many important questions as to what it is individuals wish to discover and how they engage with data for discovery [31]. Moreover, many previous explorations in personal informatics have focused on individuals whose engagement with personal data was driven by curiosity—self-identified “data enthusiasts” [32,33]. Yet individuals who engage in self-monitoring to improve their health may have different goals and motivations, and, consequently, different needs for reflection and discovery. Moreover, chronic conditions such as diabetes have considerably higher prevalence among ethnic minorities and medically underserved communities, who tend to have lower levels of literacy and numeracy than typical users of personal informatics solutions [34]. Perhaps as a result, even after over a decade of explorations in personal informatics, there exist few concrete design guidelines for incorporating self-monitoring data into informatics solutions for health self-management, including guidelines for visualizing self-monitoring data.
In this research, we investigate how individuals with diabetes who do not fit the “data enthusiast” category use self-monitoring data to identify patterns of association between their activities (diet, exercise, sleep, and medication adherence), and blood glucose levels in order to improve their self-management. To this end, we conducted an observational study of a diabetes self-management and education program (DSME) that used a curriculum with a specific focus on fostering personal discovery through self-monitoring [35]. We focused on this specific setting because it exemplified carefully curated best practices to personal discovery, which contrasted with previous studies examining more naive approaches to discovery with data by individuals with diabetes [36]. Our research questions included the following: (1) what type of discovery is important in diabetes self-management, (2) how individuals engage with self-monitoring data to answer their questions; and (3) what barriers and facilitators exist that could help to identify opportunities to promote this type of discovery with informatics interventions. We use the results of this study to develop a framework for personal discovery in diabetes and to identify opportunities to facilitate personal discovery with informatics solutions.
2. Method
2.1. Settings
This study was conducted at a diabetes self-management education (DSME) program in the southern United States recognized by the American Diabetes Association (ADA) that used a curriculum with a specific focus on experiential learning and discovery [35]. The program was run at a privately-owned diabetes education center; the staff included one certified diabetes educator (CDE), who was also a registered dietician (RD), and several assistants who did not deliver education, but provided support during different educational activities.
The education at the center was delivered through a 4-week small-group program that combined interactive lectures with practicum sessions. During practicum sessions individuals reflected on their everyday experiences managing diabetes, and worked through individual challenges to glycemic control. To facilitate this process, the participants engaged in extensive self-monitoring by recording their meals, medications, patterns of sleep, and physical activity, coupled with blood glucose readings captured before and after these activities (for example prior to and two hours after a meal) using structured paper-based journals. During practicum sessions, the educator reviewed each individual’s data privately with them, and helped them to arrive at discoveries and develop self-management plans. These discoveries were often discussed with the group during group discussions.
2.2. Participants
The participants of study included the CDE, who was recruited based on the recommendations from the creators of the curriculum. All individuals with diabetes attending the diabetes education program at the time of the study were invited to participate, without any additional restrictions. In addition, we solicited help from the CDE in recruiting participants among former students of the center. This led to the recruitment of a purposive sample of 10 additional individuals who had completed the DSME program at the same center within the last 2 years.
2.3. Study design
The study was conducted during the spring of 2012. It included the following methods:
2.3.1. Observations of class sessions
Two authors (LM and AS) took turns observing all 4 of the classes in one round of the DSME program. Due to the sensitive nature of the discussions, no recording devices were used; instead, the researchers took extensive field notes during the lectures and the practicum part of the class.
2.3.2. Interviews with the educator and participants
The researchers conducted semi-structured interviews with the educator and three individuals who attended the program at the time the study was conducted. Each interview lasted between 45 and 60 min and focused on the participants’ experiences with discovery, its perceived role in diabetes self-management, barriers to discovery, and ways to overcome them with education and tools.
2.3.3. Focus group with former participants of the DSME program
The study also included a focus group with ten individuals who previously completed the DSME program.
All interviews and focus group were audio recorded and transcribed verbatim for analysis. The study was approved by the Columbia University Medical Center Institutional Review Board. All participants provided informed consent prior to participating in the research activities.
2.4. Data analysis
The researchers used inductive thematic approach to analyze the collected data [37]. First, three of the authors (LM, AS, EH) met for three 1-h collaborative coding sessions during which they read the transcripts together, discussed meaning and significance of the different segments, and developed an initial coding scheme. After that, coding continued independently, with the investigators meeting weekly to discuss changes to the coding scheme, and emerging findings. The investigators then combined categories into higher-level themes during several in-person work sessions, and continued discussing these emerging themes until they agreed on one main theme and its dimensions.
3. Results
3.1. Participant characteristics
Fourteen individuals participated in the study, including one diabetes educator and 13 individuals with diabetes. Most of the participants were above 50 years old, all were Caucasian and had type 2 diabetes. Their duration with diabetes varied widely, from 1 year to 24 years. There was a near-even split between males and females and between those on Medicare and private insurances. Full set of participants’ demographic characteristics is included in Table 1.
Table 1.
Demographic characteristics of participants with diabetes.
| Characteristics of individuals with diabetes (n=13) |
|
|---|---|
| Age | Mean = 55.3 (range 47–61) |
| Gender | Female n = 7, male n = 6 |
| Race/ethnicity | Caucasian n = 14 (100%) |
| Diabetes type | Type 2 diabetes (n = 13, 100%) |
| Years with diabetes | Mean = 9.5 years (range: 1–24 years) |
| Insurance status | Medicare n = 5, Private Insurance n = 8 |
| Times in the program | First time n = 12, Second time n = 1 |
3.2. Discovery in diabetes self-management: cause and effect
One of the main goals of the program was to help individuals discover patterns of association between different activities and variations in their blood glucose levels. Many participants described this as “cause and effect.” For many, such discovery was a genuine surprise.
You start becoming aware [that] there are certain foods [that] affected your blood sugar numbers. You didn’t – myself would never have imagined that. (P1)
According to the participants, recognizing the connection between “cause” and “effect” had several benefits. Most importantly, it helped individuals to connect their choices with their health, and appreciate their ability to induce change in their glycemic control. It also provided them with the ability to flexibly negotiate their daily choices. When study participants’ self-management was focused on following rigid guidelines, they felt too restricted in their choices, which often led to poor adherence to or abandoning self-management altogether, often to the detriment of their health. In contrast, the ability to independently discover connections helped them to learn to manipulate their daily activities to maintain the desired level of glycemic control:
And the class actually taught you like going out to restaurants or going out for fast food, okay yeah, well get this instead of this at the fast food. You’re still having [something] and you’re not suffering sitting there, watching everybody else eating. You know how to adjust. (P2)
Moreover, personal discovery of these connections had a more profound impact on individuals’ reported commitment to changes compared to education and explanations alone:
I love to see somebody miss an insulin dose and see an elevated blood sugar. I love that because they go, “Oh, my goodness, look what happens when I don’t take my insulin.” And so, they can see and immediately then make that decision to self-adjust and say, “I’ve got to figure out a way to not forget.” (Educator)
3.3. The process of discovery
The discovery of cause and effect usually occurred during practicum sessions at the beginning of each class. We identified several common approaches individuals used to examine their data during practicum sessions. Sometimes it included identifying an individual meal with a particularly high glycemic impact and analyzing this meal for its various characteristics, including specific ingredients, inclusion and proportion of different macronutrients, and cooking method, among others. Often, the educator facilitated this process by bringing certain meal characteristics to individuals’ attention:
“Ok, you guys, so Tim here he woke up with 88, and then he had a breakfast, and what did you have (2 cups of shredded wheat, and a banana, and tea), and then it went from 88 to 190. So did this meal help him or hurt him? And why? Because shredded wheat and a banana seems like a healthy breakfast, but if it makes your BG shoot through the roof, we’ll have to re-evaluate that.” (Educator).
At other times, participants noted a set of meals with similar glycemic impact, such as all high impact breakfasts, and examined them for similarities either in ingredients or macronutrients. For example, they may notice a glass of orange juice as a common feature of all high-impact breakfasts.
Alternatively, this first step included participants examining two seemingly similar meals that led to different blood glucose responses, for example, two meals that were overall similar but varied in one or two key ingredients. Those ingredients or characteristics of the meals were used to formulate hypotheses regarding features that impact BG levels:
I think I had the hamburger, the fries and a sweet tea. And then when I went back … I had the same burger and then a salad instead of the fries and an un-sweet tea. And it made such a difference in the amount of carbs, it was like oh my goodness, it was just unbelievable. (P7)
These activities typically led to participants identifying particular features of their meals that were perceived as being plausibly associated with a particular glycemic impact, high or low. Once the participants identified a particular feature, the educator encouraged them to examine their past records to search for other meals that included the selected feature and examine whether these meals had a similar glycemic impact. Often, however, the educator used these new hypotheses to make recommendations for future actions that could help to test the hypotheses-what new meals to try, how often to monitor blood glucose, and what characteristics of the meals to record.
The relationship between meal composition and blood glucose response was often one of the first discoveries. However, further in the program individuals began to identify connections in other activities, including physical activity and exercise, stress, overall wellbeing, quality of sleep, and medication, among several others.
3.4. Factors enabling discovery
3.4.1. Purposeful data
The first critical step towards discovery often included collection of relevant data, which in the case of diabetes self-management included blood glucose readings and records of daily activities. The participants of the program were encouraged to check their BG as often as 8 times per day, a substantial and costly increase from the once or twice a day checks common for most individuals not on insulin therapy. However, simply increasing frequency of checking one’s blood glucose was not sufficient to enable discovery. More importantly, the readings needed to be captured in relation to activities of interest. For example, if one’s goal was to explore the impact of different meal choices on one’s blood glucose, it was more important to check before and after one meal, rather than only before or only after multiple meals.
In addition, data needed to be captured with a sufficient level of detail that often increased participants’ burden. For example, while capturing BG readings was inconvenient and somewhat costly, these readings were relatively straightforward to obtain with a conventional blood glucose meter. In contrast, recording daily activities was nontrivial but essential for discovery. For example, various characteristics of a meal, including apparent and hidden ingredients, such as cooking oils, way of cooking, and portion sizes could all be factors in determining the impact of the meal. As a result, many participants felt that the more they captured the more they can learn.
I just want to throw out that I’ve seen an analogy between writing down everything you eat and writing down how much money you spend. Every day if you just jot down exactly what you spend and be truthful about it, it will be an eye-opener, and [same] deal about writing down everything you eat. (P8)
3.4.2. Scaffolding and knowledge
Despite the generally positive attitudes towards discovery, both the educator and the participants acknowledged that discovery can be challenging. The educator commented that simply asking individuals to review their records captured during the previous week and identify notable patterns did not have the desired impact and often led to confusion rather than discovery. In order to help individuals overcome this barrier, the educator provided two types of assistance. First, she modeled the questions for discovery, asking individuals to compare different meals, to look for specific differences in ingredients or macronutrients, or to look for similarities across meals. Second, she provided them with knowledge necessary to identify important differences and similarities. For example, she often helped the participants to abstract from specific ingredients to more general macronutrients, which could help to understand the sources of difference:
I want them to be able to take the data and make a decision or-but it’s hard if you’ve never-if you’re just learning about fat slowing absorption and you’ve got two meals and you’re comparing post-meal glucose response and you don’t necessarily-you’re not equipped yet to go, “Oh, there was avocado and there was chips and there was steak in this meal, and this one had very little to no fat,” and that’s the reason. (Educator)
3.4.3. Trust
Engagement in open discussions about personal challenges with the educator and the group was instrumental to participants’ ability to discover connections in their records. However, this engagement depended on the degree of trust between the participants, and between the participants and the educator. Moreover, it required reframing of glycemic control issues as discrepancies to be identified and adjusted, rather than as failures in self-management and reasons for guilt or blame. This transformation was reflected in the language used by both the educator and the participants. For example, the more traditional description of obtaining blood glucose readings, “test”, was often replaced with “check”, since “test” implies a potential to fail, and “check” refers to acquiring and reflecting on information without judgment.
From the educator perspective, abandoning a “guilt mindset” helped the educator to become a trusted advisor, facilitator and coach, rather than being an enforcer of healthy behaviors:
“So … there is a huge difference in the outcome of this process, depending on the philosophy of the instructor. Do you believe in empowerment? Do you believe in leaving guilt at the door? Can you not tell people what to do? Can you step back and let them make those choices for themselves?” (Educator)
In addition, it contributed to a high degree of trust and openness between the participants and the educator. Individuals who participated in the classes were encouraged to be open and honest about their experiences and were assured that they would not be judged or shamed:
“We leave judgment and guilt at the door, so I want folks to be honest and typically they are.” (Educator)
In return, this reframing further contributed to the individual’s confidence in facing challenges, and viewing high blood glucose readings as a call to action, rather than a cause of frustration.
4. Framework for personal discovery with data in diabetes self-management
Previous frameworks have typically incorporated reflection and discovery as a single step in an individual’s engagement with their personal data. Yet there are many different types of discovery, each of which may present different challenges and require different levels of data exploration and insight. Our study suggested that one of the most important types of discovery in type 2 diabetes is in regards to connections between daily activities and changes in glycemic control. It also suggested that this type of discovery is complex, involves several distinct steps, presents a number of challenges, and, consequently, requires considerable skills and knowledge. Below, we use the results of our study to further unpack this type of discovery and identify its components. Further, we identify opportunities to support these components with informatics solutions.
We propose that discovery of cause and effect—patterns of association between specific characteristics of daily activities and changes in blood glucose levels—includes four distinct stages: feature selection, hypothesis formulation, hypothesis evaluation, and goal specification (Fig. 1).
Fig. 1.
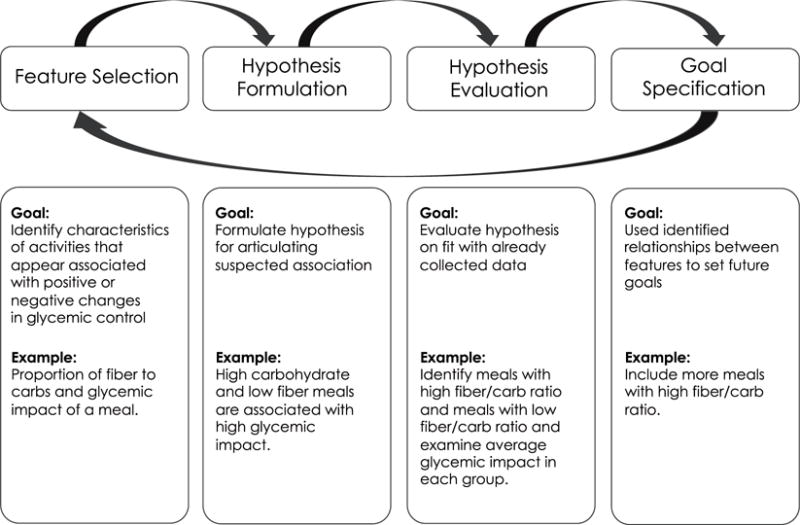
Stages of discovery with personal data.
4.1. Feature selection
The first step in personal discovery in diabetes includes identification of different characteristics of captured activities that may contribute to positive and negative changes in BG levels. In our study, this often involved examining different nutritional properties of captured meals (e.g., proportion of fiber to carbohydrate), properties of physical activity (e.g., time of day or duration), and quality and amount of sleep, among many others. In order to identify these features, the participants often grouped records that shared certain characteristics and examined their common attributes. However, because paper records used by the participants did not allow easy manipulation, they often had to rely on mental manipulation for identifying salient features.
Supporting feature selection
There exist many opportunities to facilitate feature selection with informatics solutions. For example, new tools for personal discovery could provide more explicit mechanisms for manipulating and examining collected data, such as sorting, filtering, grouping, and side-by-side comparison. Moreover, such tools could leverage computational data analysis methods that focus on pattern recognition, and feature selection and reduction. For example, these tools could use such techniques as hierarchical clustering to identify groups of activities that share similar properties and present those for visual inspection by individuals. Similarly, these tools could use feature reduction methods, such as principal component analysis to examine saliency of different identified features.
4.2. Hypothesis formulation
Once the suspected features are identified, individuals need to formulate a testable hypothesis regarding the suspected relationships. In our study, we observed that the participants were most comfortable formulating hypotheses on the level of specific foods or ingredients (e.g. “French Fries” or “bagels”). Yet to be evaluated, or to be useful in informing future action, these specific hypotheses often needed to be translated into a higher degree of abstraction, such as food groups (e.g. starchy vegetables), or macronutrients (carbohydrates). Moreover, translating vague suspicions into concrete hypotheses that can be evaluated with data can be non-trivial. For example, the participants often used such terms as “high carbohydrate” or “low fiber”, which can be difficult to translate into concrete quantifiable format.
Supporting hypothesis formulation
Future informatics for discovery can help individuals formulate and frame their hypotheses with the degree of abstraction and precision required for rigorous evaluation. For example, they can rely on natural language processing (NLP) methods coupled with ontologies and knowledge bases to map between different levels of abstraction in defining properties of different activities (e.g. from “French Fries” to “Starchy Vegetable” and “fried in oil” to “Carbohydrate and Fat” in the previous example). In addition, they can help individuals to be more specific in defining these properties in a quantifiable form, for example by helping them select ranges of values for different levels of variables (e.g. high and low).
4.3. Hypothesis evaluation
Once the suspected features were identified, individuals needed to examine hypotheses as to their fit with available data. For example, if fat was suspected as a mediator of the impact of meals on BG levels, individuals needed to examine whether variations in fat were indeed associated with changes in glycemic impact for all meals in their collection, and separate the impact of fat from other factors. While all steps of the discovery often presented considerable challenges, evaluating hypotheses appeared to be the most difficult in our study and required the most support from the educator. Limitations and shortcomings that occurred on the previous steps often became apparent during hypothesis evaluation. For example, poorly formulated hypotheses and hypotheses specified at the wrong level of abstraction often led to inconclusive results on evaluation phase: the participants either did not have enough records to evaluate their hypotheses, or were setting too broad or too narrow boundaries for their selections. And once again, at this stage the participants mostly had to rely on mental manipulations and pattern recognition or use annotation on their paper records. For example, we observed participants circling all meals that satisfied certain criteria (e.g. high fat dinners) and calculating average glycemic impact of these meals for examination and comparison.
Supporting hypothesis evaluation
Because hypothesis evaluation presents such a great challenge to individuals, this step can benefit the most from both interactive and computational solutions. Future tools for personal discovery could help users conduct more systematic hypotheses evaluation by allowing easier examination of evidence, for example by grouping activities that share hypothesized properties and their aggregated glycemic impact. In addition, these tools could provide users with built-in features for statistical analysis that could more systematically examine user-generated hypotheses.
4.4. Interpretation/goal formulation
The discoveries in regards to patterns of associations can have important implications for individuals’ future actions. Often, these actions took the form of self-experimentation to collect further evidence examining their hypotheses. Alternatively, discoveries were used to set behavior change goals to achieve better glycemic control. During this stage, however, individuals needed help translating their discoveries into specific goals and developing concrete action plans. For example, recognizing that including moderate amounts of fat can lower the glycemic impact of carbohydrates often led to a goal of including moderate amount of fat with meals. On this step, the educator in our study often helped individuals to more precisely formulate this goal, and pointed them to meals in their personal collections, or to meals captured by other participants that satisfied that criterion and used them as models to illustrate nutritional goals.
Supporting goal formulation
Future interventions for personal discovery can help individuals translate their discoveries into behavioral goals, formulate concrete action plans, and illustrate these action plans with records from their own collections or from collections of others. For example, they could use computable collections of diabetes self-management strategies (created by experts, or by communities of peers) to suggest meals that fit a particular nutritional profile, or different types of physical activity that are consistent with individuals’ lifestyle and abilities. Further they can help to generate recommendations for future data collection that would help individuals to more systematically manipulate different activities to examine suspected associations.
5. Connection with other frameworks
The framework presented here further extends previously proposed frameworks, particularly those outlined by Li et al. [28], Mamykina et al. [30], and Karkar et al. [29].
Previously, Li et al. proposed a framework for Personal Informatics that outlined 5 distinct stages of individuals’ engagement with personal data: preparation, collection, integration, reflection, and action [28]. This framework presents a comprehensive view on how individuals engage with personal data, from planning data collection, to taking action informed by reflecting on personal data. While this framework includes reflection as a critical step, it does not describe the process of how reflection occurs, nor does it differentiate between different types of reflection (e.g. reflection on changes in BG overtime versus reflection on possible connections between activities and BG levels). Here, we further unpack reflection as part of individuals’ engagement with data and outline the multiple steps involved in discovering of patterns in association between daily activities and changes in BG levels.
The framework proposed here is also complementary to our previously proposed framework of sensemaking in chronic disease self-management [30]. Previously, we argued that individuals with health challenges tend to function in a habitual mode, following familiar daily routines, until they encounter situations that challenge their understanding and expectations. In these situations, individuals often abandon the habitual mode, and actively engage in construction of new inferences. The model proposed here further outlines how these new inferences are constructed and translated into future actions (Fig. 2).
Fig. 2.
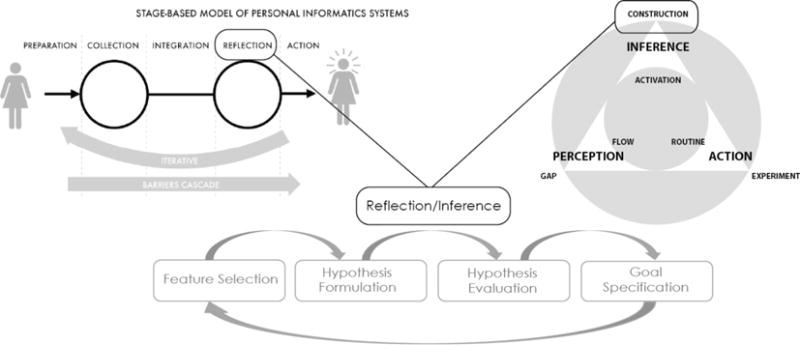
Framework for personal discovery with self-monitoring data.
Finally, this framework can be viewed as preceding self-experimentation activities described by Karkar et al. [29] and helping individuals identify initial hypotheses for evaluation.
6. Discussion
The increasing popularity and availability of self-monitoring technologies open new opportunities for individuals with health challenges to use personal data to improve their health and self-management. While existing frameworks in this space often include discovery and reflection among essential steps of individuals’ engagement with self-monitoring data, there exist few concrete guidelines for supporting personal discovery with informatics solutions beyond the general recommendation of including visual presentations of collected data. Moreover, previous research questioned the link between increased self-awareness and behavior change—a common goal of self-monitoring, particularly in health [38].
In this study we aimed to address these gaps, and examined the approach to promoting personal discovery with self-monitoring data used in a discovery-focused DSME program.
First of all, the study highlighted a particular type of personal discovery important in diabetes self-management: discovery of cause and effect, or patterns of associations between different characteristics of individuals’ daily activities and changes in their BG levels. This specific type of discovery is consistent with Li et al.’s characterization of individuals’ questions for self-monitoring data: both context (what affects my state now) and factors (what affects my state over long period of time) allude to the same type of discovery as our study [32]. However, our study also examined in detail how individuals engaged with their data to discover these connections—an account not available in the previous literature. In addition, it showed how individuals used their discoveries to formulate intentions for future actions, thus closing the loop between increased self-awareness and behavior change.
This study suggested that discovery of cause and effect appears to be considerably more challenging than other types of discoveries, for example discovery of typical routines (e.g., “I tend to exercise more on weekends”), or of historical trends in health biomarkers (e.g., “my blood glucose levels have been relatively stable in the last 6 months”). Our analysis also showed that discovery of cause and effect involves several iterative steps, and requires both skills and knowledge. Given the complexity involved in this type of discovery, it is perhaps not surprising that existing solutions for self-monitoring in diabetes have limited impact on individuals’ self-management and glycemic control. The vast majority of the existing solutions continues to focus on temporal visualization of trends and, thus, could plausibly assist with the first step of discovery, feature identification. However, few, if any, current solutions provide any assistance with hypothesis generation and evaluation, and with translating discoveries into new behavioral or self-experimentation goals.
Our characterization of discovery of cause and effect is consistent with existing accounts of discovery and hypothesis generation in medical reasoning [12]. For example, Arocha et al. characterized medical diagnostic reasoning as including forward-reasoning during which clinicians generated hypotheses from data, and backward-reasoning during which they evaluated their hypotheses on their fit with available data. It is also consistent with a typical characterization of the discovery process in data science: feature selection and reduction is an essential first step of any computational discovery research.
However, questions remain about whether and how future informatics solutions can promote and facilitate discovery of cause and effect. This is particularly important given the growing popularity of both technologies for self-monitoring and data collection, and new mobile platforms, such as smartphones that allow for more sophisticated interaction techniques and visual presentations of data. Our study suggested that this type of discovery is complex, cognitively demanding, and presents multiple challenges to individuals not trained in data analysis and causal reasoning. Moreover, reliance on paper as the main supporting technology severely limited individuals since it demanded that much of the data manipulation necessary for such analysis needed to be performed in individuals’ heads. At the same time, increasing sophistications of smartphones and other mobile technologies can allow for greater data visualization, manipulation, and interaction capabilities on small screens. This presents new opportunities to leverage existing knowledge in visual analytics – an emerging field that investigates approaches to supporting individuals in making sense of data using interactive visualizations. Heer and Shneiderman outlined a taxonomy of interaction techniques that can promote visual data analysis [39]. Some of these techniques are consistent with the ones we described earlier in this paper, for example filtering, sorting, and deriving. One can imagine future smartphone apps for discovery in diabetes that incorporate these techniques to promote data analysis.
However, to date, visual analytics approaches have been primarily used to design visual interfaces for experts, who have both motivation and skill necessary to engage with data, or at least those who possess certain levels of numeracy and graphical ability. In contrast, individuals with diabetes, which continues to have higher prevalence in economically disadvantaged communities and among ethnic minorities [40–42], may have neither of these driving factors. This suggests the need to shift cognitive complexity from individuals’ minds to computational data science and introduce more sophisticated data science solutions as driving engines of discovery in chronic disease self-management. In our previous work, we described this shift as transition from personal informatics to personal analytics – a class of informatics solutions that rely on computational data science methods to identify significant trends and patterns in data collected with self-monitoring [36] and novel interaction techniques to allow individuals to examine conclusions generated with data science and translate them into actionable goals. These methods could range from using natural language processing and data mining for identifying associations between descriptions of individuals’ meals and changes in blood glucose levels [43], to using personalized computational models to predict individuals’ glycemic reaction to different meals, based on their previous history [44]. Taking these solutions further, one might envision a precision approach to health self-management that uses self-monitoring data to make tailored recommendations for self-management strategies, for example changes to diet or patterns of physical activity that may have the highest positive impact on an individual’s health. Notably, this precision approach need not require high levels of sophistication from the users; instead, it can use computational complexity to generate personalized recommendations for actions that could be delivered to individuals in plain language, comparable to that used by diabetes educators [45].
The question remains, however, as to how to design such analytical solutions in a way that relies on computationally generated personalized recommendations, while at the same time promoting individual agency and empowerment, and integrates human intuition and intelligence together with computational discovery.
7. Limitations
This exploratory descriptive study has a number of limitations. Most notably, it was conducted with only one DSME program, thus limiting potential generalizability of the findings. In addition, the study included only a limited set of participants, many of them self-selected or recommended by the CDE running the program as active supporters of a discovery approach to diabetes self-management, which could have introduced selection bias and reduced our ability to identify limitations to engaging in discovery for broader populations. Moreover, due to the geographic location of the DSME program in this study, all study participants were Caucasian. Since there is a high prevalence of diabetes among ethnic minorities, it is important to consider the generalizability of these findings to more diverse populations.
8. Conclusions
In this paper we presented results of a qualitative observational study of a diabetes education and self-management program that focused on teaching and supporting personal discovery. The study demonstrated that discovering connections between daily behaviors and changes in their blood glucose readings helped individuals recognize their role in diabetes self-management, and gave them more flexibility in choosing effective self-management strategies consistent with their goals and lifestyles. The study also suggested that the discovery included four distinct stages, each of which required different types of assistance and scaffolding. We use the findings of the study to outline design directions for the new generation of informatics interventions for facilitating chronic disease self-management that transition from personal informatics into personal analytics.
Acknowledgments
This work was funded by the National Library of Medicine grants “Training in Biomedical Informatics at Columbia University”, T15 LM007079, and National Institute of Diabetes and Digestive and Kidney Disease (NIDDK), R01DK090372.
Footnotes
Contributorship statement
All authors designed the study. LM and AMS served as main research investigators in conducting all the described research activities, and preparing early drafts of the manuscript. LM wrote the first draft of the manuscript. AMS and PD served as domain experts and academic diabetes educators and were responsible for providing domain expertise during interpretation sessions. All authors participated in interpretation of study findings, formulating study conclusions, and preparation of the manuscript.
Contributors
There are no collaborators beyond the co-authors of the paper.
Conflict of interest
The authors have no competing interests for this publication.
References
- 1.Jee K, Kim GH. Potentiality of big data in the medical sector: focus on how to reshape the healthcare system. Healthcare Inform Res. 2013;19:79–85. doi: 10.4258/hir.2013.19.2.79. [DOI] [PMC free article] [PubMed] [Google Scholar]
- 2.Nambiar R, Bhardwaj R, Sethi A, Vargheese R. A look at challenges and opportunities of Big Data analytics in healthcare, in: 2013. IEEE International Conference on Big Data. 2013:17–22. doi: 10.1109/BigData.2013.6691753. [DOI] [Google Scholar]
- 3.Raghupathi W, Raghupathi V. Big data analytics in healthcare: promise and potential. Health Inf Sci Syst. 2014;2:3. doi: 10.1186/2047-2501-2-3. [DOI] [PMC free article] [PubMed] [Google Scholar]
- 4.Garg AX, et al. Effects of computerized clinical decision support systems on practitioner performance and patient outcomes: a systematic review. JAMA. 2005;293:1223–1238. doi: 10.1001/jama.293.10.1223. [DOI] [PubMed] [Google Scholar]
- 5.Kawamoto K, Houlihan CA, Balas EA, Lobach DF. Improving clinical practice using clinical decision support systems: a systematic review of trials to identify features critical to success. BMJ. 2005;330:765. doi: 10.1136/bmj.38398.500764.8F. [DOI] [PMC free article] [PubMed] [Google Scholar]
- 6.Hripcsak G, et al. Observational health data sciences and informatics (OHDSI): opportunities for observational researchers. Stud Health Technol Inform. 2015;216:574. [PMC free article] [PubMed] [Google Scholar]
- 7.Vilar S, Hripcsak G. Leveraging 3D chemical similarity, target and phenotypic data in the identification of drug-protein and drug-adverse effect associations. J Cheminformatics. 2016;8:1–12. doi: 10.1186/s13321-016-0147-1. [DOI] [PMC free article] [PubMed] [Google Scholar]
- 8.Ginsburg GS, McCarthy JJ. Personalized medicine: revolutionizing drug discovery and patient care. Trends Biotechnol. 2001;19:491–496. doi: 10.1016/s0167-7799(01)01814-5. [DOI] [PubMed] [Google Scholar]
- 9.Barnato AE, Tate JA, Rodriguez KL, Zickmund SL, Arnold RM. Norms of decision making in the ICU: a case study of two academic medical centers at the extremes of end-of-life treatment intensity. Intensive Care Med. 2012;38:1886–1896. doi: 10.1007/s00134-012-2661-6. [DOI] [PMC free article] [PubMed] [Google Scholar]
- 10.Baysari M, Westbrook J, Day R. Medication decision-making on hospital ward- rounds. Stud Health Technol Inform. 2011;169:935–939. [PubMed] [Google Scholar]
- 11.Laxmisan A, et al. The multitasking clinician: Decision-making and cognitive demand during and after team handoffs in emergency care. Int J Med Informatics. 2007;76:801–811. doi: 10.1016/j.ijmedinf.2006.09.019. [DOI] [PubMed] [Google Scholar]
- 12.Arocha JF, Patel VL, Patel YC. Hypothesis generation and the coordination of theory and evidence in novice diagnostic reasoning. Med Decis Making. 1993;13:198–211. doi: 10.1177/0272989X9301300305. [DOI] [PubMed] [Google Scholar]
- 13.Hripcsak G, Albers DJ. Next-generation phenotyping of electronic health records. J Am Med Inform Assoc. 2013;20:117–121. doi: 10.1136/amiajnl-2012-001145. [DOI] [PMC free article] [PubMed] [Google Scholar]
- 14.Pivovarov R, et al. Learning probabilistic phenotypes from heterogeneous EHR data. J Biomed Inform. 2015;58:156–165. doi: 10.1016/j.jbi.2015.10.001. [DOI] [PMC free article] [PubMed] [Google Scholar]
- 15.Chung AE, et al. Harnessing person-generated health data to accelerate patientcentered outcomes research: the Crohn’s and Colitis Foundation of America PCORnet Patient Powered Research Network (CCFA Partners) J Am Med Inform Assoc. 2016 doi: 10.1093/jamia/ocv191. ocv191. [DOI] [PMC free article] [PubMed] [Google Scholar]
- 16.Petersen C. Patient-generated health data: a pathway to enhanced long-term cancer survivorship. J Am Med Inform Assoc. 2015 doi: 10.1093/jamia/ocv184. http://dx.doi.org/10.1093/jamia/ocv184. [DOI] [PMC free article] [PubMed]
- 17.Monitoring in chronic disease: a rational approach - ProQuest. doi: 10.1136/bmj.330.7492.644. Available at: < http://search.proquest.com/openview/db310c9a16dc3b3b0e17463688911f19/1?pq-origsite=gscholar&cbl = 2040978 > (Accessed: 18th March 2017) [DOI] [PMC free article] [PubMed]
- 18.Diabetes Statistics - American Diabetes Association®. 2011 Available at: < http://www.diabetes.org/diabetes-basics/diabetes-statistics/ > (Accessed: 7th August 2013)
- 19.Amos AF, McCarty DJ, Zimmet P. The rising global burden of diabetes and its complications: estimates and projections to the year 2010. Diabet Med. 1997;14(Suppl 5):S1–85. [PubMed] [Google Scholar]
- 20.Anderson RJ, Freedland KE, Clouse RE, Lustman PJ. The prevalence of comorbid depression in adults with diabetes: a meta-analysis. Diabetes Care. 2001;24:1069–1078. doi: 10.2337/diacare.24.6.1069. [DOI] [PubMed] [Google Scholar]
- 21.Nagelkerk J, Reick K, Meengs L. Perceived barriers and effective strategies to diabetes self-management. J Adv Nurs. 2006;54:151–158. doi: 10.1111/j.1365-2648.2006.03799.x. [DOI] [PubMed] [Google Scholar]
- 22.The Cost of Diabetes - American Diabetes Association®. 2013 Available at: < http://www.diabetes.org/advocate/resources/cost-of-diabetes.html > (Accessed: 9th August 2013)
- 23.American Diabetes Association. Standards of Medical Care in Diabetes—2016. 2016;39 [Google Scholar]
- 24.AADE7™ - American Association of Diabetes Educators. Available at: < http://www.diabeteseducator.org/ProfessionalResources/AADE7/> (Accessed: 5th May 2014)
- 25.Clar C, et al. Self-monitoring of blood glucose in type 2 diabetes: systematic review. Health Technol Assess. 2010;14:1–140. doi: 10.3310/hta14120. [DOI] [PubMed] [Google Scholar]
- 26.Schnell O, et al. Self-monitoring of blood glucose in type 2 diabetes: recent studies. J Diabetes Sci Technol. 2013;7:478–488. doi: 10.1177/193229681300700225. [DOI] [PMC free article] [PubMed] [Google Scholar]
- 27.Malanda UL, et al. Self-monitoring of blood glucose in patients with type 2 diabetes mellitus who are not using insulin | Cochrane, Cochraine Library. 2012 doi: 10.1002/14651858.CD005060.pub3. [DOI] [PMC free article] [PubMed] [Google Scholar]
- 28.Li I, Dey A, Forlizzi J. Proceedings of the SIGCHI conference on human factors in computing systems. ACM; 2010. A stage-based model of personal informatics systems; pp. 557–566. [DOI] [Google Scholar]
- 29.Karkar R, et al. A framework for self-experimentation in personalized health. J Am Med Inform Assoc. 2016;23:440–448. doi: 10.1093/jamia/ocv150. [DOI] [PMC free article] [PubMed] [Google Scholar]
- 30.Mamykina L, Smaldone AM, Bakken SR. Adopting the sensemaking perspective for chronic disease self-management. J Biomed Inform. 2015;56:406–417. doi: 10.1016/j.jbi.2015.06.006. [DOI] [PMC free article] [PubMed] [Google Scholar]
- 31.Baumer EPS, et al. Proceedings of the 2014 Conference on Designing Interactive Systems. ACM; 2014. Reviewing Reflection: On the Use of Reflection in Interactive System Design; pp. 93–102. [DOI] [Google Scholar]
- 32.Li I, Dey AK, Forlizzi J. Proceedings of the 13th International Conference on Ubiquitous Computing. ACM; 2011. Understanding My Data, Myself: Supporting Self-reflection with Ubicomp Technologies; pp. 405–414. [DOI] [Google Scholar]
- 33.Epstein DA, Ping A, Fogarty J, Munson SA. Proceedings of the 2015 ACM International Joint Conference on Pervasive and Ubiquitous Computing. ACM; 2015. A lived informatics model of personal informatics; pp. 731–742. [DOI] [Google Scholar]
- 34.Peek ME, Cargill A, Huang ES. Diabetes health disparities. Med Care Res Rev. 2007;64:101S–156S. doi: 10.1177/1077558707305409. [DOI] [PMC free article] [PubMed] [Google Scholar]
- 35.Brackenridge B, Swenson K. Discovering diabetes: achieving target blood glucose control through a behavioural approach to insulin and food self-management. Brit J Diabetes Vascular Disease. 2004;4:117–120. [Google Scholar]
- 36.Mamykina L, et al. Data-Driven Health Management: Reasoning about Personally Generated Data in Diabetes with Information Technologies. doi: 10.1093/jamia/ocv187. [DOI] [PMC free article] [PubMed] [Google Scholar]
- 37.Strauss AL, Corbin JM. Basics of Qualitative Research: Grounded Theory Procedures and Techniques. Sage Publications; 1990. [Google Scholar]
- 38.Jakicic JM, et al. Effect of wearable technology combined with a lifestyle intervention on long-term weight loss: the IDEA randomized clinical trial. JAMA. 2016;316:1161–1171. doi: 10.1001/jama.2016.12858. [DOI] [PMC free article] [PubMed] [Google Scholar]
- 39.Heer J, Shneiderman B. Interactive dynamics for visual analysis. Commun ACM. 2012;55:45–54. [Google Scholar]
- 40.Hawthorne K, Robles Y, Cannings-John R, Edwards AG. Culturally appropriate health education for type 2 diabetes mellitus in ethnic minority groups. Cochrane Database Syst Rev. 2008:CD006424. doi: 10.1002/14651858.CD006424.pub2. [DOI] [PubMed] [Google Scholar]
- 41.Fact Sheet: Prevalence of Diabetes among Hispanics In Six U.S. Geographic Locations - hispanic.pdf.
- 42.Mamykina L, Heitkemper EM, Smaldone AM, Kukafka R, Cole-Lewis H, Davidson PG, Mynatt ED, Tobin JN, Cassells A, Goodman C, Hripcsak G. Structured scaffolding for reflection and problem-solving in diabetes self-management: qualitative study of mobile diabetes detective. J Am Med Inform Assoc. 2016;23(1):129–136. doi: 10.1093/jamia/ocv169. [DOI] [PMC free article] [PubMed] [Google Scholar]
- 43.Mamykina L, et al. From Personal Informatics to Personal Analytics: Investigating How Clinicians and Experts Reason about Personal Data Generated with Self-Monitoring in Diabetes, Cognitive Informatics in Health and Biomedicine. Springer; Berlin/Heidelberg: 2017. [Google Scholar]
- 44.Albers DJ, et al. Personalized glucose forecasting for type 2 diabetes using data assimilation. PLOS Comput Biol. 2017;13:e1005232. doi: 10.1371/journal.pcbi.1005232. [DOI] [PMC free article] [PubMed] [Google Scholar]
- 45.Cole-Lewis H, Smaldone AM, Kukafka R, Davidson PG, Mynatt ED, Tobin JN, Cassells A, Goodman C, Hripcsak G, Mamykina L. Participatory approach to the development of a knowledge base for problem-solving in diabetes self-management. Int J Med Informatics. 2016;85(1):96–103. doi: 10.1016/j.ijmedinf.2015.08.003. [DOI] [PMC free article] [PubMed] [Google Scholar]