

Abstract
Objective
Implantable neural electrode devices are important tools for neuroscience research and have an increasing range of clinical applications. However, the intricacies of the biological response after implantation, and their ultimate impact on recording performance, remain challenging to elucidate. Establishing a relationship between the neurobiology and chronic recording performance is confounded by technical challenges related to traditional electrophysiological, material, and histological limitations. This can greatly impact the interpretations of results pertaining to device performance and tissue health surrounding the implant.
Approach
In this work, electrophysiological activity and immunohistological analysis are compared after controlling for motion artifacts, quiescent neuronal activity, and material failure of devices in order to better understand the relationship between histology and electrophysiological outcomes.
Results
Even after carefully accounting for these factors, the presence of viable neurons and lack of glial scarring does not convey single unit recording performance.
Significance
To better understand the biological factors influencing neural activity, detailed cellular and molecular tissue responses were examined. Decreases in neural activity and blood oxygenation in the tissue surrounding the implant, shift in expression levels of vesicular transporter proteins and ion channels, axon and myelin injury, and interrupted blood flow in nearby capillaries can impact neural activity around implanted neural interfaces. Combined, these tissue changes highlight the need for more comprehensive, basic science research to elucidate the relationship between biology and chronic electrophysiology performance in order to advance neural technologies.
Keywords: Intracortical Microelectrode Arrays, Molecular and Cellular Neurobiology, Foreign Body Response, Brain-Computer Interface, Biocompatibility, Biotic and Abiotic Failure
2 Introduction
Implantable microelectrode arrays that can record extracellular action potentials from small, targeted populations of neurons are a critical tool for clinical neuroprosthetic applications as well as for basic neuroscience research. In neuroprosthetic applications, population firing rates recorded from intracortical electrodes in motor regions can be used to decode intended movement1. This information can then be used to restore some degree of lost function through control of a robotic limb or computer cursor. In basic neuroscience research, such as in studies of memory and plasticity, there also are critical requirements of stability at the neuroelectronic interface. Subtle changes in neural activity from training and learning need to be de-coupled from bulk tissue changes resulting from the biological response to the implant. This response has also been shown to contribute to device failure2–4, neural tissue damage5,6,127,128, and subsequently recording performance decline7–9, and therefore represents a formidable obstacle to reliable long-term recording and the advancement of neural device design10.
The biological response is composed of the resultant effects from device insertion and its presence in the local environment. Insertion causes blood-brain barrier (BBB) disruption, cell death, and mechanical trauma, which triggers a cascade of biochemical pathways that result in complex molecular and cellular responses to the implanted device5,11–14. Similarly, the microenvironment surrounding the implant experiences mechanical strain, BBB leakage and activation of glial cells, as well as a loss of perfusion, secondary metabolic injury, and neuronal degeneration5,15–17. This inevitably results in inflammation, which can contribute to reliability and variability issues that impact chronic recording performance, and is hypothesized to be a key cause of neural recording failure7,18. Thus, the biological response to the implant is multifaceted, with many potential avenues that can impact recording performance.
Currently, post-mortem histology is used to retrospectively assess the biological response to the device, and interpret the overall health of the tissue. Although histology has the capability of revealing important information around the device, interpretations from these data are complicated by several challenges: 1) Histology only captures a snapshot of the cellular or molecular activity at the time of perfusion, and is therefore unable to ascertain temporal information within an animal5,14,15,18–21. 2) Information may be lost or altered during transcardial perfusion and tissue fixation. For example, the tissue may continue to degenerate after animal sacrifice and before the paraformaldehyde can permeate and fix the tissue22. 3) Large tissue response variability has long been reported at different depths along the same shank7,8,23, leading to difficulties in interpretation of the tissue’s overall health. 4) In most studies, the implant is removed from the sample before processing. This removes tissue of interest, producing a tissue void and destroying the interface24,25. 5) In situ histological assessment may be confounded by tissue expansion and shrinkage, which occurs during fixation and processing26 (eg. sucrose or ethanol dehydration). The tissue-probe interface can become severely warped as the tissue deforms around the implant, while the implant remains the same size (since metals and silicon do not shrink or expand in tissue processing solvents that impact tissue). These issues highlight the limitations of post-mortem histological analysis in providing a complete assessment of the biological response, and in maintaining the integrity of the device-tissue interface.
As histology is commonly used to interpret tissue health, histological outcomes are often used to explain recording performance. However, attempts to correlate recording performance with histological outcomes have sometimes led to results that contradict expectations7,27. For example, end-point histology neuronal density has been reported to be more strongly correlated to acutely recorded action potential amplitudes (3 days post implant), rather than to action potential amplitudes recorded at the end point27. Previous studies have shown tissue around an implant in nearly ideal condition as determined by traditional histological metrics still failed to convey single unit (SU) action potentials for over two months prior to sacrifice7. Similarly, attempts to correlate recorded signal quality and impedance showed little or no relationship28–31. This information corroborates our previous findings that histology is not a reliable predictor of recording performance7.
It is now recognized that failure of neural recordings is not only governed by biological processes, but material and mechanical integrity as well2,5. Material failure has been recently shown to have a significant impact on recording failure2,9,32,33. Dramatic impedance increases can be caused by lead breakage or electrode site delamination, while dramatic decreases can result from insulation failure; both of which can decrease the recorded signal amplitude as described in detail elsewhere10,34. These results may partly account for inconsistencies between post-mortem histology and electrophysiological recording performance. Therefore, to correlate the biological tissue response to recording performance, experimental paradigms must account for material failure in order to draw comprehensive conclusions.
In this work, we explore the dynamic and complex environment at the neural interface through multiple methods to uncover new details regarding the relationship between neural tissue health and recording performance. To this end, our strategy was to: 1) account for artifacts that contaminate electrophysiology without introducing behavioral biases to recording performance metrics35; 2) record from quiescent neurons by evoking neural activity; 3) match histological sections with corresponding electrode sites; and 4) account for material failure of electrodes. After addressing these issues, our results show that classical histological metrics, such as NeuN, Iba1, GFAP and IgG, are not sufficient to predict recording performance7. Therefore, to gain deeper understanding of the biological mechanisms that govern recording performance, we explored multi-scale, multi-modal, in vivo experimental paradigms in conjunction with molecular analyses using post-mortem histology, to explore the complex neurobiology surrounding chronically implanted microelectrode arrays. Our findings suggest that long-standing assumptions about histology and recording performance in neural interface research are not necessarily true. We discuss several biological mechanisms that may explain the disparity observed, and argue that a deeper neurobiological understanding of the device-tissue interface is necessary to advance neural technologies and the field of Neural Engineering.
3 Methods
To evaluate the neuroelectronic interface, electrophysiological recording characteristics were evaluated across multiple metrics in the visual cortex of mice as previously established8,16,36–39. In addition, electrophysiological recordings were collected from awake, free moving, non-behaving mice, rats, and non-human primates (NHP). Lastly, GCaMP6 transgenic mice were installed with an imaging window and intracortical microelectrodes arrays as previously published40. Images of GCaMP expression as well as evoked activity and ongoing activity around the implanted electrode array were acquired using two-photon microscopy and optical microscopy.
3.1 Implantation
3.1.1. Array implantation
Microelectrode arrays were implanted into the cortex perpendicularly to the surface of the brain in several animal preparations which were previously published7–9,41–44: 1) 16 channel 3-mm long, base width of 123 µm, tapered single shank planar Michigan electrode with 703 µm2 recording sites spaced 100 µm apart (A1x16-3mm-100-703-CM16LP, Neuronexus Technologies. Ann Arbor, MI) were perpendicularly implanted into the left monocular visual cortex of 9 week old C57BL/6 mice (22–28g) as reported elsewhere7–9. Degeneratively doped silicon (.001 Ω-cm) arrays were used because heavily doped silicon (0.1–0.01 Ω-cm) generates photoelectric artifact8,21. 2) A 16 channel carbon fiber array on a silicon substrate and a single shank silicon electrode array were perpendicularly implanted into the right and left primary motor cortex, respectively, of adult male Long Evans rats weighing 300–350g as published elsewhere44,45. 3) One male rhesus macaque was implanted with two 96-channel intracortical microelectrode arrays (Blackrock Microsystems) in primary motor cortex of the right hemisphere as previously reported41. 4) Adult female Sprague-Dawley rats (224–249g, Charles River) were implanted with a nonfunctional, single shank array (A1x16-3mm-100-703-CM16LP, Neuronexus Technologies, Ann Arbor, MI) in the left Primary Motor Cortex using methods reported previously1. All experimental protocols were approved by the University of Pittsburgh, Division of Laboratory Animal Resources and Institutional Animal Care and Use Committee in accordance with the standards for humane animal care as set by the Animal Welfare Act and the National Institutes of Health Guide for the Care and Use of Laboratory Animals.
3.1.2. Mouse two-photon and optical imaging surgery
Four-shank 3 mm long CM style Michigan silicon electrodes with 177 µm2 iridium recording sites on 15 µm thick by 100 µm wide shanks, and 125 µm center-to-center shank spacing (Neuronexus Technologies, Ann Arbor, MI) were implanted into the visual cortex of transgenic mice (22–30g) that express either (i) GCaMP6 under the Thy1 promoter to visualize calcium transients in cortical neurons, (ii) green fluorescent protein (GFP) under the 2’-3’-cyclic nucleotide 3’-phosphodiesterase (CNP) promoter to observe oligodendrocytes and myelinated axons, or (iii) YFP under the Thy1 promotor to observe cortical neurons and neurites (Jackson Laboratories; Bar Harbor, ME) using methods previously published20,40. Animals were induced with an anesthetic mixture of 75 mg/kg ketamine and 7 mg/kg xylazine, placed in a stereotaxic frame, and the skin and connective tissue on the surface of the skull were removed. To help dry the bone and improve adhesion to the imaging well, a thin layer of Vetbond (3M) was placed over the skull. A 1 cm × 2 cm aluminum headplate with a 0.9 cm diameter observation hole was affixed to the exposed cranium with dental cement. A 4 mm by 6 mm craniotomy was made by slowly thinning the skull around the somatosensory and visual cortex using a high-speed dental drill at 1,000–3,000 RPM. Drilling was regularly paused and the skull was periodically bathed in saline to ensure that the underlying cortex did not experience thermal damage. Care was taken to prevent vascular damage during drilling and removal of the bone. The electrode array was positioned for insertion at a 30° angle from horizontal for insertion using a stereotaxic micromanipulator for two-photon imaging as previously published15,18,19,40. Arrays were positioned over the cortex and away from major vasculature so that little or no bleeding occurred during insertion. Aligned probes were inserted using a z-axis automated microdrive (MO-81, Narishige, Japan) at 200 µm/s for 500–600 µm so that the tip of the electrode was approximately 200–250 µm (~ layer 3) below the surface of the brain. For longitudinal imaging, the craniotomy was filled with Kwik-Sil and quickly covered with a glass coverslip as previously published20. The glass coverslip and electrode were secured with blue-light curing dental cement.
3.2 Neurophysiological Recording
3.2.1 Visually evoked recording sessions
Electrophysiological recordings from V1m were taken from perpendicularly implanted animals inside of a faraday cage with a visual stimulus-presenting computer monitor located outside of the cage as previously published7–9,39,46–48. 130 seconds of spontaneous activity (resting state; dark room) and visually evoked activity from V1 were sampled at 25kHz. During recording sessions, animals were situated on a heating pad (Deltaphase isothermal pad, Braintree Scientific, Inc, Braintree, MA) inside of a darkened faraday cage. The grounded faraday cage blocked major environmental noise without substantially blocking light from the monitor, which was placed just outside of the cage. Electrophysiological data was transferred outside of the cage through a nonconductive optic fiber via a battery-powered preamplifier (Medusa preamp, Tucker-Davis Technologies, Alachua FL (TDT)) housed inside of the faraday cage using previously published methods16 so that all inputs and outputs from the cage were limited to gas or optical8,16.
A 24” LCD screen (V243H, Acer. Xizhi, New Taipei City, Taiwan) was positioned outside of the cage and the animal’s head was mechanically fixed to the induction box through a custom-built holder. The animal was placed such that the contralateral eye of implantation was 20 cm from the monitor. For resting state activity, recordings were conducted in a dark room with the monitor turned off. To evoke activity in the visual cortex, full-field solid black and white bar gratings were presented drifting in a perpendicular or 45° directions were presented using the MATLAB-based Psychophysics toolbox49–51. Using Psychtoolbox, the timing of the visual stimulation was synchronized with the recording system (RX5, TDT) via transistor-transistor logic (TTL) pulses. Drifting gratings were presented for 1 or 4 seconds followed by an equal duration dark screen period.
Animal anesthesia level was kept at the lowest concentration sufficient for the maintenance of animal inactivity (0.75 – 1.1%). Subjects were carefully observed during recording to ensure that the proper level of anesthesia (stage 3-plane1) was maintained. The optimum level of anesthesia is defined as the lowest anesthesia concentration sufficient for maintaining animal inactivity while avoiding synchronous bursting neural activity since synchronous bursting (or burst suppression) leads to poor evoked neural activity and synaptic transmission8,52–54.
3.2.2. Awake, non-behaving free moving recording sessions
In addition, recording sessions were conducted under awake, non-behaving, free-moving conditions. Mice were recorded for 2 min as above while freely roaming in their cage. Similarly, rats were recorded under awake, non-behaving, free-moving conditions using a ZC16 headstage, RA16PA pre-amplifier and RX5 Pentusa base station (TDT). During data acquisition, the pre-amplifier high pass filtered at 2.2 Hz, anti-aliased filtered at 7.5 kHz, and sampled at a rate of ~25 kHz. Each recording session lasted 5 or 10 min. For NHP, recording was conducted in awake, non-behaving conditions while the animal was seated but free to move its head. Neural data was recorded using TDT RZ2 signal acquisition systems as previously described55.
3.3 Electrophysiological Signal Processing
The raw data stream was filtered using a 2nd order Butterworth filter to produce LFP (1–300 Hz) and spike (300 – 5,000 Hz) data streams (Fig. 2). The spike data stream was further processed with and without common average referencing16,56. The threshold for SU detection in the high-frequency data was established by using a window set at 3.5 standard deviations below the mean of the data as previously published16,56.
Figure 2. Animal movement creates electrophysiological artifacts that contaminate data.

a–c) Sample recordings from awake, freely moving NHP (96 channel, M1), rat (16 channel, M1), and mouse (16 channel, V1), over 50s, filtered with 2nd order, 0.3–1kHz passband Butterworth filter. Artifacts are observed as high amplitude activity that occurs across multiple channels simultaneously. d–f) Same as (a–c), except over 80ms. Gray shading highlights simultaneous spikes across channels. Action potentials and artifacts are denoted by blue and red circles, respectively. g–i) Representative waveforms detected from clustering. Thin blue and red lines are circled waveforms from (a–c). Thick lines are mean waveforms for the respective clusters. Note that in rats and mice, PCA and k-means clustering did not separate artifacts from action potentials, and therefore the mean waveform (shown in black) includes both action potentials and artifacts. Scalebars: a–f) 400µV, g–i) 100µV.
The following definitions are used: 1) SU activity was the activity of a single neuron as distinguishable by principal component analysis (PCA). 2) Outlier cluster activity was defined as the activity of the unsorted, outlier threshold-crossing events as defined by automatic clustering (see below). 3) MU activity was defined as the activity of all threshold-crossing events containing both sorted SU activity and outlier cluster activity.
3.4 SU Analysis
Spike sorting was carried out using a custom MATLAB script described previously8. A 1.2 ms waveform snippet was extracted when a 3.5 standard deviation threshold was crossed in the spike data stream. SUs were isolated by calculating the first 6 principal components (PCs) of each waveform. The resultant components were used to separate the waveforms into individual clusters using a previously published automatic spike sorting method57,58 in the Chronux toolbox. The signal-to-noise amplitude ratio (SNAR) was calculated as the peak-to-peak amplitude of the mean waveforms divided by twice the standard deviation of the noise:
| (1) |
where μSU-pp is the mean peak-to-peak amplitude of the waveform snippets and σN is the standard deviation of the spike data stream after all threshold crossings have been removed. If no SU was detected, SNAR was considered to be 0. Candidate units with SNAR between 2 and 3 were manually confirmed or excluded as SUs by examining the combination of waveform shape, auto-correlogram, peak threshold crossing offset, and peristimulus time histogram (PSTH). Units with SNAR below 2 were discarded. SUs with SNAR greater than 3 were manually confirmed by examining the waveform shape.
3.5 Multi-Unit (MU) Analysis
MU activity was evaluated as previously published8. Evoked MU yield was evaluated by counting MU spikes from a 550 ms wide bin starting 50 ms after stimulus onset and comparing to the number of spikes in a 550 ms bin ending 50 ms before stimulus onset8. MU signal amplitude was estimated using the quality metric defined as;
| (3) |
where μMU-pp is the mean peak-to-peak amplitude of all MUs and σMU-pp is the standard deviation of all the waveform snippets. The functional information in the MU quality was further quantified by defining the Signal-to-Noise Firing Rate Ratio (SNFRR):
| (4) |
where μon is the mean MU firing rate of the ‘ON’, μoff is the mean MU firing rate of the ‘OFF’ state, and σon and σoff are the standard deviation of firing rates during the ‘ON’ or ‘OFF’ states. A two-sided Welch’s T-test was conducted between ‘ON’ and ‘OFF’ firing rates. If no significant MU was detected, MU amplitude and SNFRR were considered to be 0.
3.6 Current Source Density
Current source density (CSD) analysis was employed to identify the depth of Layer IV as previously published7–9. CSD was performed by computing the average stimulus-locked LFP at each site, and then calculating the second spatial derivative59,60. CSD analysis determination of Layer IV was supplemented by examining the polarity inversion of LFPs61. The changes of electrode depth over time was also examined to identify tissue interface stability.
3.7 Impedance Spectroscopy
Electrochemical impedance spectra were measured immediately after each neural recording session. The implanted array was connected to an Autolab potentiostat with a 16-channel multiplexer. Impedance was measured for each channel using a 10 mV RMS sine wave from 10 Hz to 32 kHz, employing a 15 multisine paradigm. 1 kHz impedance is reported unless indicated otherwise.
3.8 Correlation Coefficients
Correlation coefficients between different metrics on the same electrode site were calculated using sample Pearson correlation and significance was determined with p<0.05. For SU SNR, firing rate SNR, and MUA amplitude, correlation coefficients were calculated to exclude samples that detected neither types of activity. When comparing with impedance or noise, two separate correlations were performed. In the first correlation, channels that did not detect corresponding units were excluded in the calculation. In the second correlation, correlation coefficients were calculated to include channels that did not detect corresponding neural activity.
3.9 Electrophysiological Artifact Analysis
Electrophysiological artifacts can be observed as activity that simultaneously occurs across multiple channels. Artifacts were identified using a custom MATLAB script, where spike stream data that exceeded the amplitude threshold and occurred simultaneously across at least 3 channels (+/− 0.05 ms) would proceed for further processing. Although it is theoretically possible that, given the 100µm separation between electrode sites, an evoked action potential may be recorded on three channels, it is unlikely that the signal amplitude would be appreciably greater than the recorded noise floors (~40µV)62. The temporal threshold (+/− 0.05 ms) was determined by manually assessing the amount of time elapsed between artifacts on different channels throughout the entire data stream. Only negative threshold crossing events were considered for this analysis. Artifacts per minute calculations were performed on 100 and 600 second epochs of recording data for awake, freely moving mouse and rat, respectively. Artifacts were quantified by counting the total number of artifacts within the recording epoch, and converting the time between each artifact to an estimated rate of artifacts per minute. Statistical analysis was performed on the distributions of estimated rates using a Wilcoxon Rank-Sum test.
3.10 Immunohistochemistry
Animals were deeply anesthetized using a 90 mg/kg ketamine, 9 mg/kg xylazine cocktail, and then transcardially perfused using a warm 1×PBS flush at ~70 mmHg followed by ice cold 4% paraformaldehyde at 70–90 mmHg. Following perfusion animals were decapitated and post-fixed in a 4% paraformaldehyde bath at 4°C for 4–6 hrs. Skulls with the headcap and brain were then isolated by removing the skin and muscle and soaked in a 15% sucrose bath at 4°C overnight followed by a 30% sucrose bath for 36–48 hours. Then, the bottom and sides of the skull was carefully dissected without damaging the brain, and the brain was gently lifted from the electrode array and headcap. Brains were then blocked and slowly frozen in a 2:1 20% sucrose in 1×PBS:’optimal cutting temperature compound’ (OTC; Tissue-Tek, Miles Inc., Elkhart, IN) blocking media on dry ice. Tissue was sectioned using a 25 µm slice thickness using a cryostat (CM1950 Leica, Buffalo Grove, IL).
Tissue sections were rehydrated with 1× phosphate buffer saline (PBS) (5 min washes), repeated twice. Antigen retrieval was carried out by incubating sections in a humidified chamber with pH 6.0, 0.01M sodium citrate buffer for 30 min at 60°C, followed by a peroxidase block performed in 1×PBS with 10% v/v methanol and 3% v/v hydrogen peroxide for 20 min on a table shaker. Next, tissue sections were blocked (5% goat serum, 0.1% triton X-100) for 30 min at room temperature and then intrinsic IgG was blocked with 0.1mg/ml AffiniPure Fab Fragment (Alexa-647 115-607-003 Jackson ImmunoResearch Laboratories, Inc.) or unconjugated Fab Fragment (115-007-003 Jackson ImmunoResearch Laboratories, Inc.) for 2 hours then vigorously rinsed 8 times with 1× PBS for 4 min/rinse.
Following blocking, sections were incubated in a primary antibody solution consisting of 5% goat serum, 0.1% triton X-100, and antibodies against neuronal nuclei (1:250 NeuN MAB377 Millipore), microglia (1:500 Iba-1 NC9288364 Fisher), Neurofilament (1:250 NF200 MAB5256 Millipore), GFAP (1:500 Z033401 DAKO), activated Caspase-3 (1:250 Asp175 9661S Cell Signaling), and/or tomato-plant lectin (1:200 B-1175 Vector Labs) for 18 hours at 4°C. Sections were then washed with PBS three times (5 min) and incubated in a secondary solution consisting of 5% goat serum, 0.1% triton X-100, and antibodies (1:500 goat anti-mouse Alexa 488, Invitrogen; goat anti-rabbit Alexa 568, Invitrogen; and/or Dylight 649 Streptavidin, Vector Labs) for two hours at room temperature. Then, sections were rinsed with PBS three times (5 min), and 1:1000 Hoechst 33342 (Invitrogen) for 10 minutes, and washed in 1×PBS three times (5 min) before being coverslipped with Fluoromount-G (Southern Biotech, Birmingham AL). Slides were imaged using confocal microscopy (FluoView 1000, Olympus, Inc., Tokyo, Japan) at 20× magnification.
For labeling synaptic transporters (Fig 10), tissue was collected and processed according to previously published methods42 in accordance with Michigan State University IACUC-approved methods. At their predetermined time point, animals were transcardially perfused with 200mL of PBS followed by 200mL of 4% paraformaldehyde. Brains were post-fixed in 4% paraformaldehyde overnight at 4C, sucrose protected, cryosectioned into 20um thick sections, and labeled with immunohistochemistry as described42. Primary antibodies included guinea pig anti-vesicular glutamate transporter 1 (VGLUT1; 1:500; Millipore Corporation, Billerica, MA), rabbit anti-vesicular GABA transporter (VGAT; 1:400; Millipore Corporation, Billerica, MA), rabbit anti-Nav1.6 (1:200; Alomone Labs, Jerusalem, Israel), rabbit anti-Kv1.1 (1:200; Alomone Labs, Jerusalem, Israel), and mouse anti-neurofilament heavy polypeptide (NF; 1:500; Abcam, Cambridge, MA). Secondary antibodies included goat anti-guinea pig IgG (H+L) alexa fluor 405 (1:200; Abcam, Cambridge, MA), goat anti-mouse IgG (H+L) alexa fluor 488 (1:200; Abcam, Cambridge, MA), and goat anti-rabbit IgG (H+L) alexa fluor 594 (1:200; Abcam, Cambridge, MA). Tissue sections were imaged with an MSU Olympus Fluoview 1000 Confocal Microscope using a 20× objective. Images were subsequently analyzed using a custom-modified MATLAB script adapted from (I.N.T.E.N.S.I.T.Y. v1.1)63 where modifications are fully described in their dissemination42.
Figure 10. Dynamic neurite sprouting following microelectrode insertions in V1 in Thy1-YFP mice.

In vivo multiphoton microscopy of YFP labeled neurites show growth cones near the microelectrode minutes after insertion. Overlay images show before (red) and after (green) for each pair of time points. Yellow indicates stationary features. Pink circles identify ‘elbows’ of neurites to show there is no bulk tissue movement around the implant. Pink arrowheads point to growth cones moving towards the implant. Depth of imaging is between 0–50 µm. Scalebar = 100 µm.
3.11 Scanning Electron Microscopy
After confocal imaging of stained probes, microelectrode arrays were mounted on copper tape and coated with 3nm of Gold/Palladium (60/40) using a Cressington 108auto sputter coater (Watford, UK). Traces on the microelectrodes were imaged on a JSM 6330F scanning electron microscope (SEM) (JEOL, Japan) at 3kV.
3.12 In Vivo Macroscopic Imaging
Images sensitive to neuronal activity were acquired from mice expressing GCaMP via virus transduction. Briefly, AAV-Syn-GCaMP6f obtained from the University of Pennsylvania Viral Vector Core was injected into the visual cortex of mice (<1µL) using a micro-pipette and pressure injector. Imaging was performed a couple of weeks later (i.e. 2–3) to allow for recovery and GCaMP expression. Changes in GCaMP fluorescence were recorded using an epifluorescence microscope (MVX-10; Olympus, Tokyo, Japan) and a digital-cooled CCD camera (CoolSnap HQ2; Photometrics, Princeton, NJ). GCaMP was excited using a white light source (Sola II, Lumencor, Inc; Beaverton, OR) and an appropriate fluorescence excitation filter (470±20 nm). The fluorescence emission (525±25 nm) was imaged over a field-of-view of 4×4 mm2 at a frame rate of 10 Hz in 5-min recording periods. The exposure time of the camera was set to 48 msec with a bin factor of 3 to increase signal-to-noise ratio (SNR) for an effective pixel resolution of 11 µm. The same microscope and optical path were used for optical imaging of intrinsic signal (OIS) sensitive to blood oxygenation (OIS-BOLD). Oblique light guides transmitting filtered light connected to a halogen light source (Thermo-Oriel, Stratford, CT) were used for illumination and a barrier filter was placed prior to the camera (620±5 nm, which corresponds to a spectral region dominated by deoxygenated hemoglobin light absorption64). Image pre-processing consisted of placing a region of interest (ROI) over the head plate to measure fluctuations in the light source unrelated to brain signals. The average time series from this ROI was regressed out from each pixel’s time series65. This corrected for most undesired baseline fluctuations as previously established66–71.
Two different experimental paradigms were considered during image acquisition. One consisted of placing a blue LED in front of the eye contra-lateral to the craniotomy (n=3). The LED was flashed for 2 sec every 16 sec at a frequency of 5 Hz (50% duty cycle). An image of the visual cortex activity was obtained by subtracting every image in a given repetition from its respective baseline image66. The baseline image consisted of the average image over the 2 sec period prior to LED onset. After averaging all the repeated trials, the visual stimulus activity image was obtained by averaging the differenced-images over the 2-sec LED stimulation period. The second experimental paradigm consisted of recording ongoing activity (n=5). Then, images of the mean and standard deviation were computed over the time dimension. Since ongoing brain activity produces changes in GCaMP and blood oxygenation signals, the coefficient of variance (ratio of the standard deviation and mean) was calculated to evaluate tissue activity and viability across the image72. In this fashion, high activity areas have large variance and low activity areas have low variance.
3.13 In Vivo Two-photon Imaging
A two-photon laser scanning microscope was used for in vivo imaging as previously published15,18–20. The microscope consisted of a scan head (Bruker, Madison, WI) and a laser (Mai Tai DS or Insight DS+; Spectra-Physics, Menlo Park, CA) providing 100 fs pulses at 80 MHz tuned to a wavelength of 920 nm for this study. Fluorescence was detected using non-descanned photomultiplier tubes (Hamamatsu Photonics KK, Hamamatsu, Shizuoka, Japan) using a 16×, 0.8 numerical aperture water immersion objective lens (Nikon Instruments, Melville, NY). Images with size of 1024 × 1024 pixels and field-of-view of 407 × 407 µm were acquired using PrairieView software at ~20 mW (never exceeding 40 mW). Stacks were acquired along depth every 3 µm.
For time series imaging, animals were anesthetized with 1.2% isoflurane with 1L/min O2 flow before being placed into the stereotaxic frame. Anesthesia was reduced as described in 2.2.1 and a blue LED was placed 1 cm from the contralateral eye. LED activation was controlled using a Master-9 controller and synchronized with the scan head using transistor-transistor logic (TTL). Images were collected at 3.5× digital zoom and image size of 256 × 256 pixels at a frame rate of 8 Hz. After a 20 second resting state period, the LED was illuminated for 1s every 5 seconds at 8 Hz with a pulse width of 10ms. Mean GCaMP activity and the standard deviation of GCaMP activity were calculated for the 20 s of resting state and 20 s window following 30 seconds of visual stimulation. Red blood cells moving through vasculature appear as diagonal streaks resulting from repeated laser line scans at high resolution. In this method, stagnant red blood cells appear as dark bands oriented orthogonal to the capillary walls. Velocity was estimated using the angle of the striations, according to methods from73.
4 Results
Despite extensive research on chronically implanted neural interfaces74, the biological tissue changes that occur surrounding the implant and its impact on the recorded signals remains unclear. Although impedance and noise are generally correlated over the chronic period (Fig.1a–d), large fluctuations in the correlation coefficient were observed over the first 60 days. Other recording performance metrics can fluctuate dramatically over time, and sometimes the relationships between them can invert (Fig 1e–g). For example, significant increases in firing rate (p<0.05) are produced by visually drifting gratings, however the changes in firing rate were variable. These metrics are depicted in detail over time and along cortical depth in a previous publication8. Here we focus on the correlations between metrics over time, and highlight their large variability.
Figure 1. Correlations of electrophysiological performance metrics can dramatically change over time.

a) Site-by-site analysis of correlation coefficients over the entire experimental time courses, taken from visually evoked, isoflurane anesthetized, head-fixed mice implanted with 16 channel silicon arrays in V1 (n=9). * indicates p<0.00005. # indicates p<0.05. b) Colormap in days for (c) and (e). c) Impedance against noise. Each point is color coated with time point. Solid black line shows the best-fit line for all time points. Colored dotted line shows best-fit line for corresponding time point. d) Linear regression and correlation coefficients for (c) against time. Note the linear regression coefficient increases over time before stabilizing beginning on day 70. Similarly, the correlation coefficient fluctuates until day 70. e) Relationships between various performance metrics over time. Evoked measurements taken after driving activity with a drifting grating stimulus. Colored points and lines are same as (c). Note: Some relationships can completely invert over time. This can be seen by the slopes of correlations changing sign (eg. SU SNR vs Impedance) or the correlation coefficients changing sign (eg. Fig.1 f). f) Correlation coefficient for evoked firing rate SNFRR and impedance shows large fluctuations between positive and negative correlation over time. g) Changes in correlation coefficients over time. Note: Correlation between SNR and noise is significant, however, the correlation is generally positive during early time points, but negative at later time points. Examination of relationships between recording and electrical performance metrics show challenges of using surrogate metrics such as impedance to predict chronic recording performance.
4.1. Electrophysiological artifacts in awake moving animals
Recording in awake, moving animals introduces motion artifacts, which can be observed after close examination of the spike filtered data. Artifacts appear as high amplitude voltage deflections which occur across multiple channels simultaneously (Fig 2a–f). Further, artifacts demonstrate high variability in shape and amplitude both between and within animals and channels (Fig2a–f, S Fig. 1a–c). In NHP, motion artifacts generally have large time constants, resulting in easily identifiable, non-electrophysiological signatures (Fig. 2g). However, in rodents, artifacts have shorter time constants, often leading to misclassification as action potentials (Fig. 2h–i).
4.2. Visual stimulus evokes widespread activity throughout visual cortex
Functional neurons can be quiescent due to a lack of excitatory synaptic input. These neurons are distinct from injured or degenerated neurons which can be silenced around an implant. Previous studies showed that driving activity with a passive reflexive response leads to the recording of additional SUs that are otherwise quiescent during resting state8 (Fig. 3a–e). This is further demonstrated using GCaMP labeled neurons in vivo, in which a larger population of neurons exhibit GCaMP transients following visual stimuli (Fig. 3f–g).
Figure 3. Healthy, quiescent neurons in isoflurane anesthetized mouse visual cortex are evoked with visual stimulus presentation.

a) Example channel showing the firing rate of only the unsorted outlier after automated spike sorting (multiunit: black). b) Same as (a) except visually evoked with a drifting grating movie. Auto-spike sorting discriminated a high amplitude, low firing SU (green) which increased firing rate during a mild visual stimulus (1 set of 8 direction stimulus for 4 s each). Note: First 15 s are movie calibration. c) Raw spike channel (300–5000 Hz) show increased spiking during the ‘ON’ phase of strong visual stimulus (8 set of 8 direction stimulus for 1 s each). d) PSTH of (c) showing increased firing during the ‘ON’ phase of the strong visual stimulus. Colors represent sorted (green, blue) and unsorted (black) threshold crossings. e) Pile plots of green and blue SU waveforms from (b) and (d) sorted using PCA and K-means clustering. a–e) Electrophysiological recording on the same recording site from the same day, 2 months post-implant. Reprinted from8, Copyright 2015, with permission from Elsevier. f) Average 20 s GCaMP6f activity in V1 and V2 layer II/III neurons during resting state (spontaneous) and visually driven via contralateral eye. g) Standard deviation of intensity changes of GCaMP6f activity during (f). Red * indicate quiescent neurons during resting state that were driven by visual stimulus.
4.3. Depth of functional layers shifts following implantation
Electrophysiological layers can be identified in sensory cortex using current source density7,8,61,75–78. When sensory activity is evoked, such as a visual response, the first current sink can be used to identify layer IV (Fig. 4d). However, the depth of electrophysiological layers does not remain constant. Previous studies7,8 have demonstrated that over chronic timescales, electrophysiological layers drift along the length of the electrode shank, even when the device is rigidly fixed to the skull (Fig. 4a–b). Further, the direction and magnitude of tissue drift varies between animals (Fig. 4b).
Figure 4. Challenges correlating electrophysiology and histology.

a–b) Average (a) and individual (b) depths of cortical layer IV, in mouse V1, where 0 represents the depth of layer IV on the day of insertion. Cortical layers drift along implants even when they are rigidly fixed to the skull. Therefore, it is not possible to correlate tissue sections to corresponding recording sites simply by tissue section depth. c) Linear silicon array next to coronal section of V1m (NeuN = green, Iba1 = red, Hoechst = blue, IgG = white). Histological cortical layers can be identified by the morphology and density of neurons. d) Current source density following presentation of visual stimulus (drifting grating) can be used to identify electrophysiological cortical layers. Current sinks are observed in L4, followed by L2/3, then L5, and then CA1. Representative CSD was recorded from isoflurane anesthetized mouse. (c) and (d) can be used to correlate histological outcomes to corresponding electrophysiological performance at the endpoint. Reprinted from8, Copyright 2015, with permission from Elsevier.
4.4. Recording performance disparity for implants with ideal histology
In previous work, an implant with normal appearing histology and very low impedance demonstrated recording failure (Fig. 5)7. The tissue showed no BBB leakage, high density of neurons around the implant without caspase-3 co-labeling, limited astrocyte activation, and no microglial encapsulation (Fig. 5a)9. The recording site detected high SNR single units (>6 SNR) over the first week, but single unit recordings failed after the first week and significant SNFRR failed after the first 42 days. The latter coincided with a dramatic drop in impedance and noise floor after the first 42 days of recording. SEM analysis of the explanted electrode showed that the SiOx insulation layer had cracked around the electrode site, leaving the polycrystalline silicon electrical trace material partially exposed. While the histology, electrophysiology, and material integrity data have been previously published separately7,9, here we show results for the corresponding dataset together for the first time.
Figure 5. Ideal histology from silicon microelectrodes does not guarantee good recording performance.

a) Immunohistochemistry of tissue surrounding implant site in mouse V1, showing no BBB leakage, good neural density, minimal astrocyte activation, and no microglial encapsulation 133 days post implant. Recording site is on the left face of the shank. Reprinted from7, Copyright 2014, with permission from Elsevier. b) Electrical performance outcomes of electrode site corresponding to (a) shows good SU SNR for the first week only, and loss of MUA activity after the first 40 days. Impedance and noise floor steadily increase for the first 40 days, then rapidly decline below pre-implant levels. SEM analysis indicates complete degradation of the silicon oxide insulation and cracking of the polycrystalline silicon traces near the iridium recording sites led to decreases in impedances and detected neural signals. Reprinted from9, Copyright 2015, with permission from Elsevier.
4.5 Recording disparity even after accounting for material failure
Histological samples were properly aligned to their corresponding electrode sites, and explanted arrays found to be intact, yet disparity between electrophysiological performance and histological outcomes can still persist (n=2) (Fig. 6). SEM shows that the silicon oxide insulation is intact and without cracks (Fig. 6a), which is also confirmed by the impedance. Immunohistochemistry staining of the explanted probe shows no glial adhesion and minimal immunoglobulin adsorption (Fig. 6b). Despite this, recording performance showed limited sporadic SU detection, with a loss of recording 6 weeks prior to sacrifice (Fig. 6c). Impedance analysis supports the SEM data showing reasonable values (pre-implant<Impedance<1.5 MΩ: Fig. 6d). Additionally, approximately 50 neurons can be counted within a 100 micron radius from the electrode site, and approximately 150 neurons can be counted within a 160 micron radius of the electrode site in this 25 micron tissue section. (Fig. 6e). The proximity of NeuN labeling does not guarantee the ability to recording single unit activity.
Figure 6. Loss of recording performance in mouse V1 without material degradation or loss of neural density.

a) SEM showing intact electrical traces. b) Immunohistochemistry on probe (a) showing no tissue adhesion. c) No SU were detected on (a) 6 weeks prior to animal sacrifice. d) Impedance of (a) remain in good range and does not dip below pre-implantation levels. e) Immunohistochemistry of tissue section corresponding to (a-d) (NeuN = green, Iba1 = red, Hoechst = white, IgG = blue). Recording site faces left on the shank. Some IgG is present around the implant, but there is limited microglial scarring and high density of neurons (50 neurons with 100 µm of the recording site and 150 neurons within 160 µm). (e) reprinted from7, Copyright 2014, with permission from Elsevier. Scalebar = 100 µm
5 Discussion
5.1. Experimental, biological, and material confounds call for a detailed, systematic analysis of the device-tissue interface
Implantable microelectrodes continue to be indispensable instruments for neuroprosthetic interfaces and neuroscience research, but they often experience immense variability in recording performance. Over chronic timescales, we observed dramatically changing correlations between recording performance metrics. This can be attributed to the complex interplay between materials, mechanical, biological and electrical mechanisms of failure2,5,9,10,79. For example, the dramatic decrease in impedance, firing rate, amplitude and noise observed at 60 days (Fig. 1) suggests that a number of electrodes have experienced degradation of the insulation layer, which leads to an increase in the electrode’s exposed surface area. The impedance across a larger electrode site can be modeled as a group of smaller area resistor-capacitor elements connected in parallel. As the magnitude of the recorded voltage from a neuronal point source is proportional to 1/rx (where r is distance from the source and 1 < x < 2), lower voltages are recorded in the resistor-capacitor elements located further from the source. In this fashion, the total recorded voltage is averaged across parallel elements, and ultimately results in a decrease in impedance, noise and unit amplitude (see10 for review). However, other failure modes may still contribute to the variability seen at other time points throughout the study. For example, neurodegeneration surrounding the implant6,80 may contribute to a decrease in firing rate and amplitude; gliosis increases impedance and isolates the device from surrounding neurons81–83, which increases noise and decreases amplitude, firing rate, and SNR; and electrode site delamination may cause an increase in impedance, and a decrease in amplitude and firing rate10. Interestingly, the strong relationship between SU and MU amplitude and noise (Fig. 1e), suggests that SNR may be a less informative recording performance metric, as signal amplitude and noise co-vary. However, this relationship is also likely dominated by the degradation of the insulation layer, which decreases both amplitude and noise. Future studies should aim to examine this relationship, and account for the impact of material failure on the predictive validity of SNR. Altogether, these data demonstrate that a thorough examination of recording performance metrics alone is not sufficient in the assessment of device or tissue functionality.
Neural interfaces are also subject to high variability in histological outcomes. This has been demonstrated within and between animals, even with the same array types5,7–9,84,85. The magnitude of the initial BBB injury, for instance, is influenced by implant location and whether it severs large underlying blood vessels or only small capillaries14. This variability is further compounded by variability of the tissue response and recording performance at the same coordinates in different animals, and at different depths within the same animal23,85. Therefore, in order to accurately correlate histological and electrophysiological results, it is necessary to employ a detailed, systematic approach to mitigate potential confounds and variability.
5.1.1. Sources contaminating electrophysiology
Recently, there has been a growing interest in recording from M1 in awake, freely-moving rodents, as this area provides a potential resource for future clinical applications in neural prosthetic devices. However, motion artifacts can skew interpretations of recording performance by embellishing or masking recorded action potentials. Additionally, standard signal processing techniques, such as application of a filter to remove LFPs, or utilization of common average referencing (CAR) to improve SNR56, can alter the shape of artifacts. For example, application of a Butterworth filter will alter movement artifacts in ways that resemble action potential waveforms (S. Fig 1a, b, d, e). Similarly, CAR, which has been noted to mitigate motion artifacts56, can alter the shape and amplitude of artifacts such that the residual motion artifact more closely resemble action potentials waveforms (S. Fig1b, c, f). We found that single units maintained their waveform shape (and principal component) after the application of CAR, while artifacts showed changes in shape or amplitude (S. Fig. 1f, g). This change in shape, seen in artifacts but not action potentials, may represent a potential strategy to isolate artifacts, and warrants a more thorough investigation. However, CAR and PCA alone were unable to completely eliminate the incidence of artifacts in either silicon or carbon fiber arrays. Artifacts appear to be more common in flexible carbon fiber arrays compared to rigid silicon arrays (S. Fig. 2, n=2). This may suggest that flexible devices are more prone to artifact contamination, though more data is needed to substantiate this claim. In addition, further advances in headstage pre-amplifiers may attenuate these issues, including high-bandwidth high-channel count integrated wireless headstages.
The proposed method used for artifact detection is solely intended for demonstration. For example, the capabilities of other commonly used clustering algorithms to eliminate artifacts have yet to be explored. Additionally, there are other potential sources of noise that can result in electrophysiological artifacts observed across channels that may be related to motion, such as wire or electrode bending, EMG and faulty head caps. Synchronicity across channels from true electrophysiological activity are usually related to sleep (i.e. sleep spindles)86. However, sleep spindles are unlikely to have been observed in this study, as the data for Figures 2 and S1–2 were recorded from awake, moving animals. In a control phantom experiment, slight movement of electrically isolated wires generated similar artifacts (S Fig. 3), indicating that wires or wire bundle movement contributes to these artifacts. Future work should more extensively characterize the sources of these artifacts and develop more thorough methods of artifact identification and elimination.
Beyond CAR and methods of artifact removal, many groups behaviorally train animals to remain stationary for short periods of time, such as in cue discrimination tasks. However, behavioral training of animals introduces the potential for the Experimenter Expectancy Effect35, which occurs when the experimenter’s bias of expected outcomes leads to unconscious and subtle behavior cues that ultimately reinforce the expected performance outcome. These biases and electrophysiological artifacts can be minimized by evaluation of recording performance from reflexive sensory regions in lightly anesthetized or awake head-fixed animals, such as monocular V1 cortex.
5.1.2. Driving healthy, but quiescent neurons
As recording performance is often evaluated in the motor cortex of anesthetized rodents, a lack of spike recording can be difficult to interpret. Nearby neurons may be degenerated and impaired, or silenced, due to resultant trauma from insertion87,88. Alternatively, they may be healthy but quiescent, since the animal is unconscious and not engaging motor cortex activity. One advantage of recording from the visual cortex, is the ability to drive neural activity with a visual stimulus in order to identify functional neurons under light anesthesia. Electrophysiological data from a previous study showed that driving visually evoked potentials can produce high amplitude single units which were quiescent otherwise8. The addition of visually evoked GCaMP transients in V1 and V2, demonstrates the spatial density of this phenomenon throughout the visual cortex (Fig. 3fg). Driving activity by means such as sensory input can thus help distinguish healthy, quiescent neurons from damaged, silenced neurons, and ultimately provide more insight into the health of the surrounding tissue. Additional experimental paradigms may be employed to further characterize the viability of silenced neurons such as an unnaturally strong stimulus including optogenetics or KCl.
5.1.3. Alignment of recording performance to histology
Cortical tissue cannot be assumed to be histologically homogenous. For example, layer I of the visual cortex is sparsely populated by neurons, while layer IV is densely populated by neurons with smaller cell bodies, and layer V contains neurons with larger cell bodies that are more sparsely distributed than in layer IV (Fig. 4c). As depth of specific electrophysiological layers has been shown to drift along the shank over chronic time points7,8 (Figure 4a–b), it is insufficient to correlate recording performance to tissue sections based on implant position on the day of implantation. Instead, histological outcomes need to be geometrically aligned to their corresponding electrode sites, based on electrophysiology recorded at the end-point. Specific alignment, and detailed retrospective analysis, allows for more meaningful interpretations concerning the relationship between recording performance and tissue health6,11–13,25,80,89–94.
5.1.4. Material failure can impact recording performance
After tissue has been properly aligned to its corresponding electrode sites, using current source density from the endpoint and neuronal morphology, comparison of histological and electrophysiological data can still result in unexpected outcomes. In many cases, material failure of electrode sites, traces, and insulation can explain performance decline in the absence of gross histopathological sequela (Fig. 5), as previously explored3,32,33,95,96. In this case, the drop in impedance can most likely be explained by the degradation of the insulation layer without breaking the electrode trace, as discussed above.
5.1.5. Disparate electrophysiology and histology, in the absence of material failure, suggests that additional biological mechanisms plague the device-tissue interface
As biological, mechanical, and material factors each influence recording performance, accurate correlations between histology and recording performance can be difficult to make. In this study, we systematically minimized potential confounds and sources of variability by recording from V1 in anesthetized, head-fixed animals; driving activity with a visual stimulus; aligning electrode sites to electrophysiological depths using CSD at the endpoint; and inspecting the explanted probe with SEM. Post-mortem histology in two animals revealed high NeuN density with minimal tissue damage, yet their corresponding electrode sites demonstrated poor recording performance (Fig. 6). Given the density of neurons around the implant (Fig. 6e), and the density of visually evoked neurons (Fig. 3fg), an intact microelectrode might be expected to record some single unit activity if these neurons were merely quiescent. The present disparity between histology and recording performance suggests that neurons surrounding the array had become silenced, or otherwise impaired, in a manner that is undetectable with traditional histological metrics. Therefore, it is necessary to investigate the device tissue interface in order to understand these biological failure modes and engineer intervention strategies that may ultimately have an impact on functional tissue recovery.
5.2. GCaMP activity and hemodynamics reveals the interplay between neuronal firing and vascular support
While electrophysiology allows for the quantification of action potentials from nearby neurons and histology can verify the spatial presence of neurons, these methods lack spatiotemporal information to determine the functional tissue status surrounding implants. To assess functional neural activity and health around implanted electrode devices, viral transduction of GCaMP6 in mice was performed to label neurons. Macroscopic evaluation shows consistent and measurable GCaMP6 labeling two weeks after injection, indicating sustained GCaMP6 expression in neurons (Figures 7b and 8a). Electrodes were implanted 3–6 weeks after viral injections. Different modes of activity were recorded to evaluate the impact of electrode implantation on brain function. Visual stimulation produced robust increases in GCaMP fluorescence in visual cortex prior to electrode implantation (Fig. 7a). On the day of implantation, evoked activity was clearly detected in visual cortex around the vicinity of the electrode (Fig. 7c–d day 0). However, neural activity, as reported by GCaMP6 intensity, gradually declined, and became silent or undetectable around the implant after two weeks (Fig. 7c–d: N=2). These findings confirm the widely accepted notion that implanted intracortical electrodes eventually erode activity from tissue around the implant.
Figure 7. Decreased neural activity evoked by visual stimulation around the implant of lightly anesthetized AAV-Syn-GCaMP6f mice.

a) Representative difference image sequence showing GCaMP increases in visual cortex during visual stimulation, prior to 4 shank silicon electrode implantation. The image sequence was generated by subtracting a pre-stimulation baseline image (e.g. left-most image in the row) from subsequent images (t>0s). The blinking LED visual stimulus was presented while the images outlined in the blue rectangle were acquired. b) Images of GCaMP expression on the day of implantation and the following two weeks, showing no noticeable changes in GCaMP expression around the implanted electrode. c) Visual activity maps obtained as shown in (a). Bright areas show increases in GCaMP signal evoked by visual stimulation around the implanted area on the day of implantation. The increases in activity diminish over the bottom two shanks on Day 7, and the cortex around the implanted area appears unresponsive 14 days post-implantation. No obvious superficial injury or bleeding was observed post-implantation. d) Average ROI GCaMP timeseries at each time point, showing a marked decrease in visually evoked activity, as measured by GCaMP fluorescence, at day 14. Visual stimulation from 0 to 2 seconds. ROI denoted by teal rectangle in (c)
Figure 8. Longitudinal GCaMP expression and neuro-physiological variance in AAV-Syn-GCaMP6f mice post-insertion.

GCaMP and intrinsic optical imaging sensitive to changes in blood oxygenation levels (OIS-BOLD) were recorded post-implantation. a) Representative images of GCaMP fluorescence over time from one of the mice tested. No large changes in overall fluorescence or superficial injury is observed. The temporal coefficient of variance (COV) was computed as an indication of tissue activity level from GCaMP (b) and OIS-BOLD (c) signals. d,e) Average ROI GCaMP ΔF/F and OIS-BOLD ΔS/S at each time point. Decreases in the GCaMP and OIS-BOLD COV were observed at the implanted area. The change in GCaMP COV diminished relative to neighboring tissue 7 days post-implantation, while the changes in OIS-BOLD COV appeared indifferent from neighboring tissue 4 days post-implantation. The changes in OIS-BOLD suggest there was a transient decrease in blood oxygen supply post-implantation.
The neurovascular system is the critical infrastructure that delivers oxygen and nutrients to neurons, as well as removes neurotoxic waste products. Decreases in O2 and nutrient supply as well as accumulation of waste products may be a contributing factor associated with decreased neural activity in the injured tissue area. This is the premise behind the neurovascular coupling field which has experienced a rapid growth over the recent decades97. Here, the variance in activity across the exposed cortex was reported by GCaMP and blood oxygenation (Fig. 8b–c, n=5). Decreases in the GCaMP coefficient of variance, which represents decreases in ongoing neuronal activity, are visible on the day of implantation compared to areas further away from the implanted area (Fig. 8b). The same analysis performed using OIS-BOLD showed similar changes post-implantation; namely, decreases in blood oxygenation were observed around the implanted electrode on day 2. The decrease in blood oxygenation dissipated by day 4 and essentially returned to normal levels by day 7 (Fig. 8c). These findings suggest that implantation caused a local injury in the tissue where changes in blood oxygenation decreased. Further research is necessary to identify the mechanism behind the decreased blood oxygenation. This could be the result of decreased supply, such as from restricted blood flow, or an increase in metabolic consumption from apoptosis, debris removal, and/or upregulated tissue repair. This decrease subsided and continually improved several days post-implantation, which may suggest healing. Similar findings were observed from four other mice where decreases in GCaMP signal variance were evident at the implantation site and later normalized to levels similar to the surrounding tissue 2–3 weeks post-implantation. It is worth noting that the OIS-BOLD signal is an inherently weaker signal than the GCaMP, so the Δs/s is smaller compared to GCaMP. No evident superficial injury was observed post-implantation in any of the animals.
These results demonstrate that transient changes in neuronal activity and hemodynamics can be observed after implantation. It is plausible that restrictions in oxygen supply surrounding the implant could have some impact on the functional recovery of the damaged tissue. Additional studies are necessary to determine the overall impact of these hemodynamic changes on long term tissue health and chronic recording performance. While there are potential confounds associated with implantation of a cranial window, as this procedure is known to elicit a tissue response98, the window implantation procedure over an intracortical array is similar to headcap fixation procedure for chronic microelectrode implantation40. Moreover, the tissue reaction at the ‘electrode site’-tissue interface is the sum of the injury response and signaling molecules from the craniotomy and device insertion injury. Therefore, until such time that intracortical electrodes are routinely implanted without craniotomies and headcap fixation, the overall tissue response should be studied together40.
5.3. Alterations in excitatory/inhibitory tone at the implant interface
Another possible explanation for the inability to record evoked single unit activity from the electrode is that the neurons are not only quiescent, but that their excitability from external input is dampened somehow. For example, traumatic injury is known to produce pronounced effects on the excitability of nearby neurons, where underlying mechanisms include changes in ion channel expression, post-lesional axonal sprouting, and shifts in the relative population of excitatory and inhibitory synapses99–104. Post-mortem immunohistochemistry revealed new evidence for structural and functional changes at the implanted electrode interface (Fig 9a–b), where an initial elevation in the expression of an excitatory synaptic marker (VGLUT1) was followed by a relative shift to heightened labeling of an inhibitory transporter (VGAT) by the four week time point. This was coupled to increased interfacial neurofilament expression (Fig 9e)42,105, infiltration of progenitor cells105, and upregulation of synaptic adhesion molecules106, indicating axonal reorganization and potential axon sprouting107. Acutely, these structural and functional changes can produce hyperexcitability and seizure activity in cortical injury models108. Over time, increased inhibitory currents have been noted in these injury models109, suggesting a potential compensatory mechanism to dampen and confine the spread of aberrant activity or to reduce the metabolic consumption of nearby excitatory neurons during metabolically expensive tissue repair. More recent, previously unpublished work indicated that initially increased sodium channel expression at the device interface is followed by elevated potassium channel expression at later time points (Fig. 9c–d), supporting the idea that early hyperexcitability is followed by long-term hypoexcitability surrounding implanted electrode arrays2,7–9,29,30,93.
Figure 9. Evidence for plasticity in markers of excitability surrounding devices.

Immunohistochemistry at 3 days and 28 days post single shank silicon array implantation in rat primary motor cortex (n=11). a,b) At 3 days, VGLUT1 and VGAT are both significantly elevated (**p≤0.001) and VGLUT1 intensity is significantly greater than VGAT (**p≤0.001, within the first 40µm). By four weeks, VGAT intensity is significantly elevated (*p≤0.05) and is greater than VGLUT1 (*p≤0.05) in the first 40µm of the device. c,d) Early observations suggest that Nav1.6 expression is initially upregulated at the device interface, while Kv1.1 expression is increased surrounding the device by the four week time point (statistical analysis omitted due to limited sample size). e) NF is significantly elevated nearest the implant site based on quantitative immunohistochemistry (as previously reported42), suggesting possible axonal sprouting. White asterisk (*) – a,b,e) Adapted with permission from42. Copyright 2017, The American Physiological Society.
Combined with Figures 7–8, the results suggest that a halo of altered network activity exists immediately surrounding implanted electrode arrays, where the relative balance of excitation and inhibition progressively evolves and changes over time. This indicates that altered neuronal function surrounding devices accompanies well-known losses in neural density80,110. Indeed, it is possible that the tissue attempts to address the oxygen supply and metabolic demand mismatch by increasing the inhibitory:excitatory ion channel ratio to reduce nearby neuron’s activity, and thereby reduce the metabolic demand. In addition, this change may also explain the increase in metabolic consumption associated with the tissue injury response and increase in tissue repair. As a result, the nearby neurons would have a dampened ability to generate action potentials that can be recorded by the electrode. Despite these intrinsic network changes, a multitude of BCI studies, as well as our studies in rodent visual cortex, indicate that chronically implanted intracortical electrodes are still capable of recording and extracting functional information7–9,39,41,55,111–115. Nevertheless, large variability in device performance is well documented7–9,29,93,116. Further investigation remains necessary to elucidate the impact of these molecular level neuronal changes on recording failure or the information content of the recorded signal. (For example, it is possible that these tissue changes could, at least in part, be responsible for the silencing observed in Figure 6.)
Considering the complexity of neuronal connectivity and the possible emergence of non-intuitive effects from heightened excitation or inhibition (e.g., disinhibition, inhibition-induced synchronization of network activity117,118), it is possible that variability in neural function surrounding the implant may be responsible for variability in recording performance. Additional studies are necessary to elucidate the impact of the implant injury on the function of the neural network immediately surrounding these implants, as well as to interpret the net effect of changes in transporter expression on the functional neural network. As these molecular and cellular changes could affect signal detection by chronic recording arrays, changes in the function of residual neurons should be considered when evaluating the multi-modal sources of recording loss and instability. Novel device design and intervention strategies may better preserve the native function of the neural network, and improve overall neural interface performance.
5.4. In vivo multiphoton imaging reveals dynamic axonal injury within 6 hours post-implant
Dampening of neural activity may be influenced by decreased energy supply or molecular changes that alter the excitability of the neuron. In addition, other dynamic changes may influence the cellular activity or even the signal input to cells near the implant. While, post-mortem analysis can be a powerful tool for elucidating molecular and cellular changes to tissue surrounding implants, there are limitations in capturing transient changes to the tissue. This is particularly true for dynamic activity and subtle changes that are lost during tissue degeneration between the moments of transcardial saline perfusion flushing and paraformaldehyde fixation, as well as during tissue processing. In vivo microscale structural examination reveals information that is frequently lost during perfusion and tissue processing, or undetectable with histological analysis. Namely, dynamic and subtle changes in neurite morphology may be important indicators of neuronal trauma following probe implantation. Insertion of a neural probe can lead to the severing of axons and dendrites. In vivo multiphoton imaging in Thy1-YFP mice showed neurite growth cones growing towards the implant, presumably to restore severed connection, as early as 11 minutes post-implantation (Fig. 10, see supplemental movie). These growth cones were attached to cell bodies located in layer V, outside of the plane of imaging. This time course aligns with previous observations of regeneration following axotomy119. Future studies should aim to more comprehensively characterize the frequency and extent of neurite severing and repair, as well as the impact that these phenomena have on the signal input to neurons near the implant and overall device performance. It may be possible to promote neurite extension and repair of severed synapses given the proper environmental cue.
Besides severing axons and dendrites, probe insertion may stretch myelinated and unmyelinated axons, as shown in the cortex of CNP-eGFP mice. We observed that while there is tissue tear in the brain, many axons at the insertion site are deformed, but not severed (observed in 4 mice, data not shown). This corroborates previous findings that probes with sharp tips penetrate the cortex by mode I tear formation, in which tensile stress at the insertion site ultimately causes brain tissue to yield120,121. Over the subsequent hours post-implantation, oligodendrocyte myelin ensheathing axons formed membranous protrusions or ‘myelinosomes’, observed in all three animals in the study (Fig. 11b). Myelinosome protrusions have been documented as a mechanism for myelination during development122, as well as a hallmark of demyelination following induction of multiple sclerosis-like disease in mouse models123. To the author’s knowledge, this is the first report of myelinosome formation following microelectrode implantation injury. However, myelinosomes appear to shrink within 1 hr post-mortem suggesting that this information is difficult to capture in post-mortem immunohistochemistry.
Figure 11. In vivo multiphoton imaging in V1 of CNP-eGFP mice reveals myelin injury post insertion.

In the hours following implantation, oligodendrocyte membranous protrusions (yellow ellipses) form in the cortical layer I myelinated axons near the electrode shank (blue). Cyan chevrons point to cell bodies. Note that some membranous protrusions emerge as soon as one hour post insertion (a,c,d), while some emerge hours later (b). Additionally, some protrusions recede over time (b,f). These are possible indicators of myelin damage or remodeling. Scalebars a–b: 100 µm; c–f: 12 µm
Morphological indications of neurite damage extend to other animal models as well. In all five neuron-labeled animals in the study, neurites in the vicinity of the probe implantation site in cortical layers I and II/III formed spherical protrusions (sometimes referred to as ‘blebs’124) over the first 6 hours post implantation. These protrusions, seen in Thy1-YFP mice (n = 3), are rarely observed in tissue distant from the neural probe or in unimplanted tissue (Fig. 12a). Neurites of fatally injured neurons in 3D cultures exhibit similar morphological features following rapid compression injuries124. These findings are supported by observations from Thy1-GCaMP mice, which experienced heightened calcium influx in neurites post insertion (Fig. 12b; n = 5). Similar increases in calcium influx are known to contribute to cell injury and death following traumatic brain injury125. The in vivo fate of neurons and oligodendrocytes expressing protrusions and myelinosome injuries, as well as their impact on information transduction in the neural network have yet to be determined. Future studies are necessary to more thoroughly characterize bleb and myelinosome formation post insertion as well as their impact on the fate of the corresponding cells and on chronic recording performance.
Figure 12. Axonal protrusions/blebs form by 3h post-implant at the implantation site, but not apparent in distant regions (> 300µm from implant).

a) Top: 2-photon microscopy of the visual cortex of transgenic mice expressing YFP in neurons under the control of the Thy1 promoter (n=3) reveal axonal dysfunction in the vicinity of silicon implants (denoted by blue box) by 3h post–implant. Axonal protrusions (examples denoted by cyan >) display as bright spherical objects, typically 1–5µm in diameter. Bottom: Axons in distant regions (> 300µm from implant) have clear axonal cable morphology, with spines clearly visible perpendicular to neurites and no signs of protrusions. b) Top: Neuronal Ca++ activity reporter mice (Thy-1 GCAMP, n=5) show similar axonal distress to Thy-1 YFP reporter mice. Compared to the same region prior to implant, axons from 1–6h post implant are brightly labeled with GCAMP, indicating sustained Ca++ influx. Bottom: Comparatively, distant regions (> 300µm from implant) do not show any discernable GCAMP(+) axons. All images, depth of imaging: between 0–50 µm. All scale bars are 100 µm.
While direct injury can impact the activity of neurons as well as glial cells5, injury to the neurovascular network can also dramatically impact the health of the tissue and activity of the neural network near the injury5,14–16. Neural activity, neuronal degeneration, and vascular degeneration are impacted by the loss of blood flow perfusion5. When fluorescent vascular contrast agents are introduced prior to blood vessel occlusion, a decrease in perfusion can be observed near implants and can be identified within capillaries in the vicinity of the probes, as stagnant, dark red blood cells73 (Fig. 13). Loss of perfusion has previously been documented in capillaries surrounding neural probes126. Blood flow perfusion is critical to the health of the nearby cells as it is necessary for delivery of oxygen and nutrients as well as removal of neurotoxic waste products5. This is especially true for neurons that have high metabolic demands, but lack the molecular machinery to store glucose as glycogen. Therefore, these results provide cellular and subcellular evidence for the loss of neural activity and blood oxygenation around the implant shown in Figures 7–8. Current studies are aimed at identifying the variability and time course of the injury and repair as well as the impact on functional information transfer through the neural network surrounding the implant over time. A better mechanistic understanding of the molecular and cellular neurobiology that governs functional neural activity will likely create new opportunities in device design and identify new pathways for intervention strategies.
Figure 13. Loss of perfusion observed in capillaries near implant.

2 photon microscopy before (a) and after (b) silicon array insertion in visual cortex of Thy1-GCaMP mice. Capillaries with interrupted flow post-implantation are indicated by cyan ^. Stagnant red blood cells are observed as dark spots within the capillary. Vasculature labeled with intraperitoneal injection of SR101, depth of imaging: between 0–40 µm. Scale bars = 100 µm.
6 Conclusion
Implantable, intracortical arrays suffer from poor long-term reliability and variability2,7,85,116. Loss of recording performance over time is governed by a combination of biological and material failure modes. In order to explore these governing mechanisms, it is first necessary to eliminate sources of error and ambiguity, such as motion artifacts, identifying functional but quiescent neurons, precluding experimenter expectancy bias, ensuring material integrity of the implant, and carefully matching each histological section to their corresponding electrode sites. Even after confirming that an explanted device remained intact, animals may display nearly normal histology yet exhibit poor recording performance in the corresponding recording site. This disparity between the histological outcome and electrophysiological recording performance asserts that post-mortem histological analysis often fails to characterize key biological features that impact electrophysiology. These findings point to the underlying need for more detailed in vivo studies to elucidate the neurobiology governing the tissue-implant interface.
Recent efforts in Neural Engineering have emphasized novel engineering approaches to improve long-standing problems with chronic neural interfaces. However, a deeper understanding of the neurobiology that governs tissue health is needed to identify new strategies for improving engineered interfaces. This work highlights that the biological mechanisms at the interface are more complex than previously proposed, and that classical NeuN, Iba1, GFAP, and IgG histological metrics provide a limited perspective regarding both neuronal health and the ability of intact microelectrodes to record functional electrophysiological activity. Our findings reveal a complex environment in which decreases in neural activity in the tissue surrounding the implant may be accompanied by a temporary decrease in blood oxygenation. Cellular level investigation showed acute interruption of blood flow in capillaries near the implant, as well as axonal damage and deformation, myelinosome formation, and neurite severing/sprouting. Molecular level analysis revealed a shift in heightened expression of excitatory transporters and channels to inhibitory transporters and channels over time. Altogether, this multi-scale and multi-modal approach begins to shed light on the complex and dynamic nature of the molecular and cellular level response at the neuroelectronic interface, which contributes to neuronal silencing and alteration of network activity around the implant. Approaches that sequester the injury from spreading, attenuate metabolic burden of injured tissue, and facilitate intrinsic tissue repair mechanisms, will help identify new opportunities for improved neural implant device designs.
Supplementary Material
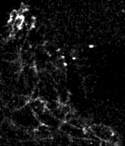
Acknowledgments
This work was supported by NIH NINDS R01NS094396, R01NS094404, R01NS062019, and R01NS089688. The authors would like to thank Paras R Patel for providing the rat electrophysiology data.
Footnotes
References
- 1.Schwartz AB. Cortical neural prosthetics. Annual Review of Neuroscience. 2004;27:487–507. doi: 10.1146/annurev.neuro.27.070203.144233. [DOI] [PubMed] [Google Scholar]
- 2.Barrese JC, et al. Failure mode analysis of silicon-based intracortical microelectrode arrays in non-human primates. J Neural Eng. 2013;10:066014. doi: 10.1088/1741-2560/10/6/066014. [DOI] [PMC free article] [PubMed] [Google Scholar]
- 3.James CB, Juan A, John PD. Scanning electron microscopy of chronically implanted intracortical microelectrode arrays in non-human primates. Journal of Neural Engineering. 2016;13:026003. doi: 10.1088/1741-2560/13/2/026003. [DOI] [PMC free article] [PubMed] [Google Scholar]
- 4.Takmakov P, et al. Rapid evaluation of the durability of cortical neural implants using accelerated aging with reactive oxygen species. Journal of neural engineering. 2015;12:026003. doi: 10.1088/1741-2560/12/2/026003. [DOI] [PMC free article] [PubMed] [Google Scholar]
- 5.Kozai TDY, Jaquins-Gerstl A, Vazquez AL, Michael AC, Cui XT. Brain Tissue Responses to Neural Implants Impact Signal Sensitivity and Intervention Strategies. ACS Chemical Neuroscience. 2015;6:48–67. doi: 10.1021/cn500256e. [DOI] [PMC free article] [PubMed] [Google Scholar]
- 6.McConnell GC, et al. Implanted neural electrodes cause chronic, local inflammation that is correlated with local neurodegeneration. J Neural Eng. 2009;6:56003. doi: 10.1088/1741-2560/6/5/056003. [DOI] [PubMed] [Google Scholar]
- 7.Kozai TDY, et al. Effects of caspase-1 knockout on chronic neural recording quality and longevity: Insight into cellular and molecular mechanisms of the reactive tissue response. Biomaterials. 2014;35:9620–9634. doi: 10.1016/j.biomaterials.2014.08.006. [DOI] [PMC free article] [PubMed] [Google Scholar]
- 8.Kozai TDY, et al. Comprehensive chronic laminar single-unit, multi-unit, and local field potential recording performance with planar single shank electrode arrays. Journal of Neuroscience Methods. 2015;242:15–40. doi: 10.1016/j.jneumeth.2014.12.010. [DOI] [PMC free article] [PubMed] [Google Scholar]
- 9.Kozai TDY, et al. Mechanical failure modes of chronically implanted planar silicon-based neural probes for laminar recording. Biomaterials. 2015;37:25–39. doi: 10.1016/j.biomaterials.2014.10.040. [DOI] [PMC free article] [PubMed] [Google Scholar]
- 10.Wellman SM, et al. A Materials Roadmap to Functional Neural Interface Design. Advanced Functional Materials. 2017 doi: 10.1002/adfm.201701269. [DOI] [PMC free article] [PubMed] [Google Scholar]
- 11.Saxena T, et al. The impact of chronic blood-brain barrier breach on intracortical electrode function. Biomaterials. 2013 doi: 10.1016/j.biomaterials.2013.03.007. [DOI] [PubMed] [Google Scholar]
- 12.Ravikumar M, et al. The roles of blood-derived macrophages and resident microglia in the neuroinflammatory response to implanted intracortical microelectrodes. Biomaterials. 2014;35:8049–8064. doi: 10.1016/j.biomaterials.2014.05.084. [DOI] [PMC free article] [PubMed] [Google Scholar]
- 13.Potter KA, et al. The effect of resveratrol on neurodegeneration and blood brain barrier stability surrounding intracortical microelectrodes. Biomaterials. 2013;34:7001–7015. doi: 10.1016/j.biomaterials.2013.05.035. [DOI] [PubMed] [Google Scholar]
- 14.Kozai TD, et al. Reduction of neurovascular damage resulting from microelectrode insertion into the cerebral cortex using in vivo two-photon mapping. Journal of neural engineering. 2010;7:046011. doi: 10.1088/1741-2560/7/4/046011. [DOI] [PMC free article] [PubMed] [Google Scholar]
- 15.Kozai TDY, Vazquez AL, Weaver CL, Kim SG, Cui XT. In vivo two photon microscopy reveals immediate microglial reaction to implantation of microelectrode through extension of processes. J Neural Eng. 2012;9 doi: 10.1088/1741-2560/9/6/066001. [DOI] [PMC free article] [PubMed] [Google Scholar]
- 16.Kozai TDY, et al. Ultrasmall implantable composite microelectrodes with bioactive surfaces for chronic neural interfaces. Nat Mater. 2012;11:1065–1073. doi: 10.1038/nmat3468. [DOI] [PMC free article] [PubMed] [Google Scholar]
- 17.Bjornsson CS, et al. Effects of insertion conditions on tissue strain and vascular damage during neuroprosthetic device insertion. J Neural Eng. 2006;3:196–207. doi: 10.1088/1741-2560/3/3/002. [DOI] [PubMed] [Google Scholar]
- 18.Kozai TD, Jaquins-Gerstl AS, Vazquez AL, Michael AC, Cui XT. Dexamethasone retrodialysis attenuates microglial response to implanted probes in vivo. Biomaterials. 2016;87:157–169. doi: 10.1016/j.biomaterials.2016.02.013. [DOI] [PMC free article] [PubMed] [Google Scholar]
- 19.Eles JR, et al. Neuroadhesive L1 coating attenuates acute microglial attachment to neural electrodes as revealed by live two-photon microscopy. Biomaterials. 2017;113:279–292. doi: 10.1016/j.biomaterials.2016.10.054. [DOI] [PMC free article] [PubMed] [Google Scholar]
- 20.Kozai TDY, Eles JR, Vazquez AL, Cui XT. Two-photon imaging of chronically implanted neural electrodes: Sealing methods and new insights. Journal of Neuroscience Methods. 2016;256:46–55. doi: 10.1016/j.jneumeth.2015.10.007. [DOI] [PMC free article] [PubMed] [Google Scholar]
- 21.Kozai TDY, Vazquez AL. Photoelectric artefact from optogenetics and imaging on microelectrodes and bioelectronics: New Challenges and Opportunities. Journal of Materials Chemistry B. 2015;3:4965–4978. doi: 10.1039/C5TB00108K. [DOI] [PMC free article] [PubMed] [Google Scholar]
- 22.Lee JM, Grabb MC, Zipfel GJ, Choi DW. Brain tissue responses to ischemia. J Clin Invest. 2000;106:723–731. doi: 10.1172/JCI11003. [DOI] [PMC free article] [PubMed] [Google Scholar]
- 23.Stensaas SS, Stensaas LJ. The reaction of the cerebral cortex to chronically implanted plastic needles. Acta Neuropathol. 1976;35:187–203. [PubMed] [Google Scholar]
- 24.Holecko MM, 2nd, Williams JC, Massia SP. Visualization of the intact interface between neural tissue and implanted microelectrode arrays. J Neural Eng. 2005;2:97–102. doi: 10.1088/1741-2560/2/4/005. [DOI] [PubMed] [Google Scholar]
- 25.Woolley AJ, Desai HA, Steckbeck MA, Patel NK, Otto KJ. In situ characterization of the brainmicrodevice interface using device-capture histology. J Neurosci Methods. 2011;201:67–77. doi: 10.1016/j.jneumeth.2011.07.012. [DOI] [PMC free article] [PubMed] [Google Scholar]
- 26.Zhang Y, et al. 3D imaging of optically cleared tissue using a simplified CLARITY method and on-chip microscopy. Sci Adv. 2017;3:e1700553. doi: 10.1126/sciadv.1700553. [DOI] [PMC free article] [PubMed] [Google Scholar]
- 27.McCreery D, Cogan S, Kane S, Pikov V. Correlations between histology and neuronal activity recorded by microelectrodes implanted chronically in the cerebral cortex. J Neural Eng. 2016;13:036012. doi: 10.1088/1741-2560/13/3/036012. [DOI] [PMC free article] [PubMed] [Google Scholar]
- 28.Suner S, Fellows MR, Vargas-Irwin C, Nakata GK, Donoghue JP. Reliability of signals from a chronically implanted, silicon-based electrode array in non-human primate primary motor cortex. IEEE transactions on neural systems and rehabilitation engineering : a publication of the IEEE Engineering in Medicine and Biology Society. 2005;13:524–541. doi: 10.1109/TNSRE.2005.857687. [DOI] [PubMed] [Google Scholar]
- 29.Jiang J, Willett FR, Taylor DM. Engineering in Medicine and Biology Society (EMBC), 2014 36th Annual International Conference of the IEEE. IEEE; 2014. Relationship between microelectrode array impedance and chronic recording quality of single units and local field potentials; pp. 3045–3048. [DOI] [PubMed] [Google Scholar]
- 30.Purcell EK, Thompson DE, Ludwig KA, Kipke DR. Flavopiridol reduces the impedance of neural prostheses in vivo without affecting recording quality. J Neurosci Methods. 2009;183:149–157. doi: 10.1016/j.jneumeth.2009.06.026. [DOI] [PubMed] [Google Scholar]
- 31.Malaga KA, et al. Data-driven model comparing the effects of glial scarring and interface interactions on chronic neural recordings in non-human primates. Journal of neural engineering. 2015;13:016010. doi: 10.1088/1741-2560/13/1/016010. [DOI] [PubMed] [Google Scholar]
- 32.Prasad A, et al. Abiotic-biotic characterization of Pt/Ir microelectrode arrays in chronic implants. Front Neuroeng. 2014;7:2. doi: 10.3389/fneng.2014.00002. [DOI] [PMC free article] [PubMed] [Google Scholar]
- 33.Gilgunn PJ, Xiao Chuan O, Flesher SN, Schwartz AB, Gaunt RA. Structural analysis of explanted microelectrode arrays; Neural Engineering (NER), 2013 6th International IEEE/EMBS Conference on; 2013. pp. 719–722. [Google Scholar]
- 34.Wellman SM, et al. A Materials Roadmap to functional Neural Interface Design. Advanced Functional Materials. doi: 10.1002/adfm.201701269. ((accepted)) [DOI] [PMC free article] [PubMed] [Google Scholar]
- 35.Rosenthal R, Fode KL. The effect of experimenter bias on the performance of the albino rat. Systems Research and Behavioral Science. 1963;8:183–189. [Google Scholar]
- 36.Kozai TD, et al. Ultrasmall implantable composite microelectrodes with bioactive surfaces for chronic neural interfaces. Nat Mater. 2012;11:1065–1073. doi: 10.1038/nmat3468. [DOI] [PMC free article] [PubMed] [Google Scholar]
- 37.Kozai TDY, et al. Ultrasmall implantable composite microelectrodes with bioactive surfaces for chronic neural interfaces. Nat Mater. 2012;11:1065–1073. doi: 10.1038/nmat3468. [DOI] [PMC free article] [PubMed] [Google Scholar]
- 38.Kozai TD, et al. Comprehensive chronic laminar single-unit, multi-unit, and local field potential recording performance with planar single shank electrode arrays. J Neurosci Methods. 2014;242C:15–40. doi: 10.1016/j.jneumeth.2014.12.010. [DOI] [PMC free article] [PubMed] [Google Scholar]
- 39.Kozai TDY, et al. Chronic In Vivo Evaluation of PEDOT/CNT for Stable Neural Recordings. IEEE transactions on bio-medical engineering. 2016;63:111–119. doi: 10.1109/TBME.2015.2445713. [DOI] [PMC free article] [PubMed] [Google Scholar]
- 40.Kozai TD, Eles JR, Vazquez AL, Cui XT. Two-photon imaging of chronically implanted neural electrodes: Sealing methods and new insights. J Neurosci Methods. 2016;258:46–55. doi: 10.1016/j.jneumeth.2015.10.007. [DOI] [PMC free article] [PubMed] [Google Scholar]
- 41.Williams JJ, Tien RN, Inoue Y, Schwartz AB. Idle state classification using spiking activity and local field potentials in a brain computer interface; 2016 38th Annual International Conference of the IEEE Engineering in Medicine and Biology Society (EMBC); 2016. pp. 1572–1575. [DOI] [PubMed] [Google Scholar]
- 42.Salatino JW, Winter BM, Drazin MH, Purcell EK. Functional Remodeling of Subtype-Specific Markers Surrounding Implanted Neuroprostheses. J Neurophysiol. 2017 doi: 10.1152/jn.00162.2017. jn 00162 02017. [DOI] [PMC free article] [PubMed] [Google Scholar]
- 43.Patel PR, et al. Chronic In Vivo Stability Assessment of Carbon Fiber Microelectrode Arrays. J Neural Eng. 2016;13:066002. doi: 10.1088/1741-2560/13/6/066002. [DOI] [PMC free article] [PubMed] [Google Scholar]
- 44.Patel PR, et al. Insertion of linear 8.4 µm diameter 16 channel carbon fiber electrode arrays for single unit recordings. Journal of neural engineering. 2015;12:046009. doi: 10.1088/1741-2560/12/4/046009. [DOI] [PMC free article] [PubMed] [Google Scholar]
- 45.Patel PR, et al. Chronic In Vivo Stability Assessment of Carbon Fiber Microelectrode Arrays. In Review. 2016 doi: 10.1088/1741-2560/13/6/066002. [DOI] [PMC free article] [PubMed] [Google Scholar]
- 46.Brainard DH. The Psychophysics Toolbox. Spat Vis. 1997;10:433–436. [PubMed] [Google Scholar]
- 47.Cornelissen FW, Peters EM, Palmer J. The Eyelink Toolbox: eye tracking with MATLAB and the Psychophysics Toolbox. Behav Res Methods Instrum Comput. 2002;34:613–617. doi: 10.3758/bf03195489. [DOI] [PubMed] [Google Scholar]
- 48.Kleiner M, Brainard DH, Pelli DG. What's new in Psychtoolbox-3? Perception. 2007;36 ECVP Abstract Supplement. [Google Scholar]
- 49.Brainard DH. The Psychophysics Toolbox. Spat. Vision. 1997;10:433–436. [PubMed] [Google Scholar]
- 50.Kleiner M, Brainard DH, Pelli DG. What's new in Psychtoolbox-3? Perception 36 ECVP Abstract Supplement. 2007 [Google Scholar]
- 51.Pelli DG. The VideoToolbox software for visual psychophysics: Transforming numbers into movies. Spat. Vision. 1997;10:437–442. [PubMed] [Google Scholar]
- 52.Goncalves JT, Anstey JE, Golshani P, Portera-Cailliau C. Circuit level defects in the developing neocortex of Fragile X mice. Nature neuroscience. 2013;16:903–909. doi: 10.1038/nn.3415. [DOI] [PMC free article] [PubMed] [Google Scholar]
- 53.Mukamel EA, et al. A transition in brain state during propofol-induced unconsciousness. The Journal of neuroscience : the official journal of the Society for Neuroscience. 2014;34:839–845. doi: 10.1523/JNEUROSCI.5813-12.2014. [DOI] [PMC free article] [PubMed] [Google Scholar]
- 54.Hudson AE, Calderon DP, Pfaff DW, Proekt A. Recovery of consciousness is mediated by a network of discrete metastable activity states. Proceedings of the National Academy of Sciences. 2014 doi: 10.1073/pnas.1408296111. [DOI] [PMC free article] [PubMed] [Google Scholar]
- 55.Collinger JL, et al. High-performance neuroprosthetic control by an individual with tetraplegia. Lancet. 2013;381:557–564. doi: 10.1016/S0140-6736(12)61816-9. [DOI] [PMC free article] [PubMed] [Google Scholar]
- 56.Ludwig KA, et al. Using a common average reference to improve cortical neuron recordings from microelectrode arrays. J Neurophysiol. 2009;101:1679–1689. doi: 10.1152/jn.90989.2008. [DOI] [PMC free article] [PubMed] [Google Scholar]
- 57.Fee MS, Mitra PP, Kleinfeld D. Automatic sorting of multiple unit neuronal signals in the presence of anisotropic and non-Gaussian variability. Journal of Neuroscience Methods. 1996;69:175–188. doi: 10.1016/S0165-0270(96)00050-7. [DOI] [PubMed] [Google Scholar]
- 58.Bokil H, Andrews P, Kulkarni JE, Mehta S, Mitra PP. Chronux: a platform for analyzing neural signals. J Neurosci Methods. 2010;192:146–151. doi: 10.1016/j.jneumeth.2010.06.020. [DOI] [PMC free article] [PubMed] [Google Scholar]
- 59.Stoelzel CR, Bereshpolova Y, Swadlow HA. Stability of thalamocortical synaptic transmission across awake brain states. The Journal of neuroscience : the official journal of the Society for Neuroscience. 2009;29:6851–6859. doi: 10.1523/JNEUROSCI.5983-08.2009. [DOI] [PMC free article] [PubMed] [Google Scholar]
- 60.Smith MA, Jia X, Zandvakili A, Kohn A. Laminar dependence of neuronal correlations in visual cortex. Journal of Neurophysiology. 2013;109:940–947. doi: 10.1152/jn.00846.2012. [DOI] [PMC free article] [PubMed] [Google Scholar]
- 61.Yazdan-Shahmorad A, et al. Estimation of electrode location in a rat motor cortex by laminar analysis of electrophysiology and intracortical electrical stimulation. J Neural Eng. 2011;8:046018. doi: 10.1088/1741-2560/8/4/046018. [DOI] [PubMed] [Google Scholar]
- 62.Henze DA, et al. Intracellular features predicted by extracellular recordings in the hippocampus in vivo. J Neurophysiol. 2000;84:390–400. doi: 10.1152/jn.2000.84.1.390. [DOI] [PubMed] [Google Scholar]
- 63.Kozai TD, et al. Chronic tissue response to carboxymethyl cellulose based dissolvable insertion needle for ultra-small neural probes. Biomaterials. 2014;35:9255–9268. doi: 10.1016/j.biomaterials.2014.07.039. [DOI] [PubMed] [Google Scholar]
- 64.Horecker BL. The absorption spectra of hemoglobin and its derivatives in the visible and near infra-red regions. Journal of biological chemistry. 1943;148:173–183. [Google Scholar]
- 65.Vazquez AL, Murphy MC, Kim SG. Neuronal and physiological correlation to hemodynamic resting-state fluctuations in health and disease. Brain Connect. 2014;4:727–740. doi: 10.1089/brain.2014.0276. [DOI] [PMC free article] [PubMed] [Google Scholar]
- 66.Vazquez AL, Fukuda M, Crowley JC, Kim SG. Neural and hemodynamic responses elicited by forelimb- and photo-stimulation in channelrhodopsin-2 mice: insights into the hemodynamic point spread function. Cerebral cortex. 2014;24:2908–2919. doi: 10.1093/cercor/bht147. [DOI] [PMC free article] [PubMed] [Google Scholar]
- 67.Fukuda M, Vazquez AL, Zong X, Kim SG. Effects of the alpha(2)-adrenergic receptor agonist dexmedetomidine on neural, vascular and BOLD fMRI responses in the somatosensory cortex. Eur J Neurosci. 2013;37:80–95. doi: 10.1111/ejn.12024. [DOI] [PMC free article] [PubMed] [Google Scholar]
- 68.Vazquez AL, Fukuda M, Crowley JC, Kim SG. Neural and Hemodynamic Responses Elicited by Forelimb- and Photo-stimulation in Channelrhodopsin-2 Mice: Insights into the Hemodynamic Point Spread Function. Cerebral cortex. 2013 doi: 10.1093/cercor/bht147. [DOI] [PMC free article] [PubMed] [Google Scholar]
- 69.Vazquez AL, Fukuda M, Kim SG. Evolution of the dynamic changes in functional cerebral oxidative metabolism from tissue mitochondria to blood oxygen. J Cereb Blood Flow Metab. 2012;32:745–758. doi: 10.1038/jcbfm.2011.198. [DOI] [PMC free article] [PubMed] [Google Scholar]
- 70.Vazquez AL, Masamoto K, Fukuda M, Kim SG. Cerebral oxygen delivery and consumption during evoked neural activity. Front Neuroenergetics. 2010;2:11. doi: 10.3389/fnene.2010.00011. [DOI] [PMC free article] [PubMed] [Google Scholar]
- 71.Vazquez AL, Fukuda M, Tasker ML, Masamoto K, Kim SG. Changes in cerebral arterial, tissue and venous oxygenation with evoked neural stimulation: implications for hemoglobin-based functional neuroimaging. J Cereb Blood Flow Metab. 2010;30:428–439. doi: 10.1038/jcbfm.2009.213. [DOI] [PMC free article] [PubMed] [Google Scholar]
- 72.Jahanian H, et al. Spontaneous BOLD signal fluctuations in young healthy subjects and elderly patients with chronic kidney disease. PLoS One. 2014;9:e92539. doi: 10.1371/journal.pone.0092539. [DOI] [PMC free article] [PubMed] [Google Scholar]
- 73.Shih AY, et al. Two-photon microscopy as a tool to study blood flow and neurovascular coupling in the rodent brain. J Cereb Blood Flow Metab. 2012;32:1277–1309. doi: 10.1038/jcbfm.2011.196. [DOI] [PMC free article] [PubMed] [Google Scholar]
- 74.Strumwasser F. Long-term recording' from single neurons in brain of unrestrained mammals. Science. 1958;127:469–470. doi: 10.1126/science.127.3296.469. [DOI] [PubMed] [Google Scholar]
- 75.Nicholson C, Freeman JA. Theory of current source-density analysis and determination of conductivity tensor for anuran cerebellum. J Neurophysiol. 1975;38:356–368. doi: 10.1152/jn.1975.38.2.356. [DOI] [PubMed] [Google Scholar]
- 76.Mitzdorf U. Current source-density method and application in cat cerebral cortex: investigation of evoked potentials and EEG phenomena. Physiological reviews. 1985;65:37–100. doi: 10.1152/physrev.1985.65.1.37. [DOI] [PubMed] [Google Scholar]
- 77.Buzsaki G, Anastassiou CA, Koch C. The origin of extracellular fields and currents--EEG, ECoG, LFP and spikes. Nat Rev Neurosci. 2012;13:407–420. doi: 10.1038/nrn3241. [DOI] [PMC free article] [PubMed] [Google Scholar]
- 78.Sellers KK, Bennett DV, Hutt A, Williams JH, Frohlich F. Awake vs. anesthetized: layer-specific sensory processing in visual cortex and functional connectivity between cortical areas. J Neurophysiol. 2015;113:3798–3815. doi: 10.1152/jn.00923.2014. [DOI] [PMC free article] [PubMed] [Google Scholar]
- 79.Kozai TDY, et al. Reduction of neurovascular damage resulting from microelectrode insertion into the cerebral cortex using in vivo two-photon mapping. J Neural Eng. 2010;7:046011. doi: 10.1088/1741-2560/7/4/046011. [DOI] [PMC free article] [PubMed] [Google Scholar]
- 80.Biran R, Martin DC, Tresco PA. Neuronal cell loss accompanies the brain tissue response to chronically implanted silicon microelectrode arrays. Experimental Neurology. 2005;195:115–126. doi: 10.1016/j.expneurol.2005.04.020. [DOI] [PubMed] [Google Scholar]
- 81.Edell DJ, Toi VV, McNeil VM, Clark LD. Factors influencing the biocompatibility of insertable silicon microshafts in cerebral cortex. IEEE Trans Biomed Eng. 1992;39:635–643. doi: 10.1109/10.141202. [DOI] [PubMed] [Google Scholar]
- 82.Szarowski DH, et al. Brain responses to micro-machined silicon devices. Brain Res. 2003;983:23–35. doi: 10.1016/s0006-8993(03)03023-3. [DOI] [PubMed] [Google Scholar]
- 83.Williams JC, Hippensteel JA, Dilgen J, Shain W, Kipke DR. Complex impedance spectroscopy for monitoring tissue responses to inserted neural implants. J Neural Eng. 2007;4:410–423. doi: 10.1088/1741-2560/4/4/007. [DOI] [PubMed] [Google Scholar]
- 84.Rousche PJ, Normann RA. Chronic recording capability of the Utah Intracortical Electrode Array in cat sensory cortex. J Neurosci Methods. 1998;82:1–15. doi: 10.1016/s0165-0270(98)00031-4. [DOI] [PubMed] [Google Scholar]
- 85.Williams JC, Rennaker RL, Kipke DR. Long-term neural recording characteristics of wire microelectrode arrays implanted in cerebral cortex. Brain Res Brain Res Protoc. 1999;4:303–313. doi: 10.1016/s1385-299x(99)00034-3. [DOI] [PubMed] [Google Scholar]
- 86.De Gennaro L, Ferrara M. Sleep spindles: an overview. Sleep Med Rev. 2003;7:423–440. doi: 10.1053/smrv.2002.0252. [DOI] [PubMed] [Google Scholar]
- 87.Subbaroyan J, Kipke DR. The role of flexible polymer interconnects in chronic tissue response induced by intracortical microelectrodes--a modeling and an in vivo study. Conf Proc IEEE Eng Med Biol Soc. 2006;1:3588–3591. doi: 10.1109/IEMBS.2006.260517. [DOI] [PubMed] [Google Scholar]
- 88.Karumbaiah L, et al. The upregulation of specific interleukin (IL) receptor antagonists and paradoxical enhancement of neuronal apoptosis due to electrode induced strain and brain micromotion. Biomaterials. 2012;33:5983–5996. doi: 10.1016/j.biomaterials.2012.05.021. [DOI] [PubMed] [Google Scholar]
- 89.Potter-Baker KA, et al. A comparison of neuroinflammation to implanted microelectrodes in rat and mouse models. Biomaterials. 2014;35:5637–5646. doi: 10.1016/j.biomaterials.2014.03.076. [DOI] [PMC free article] [PubMed] [Google Scholar]
- 90.Shen W, et al. Extracellular matrix-based intracortical microelectrodes: Toward a microfabricated neural interface based on natural materials. Microsystems & Nanoengineering. 2015;1:15010. doi: 10.1038/micronano.2015.10. [DOI] [PMC free article] [PubMed] [Google Scholar]
- 91.Kim Y-T, Hitchcock RW, Bridge MJ, Tresco PA. Chronic response of adult rat brain tissue to implants anchored to the skull. Biomaterials. 2004;25:2229–2237. doi: 10.1016/j.biomaterials.2003.09.010. [DOI] [PubMed] [Google Scholar]
- 92.Lee HC, et al. Histological evaluation of flexible neural implants; flexibility limit for reducing the tissue response? Journal of neural engineering. 2017;14:036026. doi: 10.1088/1741-2552/aa68f0. [DOI] [PubMed] [Google Scholar]
- 93.Karumbaiah L, et al. Relationship between intracortical electrode design and chronic recording function. Biomaterials. 2013;34:8061–8074. doi: 10.1016/j.biomaterials.2013.07.016. [DOI] [PubMed] [Google Scholar]
- 94.Ravikumar M, et al. The effect of residual endotoxin contamination on the neuroinflammatory response to sterilized intracortical microelectrodes. Journal of Materials Chemistry B. 2014;2:2517–2529. doi: 10.1039/C3TB21453B. [DOI] [PMC free article] [PubMed] [Google Scholar]
- 95.Prasad A, et al. Abiotic-biotic characterization of Pt/Ir microelectrode arrays in chronic implants. Front Neuroeng. 2014;7:2. doi: 10.3389/fneng.2014.00002. [DOI] [PMC free article] [PubMed] [Google Scholar]
- 96.Prasad A, et al. Comprehensive characterization and failure modes of tungsten microwire arrays in chronic neural implants. Journal of neural engineering. 2012;9:056015. doi: 10.1088/1741-2560/9/5/056015. [DOI] [PubMed] [Google Scholar]
- 97.Xie L, et al. Sleep drives metabolite clearance from the adult brain. science. 2013;342:373–377. doi: 10.1126/science.1241224. [DOI] [PMC free article] [PubMed] [Google Scholar]
- 98.Xu HT, Pan F, Yang G, Gan WB. Choice of cranial window type for in vivo imaging affects dendritic spine turnover in the cortex. Nature neuroscience. 2007;10:549–551. doi: 10.1038/nn1883. [DOI] [PubMed] [Google Scholar]
- 99.Ding MC, Wang Q, Lo EH, Stanley GB. Cortical excitation and inhibition following focal traumatic brain injury. J Neurosci. 2011;31:14085–14094. doi: 10.1523/JNEUROSCI.3572-11.2011. [DOI] [PMC free article] [PubMed] [Google Scholar]
- 100.Greer JE, Povlishock JT, Jacobs KM. Electrophysiological abnormalities in both axotomized and nonaxotomized pyramidal neurons following mild traumatic brain injury. J Neurosci. 2012;32:6682–6687. doi: 10.1523/JNEUROSCI.0881-12.2012. [DOI] [PMC free article] [PubMed] [Google Scholar]
- 101.Huang XJ, Mao Q, Lin Y, Feng JF, Jiang JY. Expression of voltage-gated sodium channel Nav1.3 is associated with severity of traumatic brain injury in adult rats. J Neurotrauma. 2013;30:39–46. doi: 10.1089/neu.2012.2508. [DOI] [PMC free article] [PubMed] [Google Scholar]
- 102.Mao Q, et al. The up-regulation of voltage-gated sodium channel Nav1.6 expression following fluid percussion traumatic brain injury in rats. Neurosurgery. 2010;66:1134–1139. doi: 10.1227/01.NEU.0000369612.31946.A2. discussion 1139. [DOI] [PubMed] [Google Scholar]
- 103.Lei Z, Deng P, Li J, Xu ZC. Alterations of A-type potassium channels in hippocampal neurons after traumatic brain injury. J Neurotrauma. 2012;29:235–245. doi: 10.1089/neu.2010.1537. [DOI] [PMC free article] [PubMed] [Google Scholar]
- 104.Nashmi R, Fehlings MG. Mechanisms of axonal dysfunction after spinal cord injury: with an emphasis on the role of voltage-gated potassium channels. Brain Res Brain Res Rev. 2001;38:165–191. doi: 10.1016/s0165-0173(01)00134-5. [DOI] [PubMed] [Google Scholar]
- 105.Kozai TDY, et al. Chronic tissue response to carboxymethyl cellulose based dissolvable insertion needle for ultra-small neural probes. Biomaterials. 2014;35:9255–9268. doi: 10.1016/j.biomaterials.2014.07.039. [DOI] [PubMed] [Google Scholar]
- 106.Kolarcik CL, et al. Evaluation of poly(3,4-ethylenedioxythiophene)/carbon nanotube neural electrode coatings for stimulation in the dorsal root ganglion. J Neural Eng. 2015;12:016008. doi: 10.1088/1741-2560/12/1/016008. [DOI] [PMC free article] [PubMed] [Google Scholar]
- 107.Carmichael ST, Chesselet MF. Synchronous neuronal activity is a signal for axonal sprouting after cortical lesions in the adult. J Neurosci. 2002;22:6062–6070. doi: 10.1523/JNEUROSCI.22-14-06062.2002. [DOI] [PMC free article] [PubMed] [Google Scholar]
- 108.Prince DA, et al. Epilepsy following cortical injury: cellular and molecular mechanisms as targets for potential prophylaxis. Epilepsia. 2009;50(Suppl 2):30–40. doi: 10.1111/j.1528-1167.2008.02008.x. [DOI] [PMC free article] [PubMed] [Google Scholar]
- 109.Prince DA, Jacobs K. Inhibitory function in two models of chronic epileptogenesis. Epilepsy Res. 1998;32:83–92. doi: 10.1016/s0920-1211(98)00042-4. [DOI] [PubMed] [Google Scholar]
- 110.Purcell EK, Seymour JP, Yandamuri S, Kipke DR. In vivo evaluation of a neural stem cell-seeded prosthesis. J Neural Eng. 2009;6:026005. doi: 10.1088/1741-2560/6/2/026005. [DOI] [PMC free article] [PubMed] [Google Scholar]
- 111.Kolarcik CL, et al. Elastomeric and soft conducting microwires for implantable neural interfaces. Soft Matter. 2015;11:4847–4861. doi: 10.1039/c5sm00174a. [DOI] [PMC free article] [PubMed] [Google Scholar]
- 112.Wodlinger B, et al. Ten-dimensional anthropomorphic arm control in a human brain-machine interface: difficulties, solutions, and limitations. J Neural Eng. 2015;12:016011. doi: 10.1088/1741-2560/12/1/016011. [DOI] [PubMed] [Google Scholar]
- 113.Collinger JL, et al. Collaborative approach in the development of high-performance brain-computer interfaces for a neuroprosthetic arm: translation from animal models to human control. Clin Transl Sci. 2014;7:52–59. doi: 10.1111/cts.12086. [DOI] [PMC free article] [PubMed] [Google Scholar]
- 114.Wang W, et al. An electrocorticographic brain interface in an individual with tetraplegia. PLoS One. 2013;8:e55344. doi: 10.1371/journal.pone.0055344. [DOI] [PMC free article] [PubMed] [Google Scholar]
- 115.Schwartz AB, Cui XT, Weber DJ, Moran DW. Brain-controlled interfaces: movement restoration with neural prosthetics. Neuron. 2006;52:205–220. doi: 10.1016/j.neuron.2006.09.019. [DOI] [PubMed] [Google Scholar]
- 116.Ward MP, Rajdev P, Ellison C, Irazoqui PP. Toward a comparison of microelectrodes for acute and chronic recordings. Brain Research. 2009;1282:183–200. doi: 10.1016/j.brainres.2009.05.052. [DOI] [PubMed] [Google Scholar]
- 117.Lee S, Kruglikov I, Huang ZJ, Fishell G, Rudy B. A disinhibitory circuit mediates motor integration in the somatosensory cortex. Nature neuroscience. 2013;16:1662–1670. doi: 10.1038/nn.3544. [DOI] [PMC free article] [PubMed] [Google Scholar]
- 118.Bartos M, Vida I, Jonas P. Synaptic mechanisms of synchronized gamma oscillations in inhibitory interneuron networks. Nat Rev Neurosci. 2007;8:45–56. doi: 10.1038/nrn2044. [DOI] [PubMed] [Google Scholar]
- 119.Bradke F, Fawcett JW, Spira ME. Assembly of a new growth cone after axotomy: the precursor to axon regeneration. Nat Rev Neurosci. 2012;13:183–193. doi: 10.1038/nrn3176. [DOI] [PubMed] [Google Scholar]
- 120.Sharp AA, Ortega AM, Restrepo D, Curran-Everett D, Gall K. In Vivo Penetration Mechanics and Mechanical Properties of Mouse Brain Tissue at Micrometer Scales. Ieee T Bio-Med Eng. 2009;56:45–53. doi: 10.1109/TBME.2008.2003261. [DOI] [PMC free article] [PubMed] [Google Scholar]
- 121.Bjornsson CS, et al. Effects of insertion conditions on tissue strain and vascular damage during neuroprosthetic device insertion. Journal of neural engineering. 2006;3:196–207. doi: 10.1088/1741-2560/3/3/002. [DOI] [PubMed] [Google Scholar]
- 122.Ioannidou K, Anderson KI, Strachan D, Edgar JM, Barnett SC. Time-lapse imaging of the dynamics of CNS glial-axonal interactions in vitro and ex vivo. PLoS One. 2012;7:e30775. doi: 10.1371/journal.pone.0030775. [DOI] [PMC free article] [PubMed] [Google Scholar]
- 123.Romanelli E, et al. Myelinosome formation represents an early stage of oligodendrocyte damage in multiple sclerosis and its animal model. Nat Commun. 2016;7:13275. doi: 10.1038/ncomms13275. [DOI] [PMC free article] [PubMed] [Google Scholar]
- 124.Bar-Kochba E, Scimone MT, Estrada JB, Franck C. Strain and rate-dependent neuronal injury in a 3D in vitro compression model of traumatic brain injury. Scientific Reports. 2016;6:30550. doi: 10.1038/srep30550. [DOI] [PMC free article] [PubMed] [Google Scholar]
- 125.Weber JT. Altered calcium signaling following traumatic brain injury. Frontiers in pharmacology. 2012;3 doi: 10.3389/fphar.2012.00060. [DOI] [PMC free article] [PubMed] [Google Scholar]
- 126.Kozai TDY, Vazquez AL, Weaver CL. In vivo two-photon microscopy reveals immediate microglial reaction to implantation of microelectrode through. Journal of neural engineering. 2012;9 doi: 10.1088/1741-2560/9/6/066001. [DOI] [PMC free article] [PubMed] [Google Scholar]
- 127.Salatino JW, Ludwig KA, Kozai TDY, Purcell EK. Glial responses to implanted electrodes in the brain. Nature Biomedical Engineering. 2017;1:862–877. doi: 10.1038/s41551-017-0154-1. [DOI] [PMC free article] [PubMed] [Google Scholar]
- 128.Wellman SM, Kozai TDY. Understanding the inflammatory tissue reaction to brain implants to improve neurochemical sensing performance. ACS Chemical Neuroscience. 2017;8(12):2578–2582. doi: 10.1021/acschemneuro.7b00403. [DOI] [PMC free article] [PubMed] [Google Scholar]
Associated Data
This section collects any data citations, data availability statements, or supplementary materials included in this article.