Abstract
DNA double-strand breaks (DSBs) are thought to be the main cause of cell death after irradiation. In this study, we estimated the probability distribution of the number of DSBs per cell nucleus by considering the DNA amount in a cell nucleus (which depends on the cell cycle) and the statistical variation in the energy imparted to the cell nucleus by X-ray irradiation. The probability estimation of DSB induction was made following these procedures: (i) making use of the Chinese Hamster Ovary (CHO)-K1 cell line as the target example, the amounts of DNA per nucleus in the logarithmic and the plateau phases of the growth curve were measured by flow cytometry with propidium iodide (PI) dyeing; (ii) the probability distribution of the DSB number per cell nucleus for each phase after irradiation with 1.0 Gy of 200 kVp X-rays was measured by means of γ-H2AX immunofluorescent staining; (iii) the distribution of the cell-specific energy deposition via secondary electrons produced by the incident X-rays was calculated by WLTrack (in-house Monte Carlo code); (iv) according to a mathematical model for estimating the DSB number per nucleus, we deduced the induction probability density of DSBs based on the measured DNA amount (depending on the cell cycle) and the calculated dose per nucleus. The model exhibited DSB induction probabilities in good agreement with the experimental results for the two phases, suggesting that the DNA amount (depending on the cell cycle) and the statistical variation in the local energy deposition are essential for estimating the DSB induction probability after X-ray exposure.
Keywords: DNA double-strand breaks, DNA amount, cell cycle, Monte Carlo method, γ-H2AX foci
INTRODUCTION
When ionizing radiations such as X-rays and protons are incident on cultured cells (mainly composed of water), primary and secondary electrons are produced. Their energies are then deposited along the electron tracks through ionization and excitation processes [1]. The energy deposition may induce several kinds of DNA damage, such as base damage, DNA single-strand breaks (SSBs) and DNA double-strand breaks (DSBs) [2–5]. Most of the damage can be repaired by virtue of DNA repair systems [6, 7]. However, due to their relatively high difficulty of repair (compared with other damage processes), DSBs are thought to be a major factor leading to cell death [8–11]. This means that the DNA in a cell nucleus is the essential target for responding to the impact of radiation on cells, which is sometimes called ‘targeted effects’ [12]. Thus, it is crucial to quantify the DSB number per nucleus when estimating the biological effects of mammalian cells exposed to ionizing radiation.
From the viewpoint of experiments, DSBs can be visualized by means of immunofluorescent staining with γ-H2AX antibody, called the γ-H2AX foci formation assay [13, 14]. Beyreuther et al. suggested that the number of γ-H2AX foci reaches a peak at 30 min after irradiation [15]. Matsuya et al. quantified the DSB number per nucleus after 1 Gy irradiation for a variety of photon energies with the γ-H2AX foci formation assay [16]. Like this, the γ-H2AX foci formation assay can be a useful approach for counting the number of DSBs in the cell nucleus.
It is well known that radiosensitivity depends on the cell cycle [17, 18] as well as radiation type [19]. When estimating the number of DSBs per nucleus in in vitro experiments, we therefore have to consider cell conditions in the cultured cell population. The amount of DNA in a cell nucleus changes depending on the cell cycle, for example, cells in G2 phase contain double the amount of DNA present in the G1 phase [20]. Some researchers have investigated DNA damage assuming that all cells are in the G1 phase [21]. However, to our knowledge, DSB induction estimation considering the variation in DNA amount according to cell cycle has not been undertaken until now. The amount of DNA per nucleus can be detected with propidium iodide (PI) [22, 23], enabling us to take into account the cell-cycle–dependent DNA amount per nucleus in the estimation model for the DSB number.
In this study, we have proposed a model for estimating the probability distribution of the DSB number per cell nucleus by considering the amount of DNA in the cell nucleus as well as the statistical variation in the energy deposition per nucleus. The proposed model was evaluated in comparison with the measured DSB number for two types of cell conditions: the plateau phase and the logarithmic phase of the growth curve. We showed that the DNA amount (depending on the cell cycle) and the statistical variation in the energy deposition per nucleus are essential for estimating the DSB induction probability after X-ray exposure. The advantage of our approach lies in the hybrid method, which considers not only energy deposition to the target, but also the cell culture conditions for estimating the distribution of the DSB number per cell nucleus.
MATERIALS AND METHODS
The procedure for investigating the influence of the DNA amount (depending on the cell cycle) and of the absorbed dose in the cell nucleus is given in the following steps:
flow cytometric analysis with PI to quantify the amount of DNA per nucleus;
γ-H2AX foci formation assay via fluorescence microscope and flow cytometer to measure the DSB number per nucleus;
Monte Carlo simulation to calculate the distribution of the energy deposition per nucleus by using WLTrack (in-house Monte Carlo code); and
estimation of the DSB number per nucleus according to the present model.
From the results obtained from the steps above, we evaluated the model validity by comparing them with the measured DSB number for two types of cell conditions: the plateau phase and the logarithmic phase of the growth curve.
Cell culture conditions and irradiation
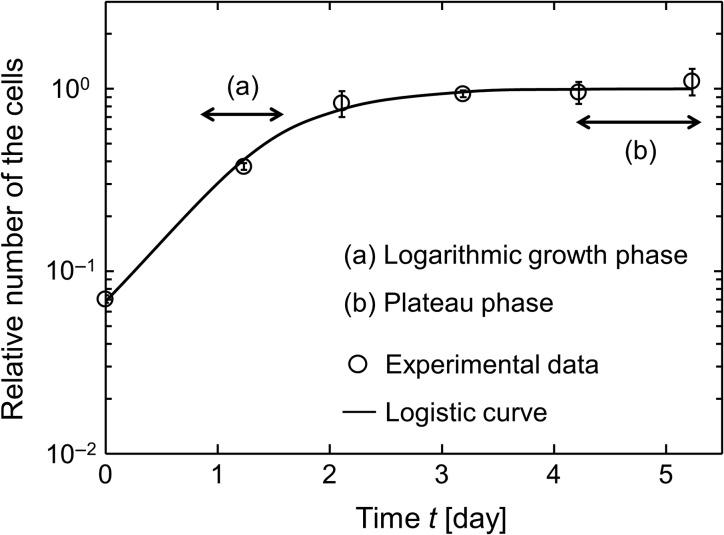
To measure the DNA amount and the number of DSBs per nucleus, one of the mammalian cell lines of Chinese hamster ovary (CHO)-K1 (RCB0285) was used. The cells were cultured in Dulbecco’s Modified Eagle Medium (DMEM, Sigma, St Louis, MO, USA) supplemented with 10% fetal bovine serum (FBS, Equitech-Bio Inc., Kerrville, TX) at 37°C in an incubator (humidified 95% air and 5% CO2). A total of 2 × 10⁵ cells were seeded on cell culture dishes with a 60 mm diameter (Nippon Genetics). We prepared two cell culture conditions: a semi-confluence state 2 days after seeding, and a confluence state 4 or 5 days after seeding (see Fig. 1).
Fig. 1.
Growth curve in CHO-K1 cell line and logistic curve: (a) is in logarithmic phase and (b) in plateau phase. Symbol and line represent experimental data and the prediction curve, respectively. The curve is described according to logistic curve with dN/dt = μ(1 − N), where N is the number of cells in a dish, μ is the rate of cell growth [day−1], t is the time after seeding. The initial number of cells (N0) at t = 0 [day] was obtained from the experiment to be 0.071 ± 0.003. The value of μ is 1.82 ± 0.16 [day−1], which was determined by the non-linear least-squares method. The open circle and the error bar represent the mean value and standard deviation (s.d.), respectively, which were calculated from four independent experiments.
The standard radiation of 200 kVp X-rays (STABILIPAN, Siemens, Concord, CA) were applied to irradiate the cultured cells. The dose rate was measured in the air at the surface of the cell culture by a Farmer-type ionization chamber (model NE2571, Nuclear Enterprises Ltd), and the absorbed dose in liquid water was determined according to the dose protocol of TRS 277 (in-air method) [24]. The dose rate and the prescribed dose were 1.26 Gy/min and 1.0 Gy, respectively. The irradiation was performed at room temperature.
Flow cytometric analysis of DNA profile using propidium iodide
For measuring the DNA amount per cell nucleus in a cell population, the cells just before irradiation were fixed in 70% ethanol (4.5 ml) and kept on ice. After a centrifugation, the cells were resuspended with PBS(−) and were then centrifuged again. By treating the cells with 0.5 ml FxCycleTM propidium iodide (PI)/RNase staining solution (Life Technologies) containing 0.2% v/v triton X for 15–30 min in the dark at room temperature, the DNA contained in cell nucleus was stained.
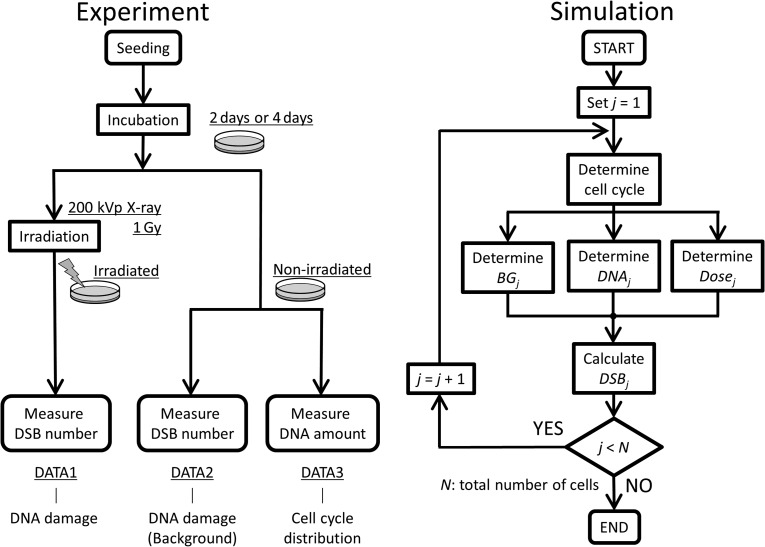
After the treatment with PI, we measured the DNA amounts by using the Attune acoustic focusing flow cytometer (Applied Biosystems by Life Technologies TM). We used the DNA profile data to determine the relative DNA amount per cell nucleus (DNAj), which was normalized by the DNA amount within the cells in the G0/G1 phase (DATA3 in Fig. 2). The cell-cycle distribution (the fractions of cells in G0/G1, S and G2/M phases) was measured by using the same method as previously described [23].
Fig. 2.
Flow charts of the present study: the left flow chart represents the biological experiments in which we observe the DNA profile depending on cell cycle and the DNA damage number per nucleus before and after irradiation, and the right flow chart represents the simulation in which we estimate DNA damage by Eq. (1) by considering the DNA amount and statistical variation of energy deposition. By comparing the results from these procedures, we examined the validity of our estimation model.
Measurement of DSB number using anti–γ-H2AX antibody
In order to measure the number of DSBs per cell nucleus, we performed the γ-H2AX foci formation assay and obtained the distribution of the foci number per nucleus by using a flow cytometer. At 30 min after irradiation, the cells in a centrifuging tube were fixed in 70% ethanol and kept on ice. The cells were then rinsed with PBS(–) and permeabilized in ice-cold 0.2% Triton X-100 in PBS for 5 min, and blocked with a solution of 1% BSA-containing PBS for 30 min. After a re-centrifugation, a primary antibody γ-H2AX diluted by a solution of 1% BSA-containing PBS was fed into the tube and kept for 24 h at 4°C. The primary antibody was removed and rinsed with a solution of 1% BSA-containing PBS, and Alexa Fluor 488-conjugated goat-anti-rabbit (Molecular Probes, Invitrogen, Japan) diluted by a solution of 1% BSA-containing PBS was fed into the tube and kept for 30 min in the dark at room temperature. We then measured the distribution of the γ-H2AX intensity per cell nucleus in a cell population by using an Attune acoustic focusing flow cytometer (Applied Biosystems by Life Technologies TM) (DATA1 and 2 in Fig. 2).
In addition, we measured the number of DSBs per nucleus with a fluorescence microscope in order to determine the conversion ratio from the fluorescence intensity to DSB number. The staining method in the fluorescence microscope measurement was the same as that for the flow cytometric analysis, but it was conducted in 5-mm glass-based dishes (ϕ12-mm glass, IWAKI 3911–035), and Alexa Fluor 594-conjugated goat-anti-rabbit diluted by a solution of 1% BSA-containing PBS was used as a secondary antibody. The γ-H2AX foci in the cell nuclei were observed by a High Standard all-in-one fluorescent microscope (model BZ-9000; Keyence, Osaka, Japan). The number of γ-H2AX foci per nucleus was counted for a number of cells (>80 cells) by using Image J software. In the measurement of the foci, a binarized processing was adopted by setting the threshold level of fluorescence intensity to the visible level.
After obtaining the mean intensity and the mean number of foci by flow cytometry and microscopy, we converted the foci intensity into the number that was used as the experimental distribution of DSBs per nucleus.
Calculation of the energy deposition to the cell nuclei
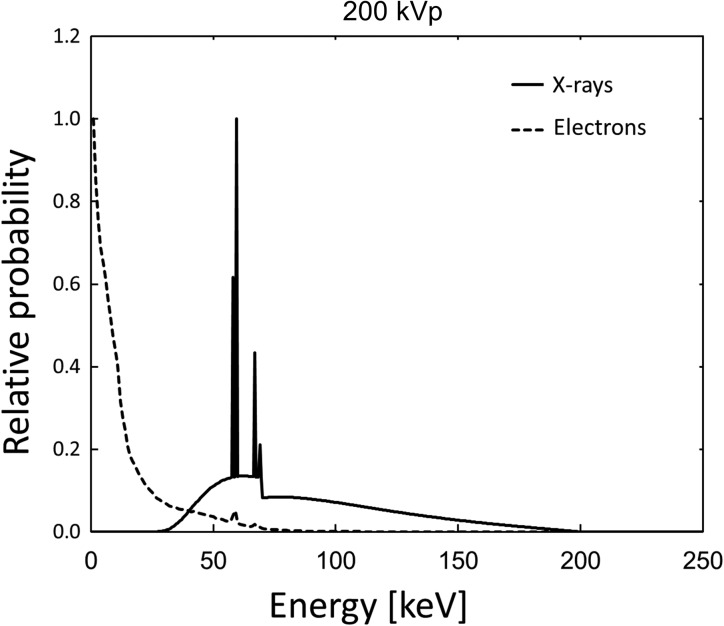
Externally irradiating X-rays give their energies to cultured cells, mainly via primary and secondary electrons. Thus, the initial energy distribution of the electrons just after their production by the incident X-rays is important for following the electron tracks along which the energies are imparted. Regarding this, we used a Monte Carlo code for a radiation particle transport system of Electron Gamma Shower ver. 5 (EGS5) code [25] in order to calculate the energy spectrum of electrons produced by 200 kVp X-rays within a depth of 10 mm from the surface of liquid water (equivalent to cultured cells). The energy spectra of photons and their electrons are illustrated in Fig. 3.
Fig. 3.
Energy spectra of 200 kVp X-rays and total (primary and secondary) electrons produced in liquid water (within a depth of 10 mm from the surface) calculated by EGS5 code.
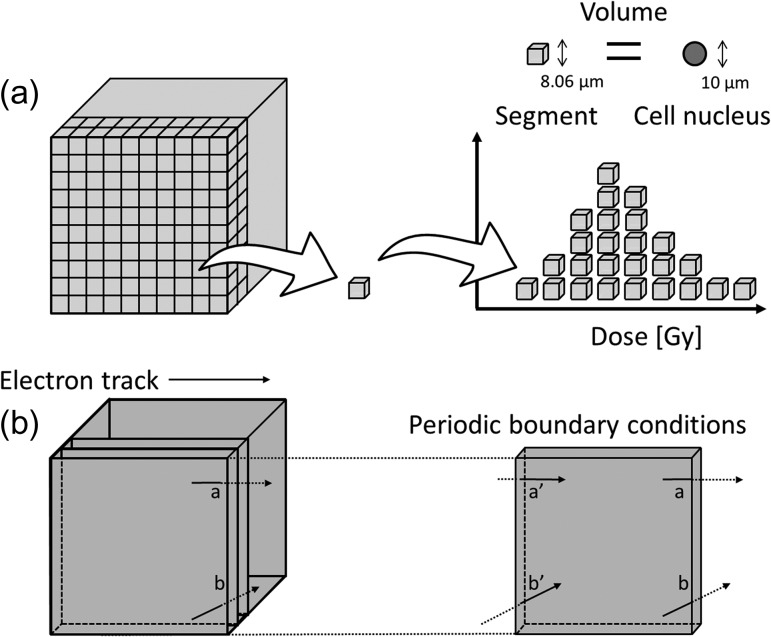
We then applied WLTrack code (in-house code) [1] in order to calculate the energy deposition by electrons into a cell nucleus, in which the geometry is assumed as illustrated in Fig. 4a. A cube filled with liquid water was irradiated by X-rays to 1 Gy. The cube consists of a lot of small cubes (one side of the small cube is 8060 nm, which gives the cube a volume equivalent to a spherical cell nucleus of 10 μm in diameter). We calculated the absorbed dose in the small cube by taking a periodic boundary condition into account, in which the electrons protruding from a face of the cube are incident on the opposite face of the cube, so as not to underestimate the dose (Fig. 4b).
Fig. 4.
Geometrical illustrations for sampling the energy deposition in the cell nucleus in the electron track simulation code (WLTrack): (a) for the cube phantom model, (b) for the periodic boundary condition. The small cube (8060 nm on a side) has the equivalent volume to a sphere with 10 μm diameter and is for modeling the cell nucleus.
Modeling to estimate the probability of the DSB number per nucleus
In considering the DNA amount and energy deposition per cell nucleus, we estimated the induction number of DSBs per cell after X-ray irradiation. In the simulation, to obtain the probability density of the number of DSBs per nucleus, the number j was assigned to each cell (j = 1, 2,...,N, where N is the total number of cells in the cell culture dish, 1.0 × 10⁵). For one cell (j-th cell) in the culture dish, the number of DSBs within the cell nucleus (DSBj [1/cell]) can be expressed by
| (1) |
Here, k is the DSB induction yield, Dosej is the absorbed dose imparted to the nucleus [Gy], DNAj is the relative DNA amount (DATA3 in Fig. 2) measured by the flow cytometry, and BGj [1/cell] represents the number of DSBj before irradiation. We determined the BGj in consideration of the DNA amount per cell nucleus. We estimated the DSB yield (k) to be 30 [1/Gy/cell] based on the result of our experiment, which is fairly consistent with the value previously reported [26, 27].
According to the combination of the Monte Carlo technique and Eq. (1), the number of DSBs per cell nucleus was calculated with respect to 1 × 10⁵ cells to determine the DSB induction probability by radiation. The right side of Fig. 2 shows the flow chart for deducing the distribution of the DSB number per nucleus. We compared the distribution of the DSB number estimated by our model with the experimental result of the γ-H2AX foci number per nucleus.
To examine the influence of the factors (dose variation and DNA amount on DSB induction probability), we prepared two additional cases in model estimation: (i) a case for considering only the DNA amount (depending on cell cycle) (hereafter called ‘Case 1’) and (ii) a case for considering only dose variation (hereafter called ‘Case 2’). While in Case 1 we assumed that all cells are exposed to 1.0 Gy without the variation, in Case 2 we assumed that all cells are in G1 phase (relative DNA amount for each cell is 1.0).
RESULTS AND DISCUSSION
DNA profile for two cell states and dose variation
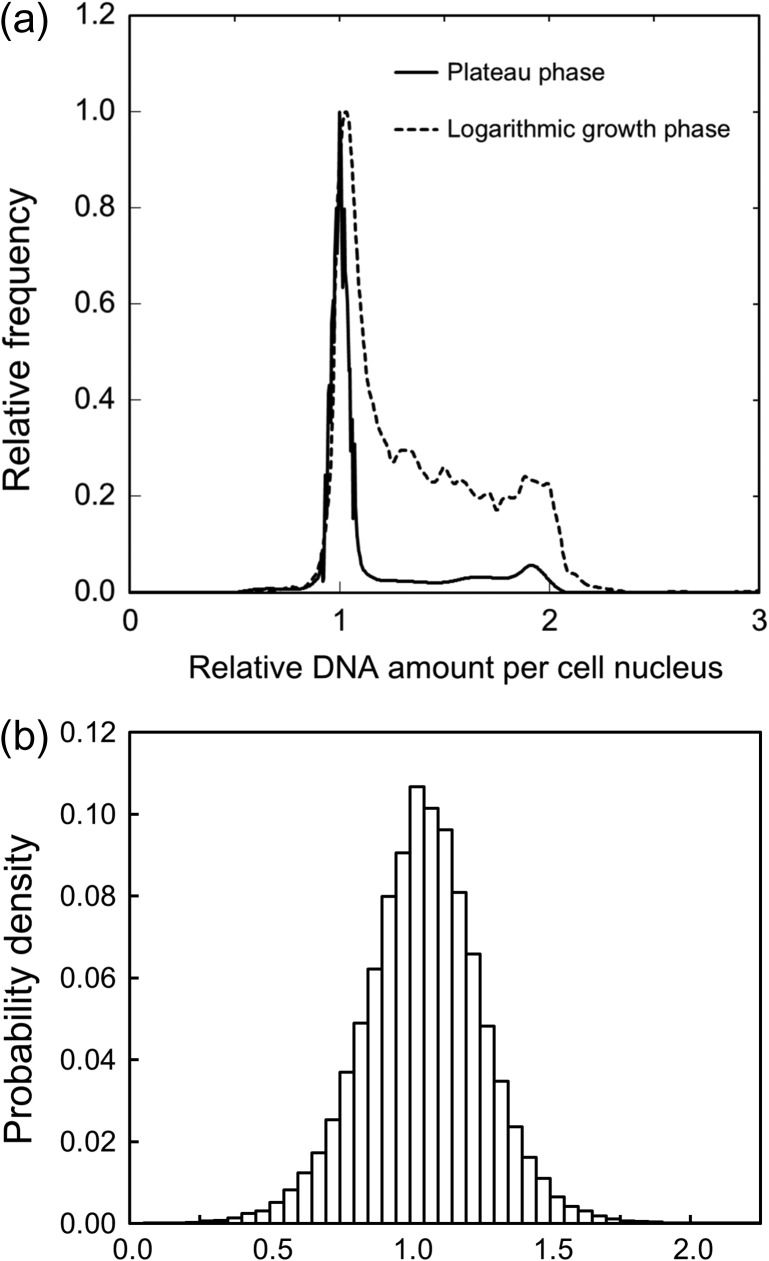
We prepared beforehand two cell conditions—one in the logarithmic phase and the other in the plateau phase of the growth curve—in order to evaluate the influence of the cell-cycle dependent DNA amount on DSB induction. The DNA profile measured by flow cytometric analysis is shown in Fig. 5a. The dotted line is for the logarithmic phase and the solid line is for the plateau phase of the growth curve. The cell population in the plateau phase is composed of 78.9% in G0/G1, 12.6% in S and 8.48% in G2/M, and in the logarithmic phase 32.4% in G0/G1, 56.9% in S and 10.7% in G2/M. Based on the previous investigations [23, 28], the CHO-K1 cell line under the plateau phase was assumed to be composed of cells mainly in G0/G1 phase. In this regard, our DNA profile for the plateau phase has the same tendency as the previous one [23]. Contrary to this, the cell population in the logarithmic phase contains more DNA targets (in G2/M) per nucleus than that in the plateau phase, as shown in Fig. 5a. Here, the sample numbers of cells are 2 × 10⁴ for the plateau phase and 1 × 10⁴ for the logarithmic growth phase.
Fig. 5.
Results of the flow cytometric analysis for obtaining DNA amount, and the Monte Carlo simulation for calculating energy deposition per cell nucleus: (a) for DNA profiles in two different cell conditions, (b) for the distribution of energy imparted to the cell nucleus. In Fig. 5a, the solid line is for the plateau phase condition mostly consisting of G0/G1 cells (G0/G1: S: G2/M = 78.9%: 12.6%: 8.48%), and the dotted line is for the logarithmic phase condition as another profile (G0/G1: S: G2/M = 32.4%: 56.9%: 10.7%). The intensity was normalized by that with the cells in a hybrid mix of the G0/G1 phase.
The energy deposition per cell nucleus calculated by the Monte Carlo simulation resulted in a Gaussian shape of distribution, as shown in Fig. 5b. The peak is shown at 1.0 Gy (average), and the standard deviation (s.d.) of the cell-specific dose was 0.22 Gy for the logarithmic growth phase and 0.23 Gy for the plateau phase, respectively. This means that the dose imparted into each nucleus includes an uncertainty of 22–23% (s.d./average). This variation of the energy per nucleus was taken into account in the estimation formula of the DSB number expressed by Eq. (1).
Distribution of γ-H2AX foci under two cell conditions
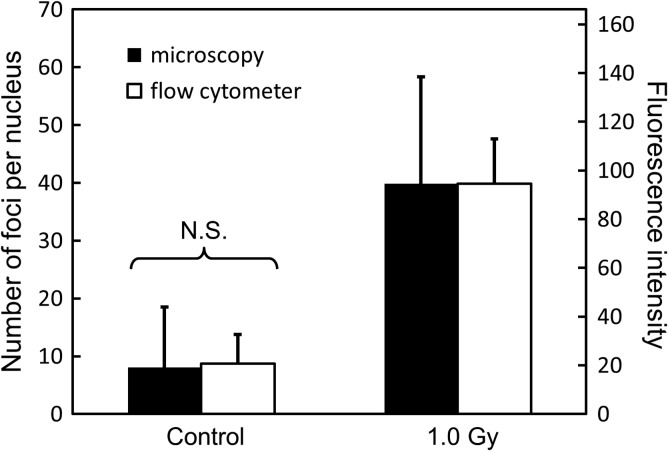
The number of DSBs per nucleus was detected by using anti–γ-H2AX antibody via a combination of flow cytometer and fluorescence microscope. The distributions of the DSB number per cell nucleus were obtained before exposure (non-irradiated group) and after exposure with 1.0 Gy (irradiated group). In this study, we applied 200 kVp X-rays at a relatively high dose rate of 1.26 Gy/min to remove the DNA repair during dose delivery. Figure 6 shows the results of the γ-H2AX assay via microscopic analysis for the foci number and flow cytometric analysis for the fluorescence intensity per cell nucleus. We confirmed that there is a good correlation between the foci intensity and the number of foci as shown in Fig. 6. While the intensity of γ-H2AX foci was converted into the number of foci, the distributions of DSB number before (as ‘Background’ in Fig. 7) and after the exposure were estimated by Eq. (1).
Fig. 6.
Results of γ-H2AX foci per nucleus measured by microscopy and flow cytometry. Black and white bars represent the number of foci per nucleus via microscopic analysis and the foci intensity via flow cytometric analysis, respectively. On one hand, the values of foci number by microscopy are 8.07 ± 10.45 for control (0 Gy, non-irradiated group) and 39.82 ± 18.51 for 1.0 Gy. Here, the number of samples is above 300. On the other hand, the values of foci intensity are 20.66 ± 11.96 for the control and 94.49 ± 18.48 for 1.0 Gy. The numbers of samples are 1.0 × 10⁵ for 0 Gy and 2.0 × 10⁵ for 1.0 Gy, respectively. N.S. means no significant difference.
Fig. 7.
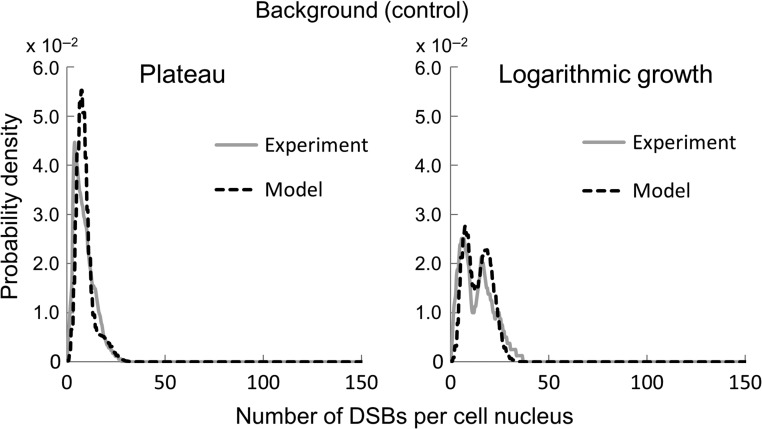
Probability densities of the number of DSBs per cell nucleus obtained by the present model and by the experiment based on the flow cytometric and fluorescence microscopic analyses with the γ-H2AX antibody as the background (non-irradiated group).
As to BGj, we found that the distribution of the background DSB number per cell nucleus has two peaks through the analysis of DNA profile in the logarithmic growth phase (see Fig. 7). According to MacPhail et al. (2003), the S cells exhibit a high level of γ-H2AX foci intensity as background [29]. The result above suggests that the lower peak was mainly composed of G1 and G2/M cells and the higher peak was of S cells. We have reproduced the distribution of the background DSB number by the sum of two Poisson distributions with mean values, μ1 = 7.34 and μ2 = 18.15. Thus, the background of foci may be attributed to not only the DNA amount per nucleus but also to a high number of foci in S phase.
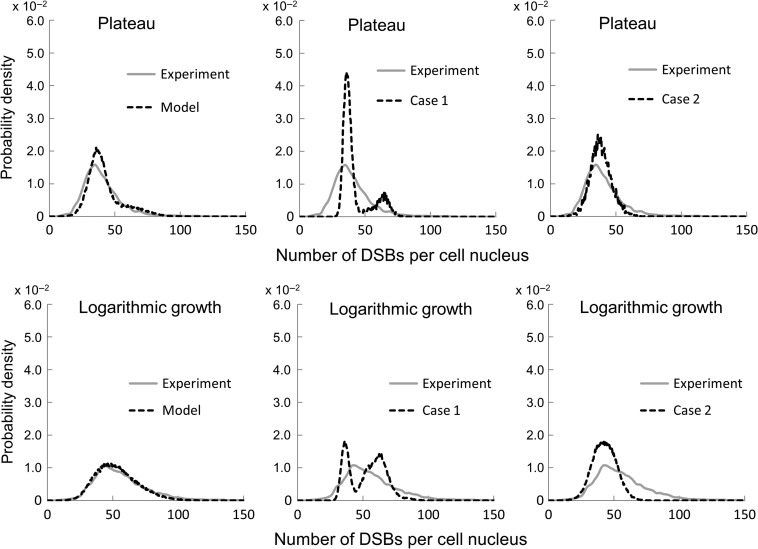
Figure 8 shows the comparison between the estimated distributions of the DSB number per cell nucleus and the measured ones for the plateau and logarithmic growth phases. According to our experiment, the median value was 37.31 [/cell], the lower and upper quartile values were 30.53 [/cell] and 46.64 [/cell] in the plateau phase, while 52.58 [/cell], 41.98 [/cell] and 66.14 [/cell] in the logarithmic growth phase, respectively. From the model estimation, the median value was 38.89 [/cell], the lower and upper quartile values were 33.45 [/cell] and 47.10 [/cell] in the plateau phase, while 52.56 [/cell], 39.92 [/cell] and 64.24 [/cell] in the logarithmic growth phase, respectively. The number of foci per nucleus under the logarithmic growth phase had a larger uncertainty than that under the plateau phase. It was found that the model provides distributions in agreement with the experimental data for both the plateau and logarithmic growth conditions.
Fig. 8.
Probability densities of the number of DSBs per cell nucleus estimated by the present model and by the experimental data. The left panels are for after 1.0 Gy irradiation in each cell phase condition. The results for the models under different assumptions are also shown in comparison with the experimental data: the center panels are for Case 1, which considers only cell cycle distribution, and the right panels are for Case 2, which considers only dose variation.
The median value for Case 1 was 37.74 [/cell], the lower and upper quartile values were 35.28 [/cell] and 42.55 [/cell] in the plateau phase, while 55.04 [/cell], 38.94 [/cell] and 63.70 [/cell] in the logarithmic growth phase, respectively. The median value for Case 2 was 38.08 [/cell], the lower and upper quartile values were 33.19 [/cell] and 43.51 [/cell] in the plateau phase, while 42.81 [/cell], 36.55 [/cell] and 49.21[/cell] in the logarithmic growth phase, respectively. In the plateau phase, we found that the median values were not much different from our experimental results in both cases, and the deviation degrees were less than those for the experimental and estimated results in Fig. 8. However, as shown in Fig. 8, noticeable differences appear in the distributions between the experimental and estimated results in both cases. The small deviation degree was attributable to the uncertainty arising from the factors that were not considered. On the other hand, in the logarithmic growth phase, there were relatively large discrepancies between the values obtained without either factor being considered (dose variation or cell cycle) and the experimental ones. The dispersion degree of the result in Case 1 was much larger than that in Case 2, which may be interpreted by the fact that the DNA amount per nucleus includes a larger relative uncertainty than the dose per nucleus in the logarithmic growth phase. Because the cells in the plateau phase consist of a large number of cells in the G1 phase, the variability in the DSB number for Case 2 in the logarithmic growth phase is much more than that in the plateau phase.
The results of our analysis suggest that the yield of DSBs induced by X-rays is intricately related to the cell cycle and cannot generally be estimated merely from the mean amount of DNA. Collectively, we can conclude that inclusion of both quantities as major factors, the DNA amount depending on cell cycle and the dose variation, is necessary or essential for predicting the DNA damage degree and its uncertainty.s
In the study so far, we have dealt with one type of cell line under X-ray irradiation with a dose of 1.0 Gy. Thus, further investigations with other cell lines, radiation types and absorbed dose will be necessary in order to evaluate the general versatility of our estimation model.
CONCLUSION
The probabilities of DSB induction in the two states of plateau and logarithmic growth phases were different from each other. Our DSB estimation model considering both the DNA amount and non-uniformity of radiation energy deposition reproduced fairly well the experimental induction probability in each state. Via model investigation, it was suggested that distributions of dose and DNA amount per nucleus are responsible for the mean number of DSBs per nucleus and its uncertainty. By demonstrating with one cell line under typical conditions, we have shown that the DNA amount (depending on the cell cycle) and the statistical variation in the local energy deposition (into the cell nucleus) by secondary electrons are crucial for assaying the probability of DSB induction in cells exposed to ionizing radiations.
ACKNOWLEDGEMENTS
We would like to thank Dr Kenneth L. Sutherland (Graduate School of Medicine, Hokkaido University, Sapporo, Japan), who kindly spared time for English proofreading of the manuscript.
CONFLICT OF INTEREST
No actual or potential conflicts of interest exist for any of the authors.
FUNDING
Funding to pay the Open Access publication charges for this article was provided by Hiroyuki Date (Faculty of Health Sciences, Hokkaido University). This work was supported by JSPS KAKENHI Grant Number 16K09007.
REFERENCES
- 1. Date H, Sutherland KL, Hasegawa H et al. Ionization and excitation collision processes of electrons in liquid water. Nucl Instrum Methods Phys Res B 2007;265:515–20. [Google Scholar]
- 2. Nikjoo H, Goodhead DT, Charlton DE et al. Energy deposition in small cylindrical targets by monoenergetic electrons. Int J Radiat Biol 1991;60:739–56. [DOI] [PubMed] [Google Scholar]
- 3. Michalik V. Estimation of double-strand break quality based on track-structure calculations. Radiat Environ Biophys 1993;32:251–8. [DOI] [PubMed] [Google Scholar]
- 4. Goodhead DT. Initial events in the cellular effects of ionizing radiations: clustered damage in DNA. Int J Radiat Biol 1994;65:7–17. [DOI] [PubMed] [Google Scholar]
- 5. Ward JF. The complexity of DNA damage: relevance to biological consequences. Int J Radiat Biol 1994;66:427–32. [DOI] [PubMed] [Google Scholar]
- 6. Bedford JS, Dewey WC. Historical and current highlights in radiation biology: has anything important been learned by irradiating cells? Radiat Res 2002;158:251–91. [DOI] [PubMed] [Google Scholar]
- 7. Valerie K, Povirk LF. Regulation and mechanisms of mammalian double-strand break repair. Oncogene 2003;22:5792–812. [DOI] [PubMed] [Google Scholar]
- 8. Frankenberg-Schwager M, Frankenberg D. DNA double-strand breaks: their repair and relationship to cell killing in yeast. Int J Radiat Biol 1990;58:569–75. [DOI] [PubMed] [Google Scholar]
- 9. Ritter MA, Cleaver JE, Tobias CA. High-LET radiations induce a large proportion of non-rejoining DNA breaks. Nature 1977;266:653–5. [DOI] [PubMed] [Google Scholar]
- 10. Roots R, Yang TC, Craise L et al. Impaired repair capacity of DNA breaks induced in mammalian cellular DNA by accelerated heavy ions. Radiat Res 1979;78:38–49. [PubMed] [Google Scholar]
- 11. Thompson LH. Recognition, signaling, and repair of DNA double-strand breaks produced by ionizing radiation in mammalian cells: the molecular choreography. Mutat Res 2012;751:158–246. [DOI] [PubMed] [Google Scholar]
- 12. Hall EJ, Giaccia AJ. Cell survival curves In: Hall EJ, Giaccia AJ (eds). Radiobiology for the Radiologist. 6th edn Philadelphia: Lippincott Williams & Wilkins, 2006, 31–46. [Google Scholar]
- 13. Franken N, Cate R, Przemek MK et al. Comparison of RBE values of high-LET α-particles for the induction of DNA-DSBs, chromosome aberrations and cell reproductive death. Radiat Oncol 2011;6:64. [DOI] [PMC free article] [PubMed] [Google Scholar]
- 14. Martia M, Ulich G, Frank L et al. 53BP1 and MDC1 foci formation in HT-1080 cells for low- and high-LET microbeam irradiations. Radiat Environ Biophys 2011;50:345–52. [DOI] [PubMed] [Google Scholar]
- 15. Beyreuther E, Lessmann E, Pawelke J et al. DNA double-strand break signaling: X-ray energy dependence of residual co-localised foci of γ-H2AX and 53BP1. Int J Radiat Biol 2009;85:1042–50. [DOI] [PubMed] [Google Scholar]
- 16. Matsuya Y, Ohtsubo Y, Tsutsumi K et al. Quantitative estimation of DNA damage by photon irradiation based on the microdosimetric–kinetic model. J Radiat Res 2014;55:484–93. [DOI] [PMC free article] [PubMed] [Google Scholar]
- 17. Pawlik TM, Keyomarsi K. Role of cell cycle in mediating sensitivity to radiotherapy. Int J Radiat Oncol Biol Phys 2004;59:928–42. [DOI] [PubMed] [Google Scholar]
- 18. Sinclair WK, Morton RA. X-ray sensitivity during the cell generation cycle of cultured Chinese hamster cells. Radiat Res 1966;29:450–74. [PubMed] [Google Scholar]
- 19. Begg AC, Wouters BG. Irradiation-induced damage and the DNA damage response In: Joiner MC, van der Kogel AJ (eds). Basic Clinical Radiobiology. 4th edn London: Hodder Arnold, 2009, 12–26. [Google Scholar]
- 20. Alberts B, Bray D, Lewis J et al. (eds). Molecular Biology of the Cell. 5th edn New York: Garland Press, 1983, 1053–114. [Google Scholar]
- 21. Friedland W, Dingfelder M, Kundrát P et al. Track structures, DNA targets and radiation effects in the biophysical Monte Carlo simulation code PARTRAC. Mutat Res 2011;711:28–40. [DOI] [PubMed] [Google Scholar]
- 22. Jayat C, Ratinaud MH. Cell cycle analysis by flow cytometry: principles and applications. Biol Cell 1993;78:15–25. [DOI] [PubMed] [Google Scholar]
- 23. Matsuya Y, Tsutsumi K, Sasaki K et al. Modeling cell survival and change in amount of DNA during protracted irradiation. J Radiat Res 2017;58:302–12. [DOI] [PMC free article] [PubMed] [Google Scholar]
- 24. International Atomic Energy Agency (IAEA) Absorbed dose determination in photon and electron beams. An International Code of Practice. Technical Reports Series No. 277, Vienna, 1987.
- 25. Hirayama H, Namito Y, Nelson W et al. The EGS5 code system. SLAC Report 730, prepared for the Department of Energy, USA, 2005.
- 26. Tommasino F, Friedrich T, Jakob B et al. Induction and processing of the radiation-induced gamma-H2AX signal and its link to the underlying pattern of DSB: a combined experimental and modelling study. PLoS One 2015;10:e0129416. [DOI] [PMC free article] [PubMed] [Google Scholar]
- 27. Taucher-Scholz G, Heilmann J, Kraft G. Induction and rejoining of DNA double-strand breaks in CHO cells after heavy ion irradiation. Adv Space Res 1996;18:83–92. [DOI] [PubMed] [Google Scholar]
- 28. Nelson JM, Todd PW, Metting NF. Kinetic differences between fed and starved Chinese hamster ovary cells. Cell Tissue Kinet 1984;17:411–25. [DOI] [PubMed] [Google Scholar]
- 29. MacPhail SH, Banath JP, Yu TY et al. Expression of phosphorylated histone H2AX in cultured cell lines following exposure to X-rays. Int J Radiat Biol 2003;79:351–9. [DOI] [PubMed] [Google Scholar]


