Abstract
Purpose
The study aimed to provide a quantitative description of aqueous humor dynamics in healthy rat eyes.
Methods
One eye of 26 anesthetized adult Brown-Norway rats was cannulated with a needle connected to a perfusion pump and pressure transducer. Pressure-flow data were measured in live and dead eyes by varying pump rate (constant-flow technique) or by modulating pump duty cycle to hold intraocular pressure (IOP) at set levels (modified constant-pressure technique). Data were fit by the Goldmann equation to estimate conventional outflow facility ( ) and unconventional outflow rate (
 ). Parameter estimates were respectively checked by inserting a shunt of similar conductance into the eye and by varying eye hydration methodology.
Results
Rat IOP averaged 14.6 ± 1.9 mm Hg at rest. Pressure-flow data were repeatable and indistinguishable for the two perfusion techniques, yielding  = 0.023 ± 0.002 μL/min/mm Hg and
  = 0.096 ± 0.024 μL/min.
  was similar for live and dead eyes and increased upon shunt insertion by an amount equal to shunt conductance, validating measurement accuracy. At 100% humidity
  dropped to 0.003 ± 0.030 μL/min. Physiological washout was not observed (−0.35 ± 0.65%/h), and trabecular anatomy looked normal.
Conclusions
Rat aqueous humor dynamics are intermediate in magnitude compared to those in mice and humans, consistent with species differences in eye size.  does not change with time or death. Evaporation complicates measurement of
  even when eyes are not enucleated. Absence of washout is a notable finding seen only in mouse and human eyes to date.
Keywords: outflow facility, anterior chamber, eye perfusion, in vivo
Intraocular pressure (IOP) in living animals reflects the dynamics of aqueous humor flow into and out of the eye. Aqueous humor flows into the posterior chamber at a steady rate via the ciliary body epithelium. It flows around the iris to the anterior chamber and exits via conventional and unconventional outflow pathways.1,2 The conventional pathway courses through the trabecular meshwork into Schlemm's canal and onto collector channels and aqueous drainage veins of the episcleral venous system.3,4 The unconventional pathway includes all other escape routes. It does not have physical structures like canals or veins, but rather involves fluid seepage through the iris root, ciliary muscle, choroid, and sclera into orbital capillaries, vortex veins, and lymph vessels.5,6 Under normal physiological conditions the trabecular pathway presents the primary resistance to aqueous outflow. Fluid movement along unconventional routes is not thought to depend on IOP except near 0 mm Hg.2,7 The primary site of conventional outflow resistance has been pinpointed to the inner wall region of Schlemm's canal.8 Trabecular matrix in this region stiffens in eyes with glaucoma,9,10 altering the biomechanical properties of inner wall cells and impairing their ability to form pores through which aqueous crosses into the canal.11 The heightened resistance causes a sustained IOP increase that can lead to retinal ganglion cell death and blindness if left untreated.
Given the links between IOP and glaucoma, it is important to understand aqueous humor dynamics in quantitative detail. Important parameters like aqueous formation rate, conventional outflow facility, unconventional outflow, and episcleral venous pressure have been reported for ex vivo and in vivo eyes of humans12 and several animals.1,2,13–15 Direct and indirect methods have been used to determine each parameter, including anterior chamber2,13–15 and episcleral vein16 cannulation, venomanometry,17 tonography,18 fluorophotometry,12 and radiolabeling.1,2,7 A constant-flow (CF) infusion technique was recently developed for quantifying these parameters in a single eye of live anesthetized mice,19 permitting serial measurements on the same animal. In this study the CF technique and a modified constant-pressure (mCP) technique were applied to the eyes of anesthetized rats. Rats were investigated because they are a popular experimental model for glaucoma research20–22 owing to their low cost, convenient size, quick growth to sexual maturity, short life span, and ease of handling. More importantly, aqueous humor dynamics are well documented for other animal glaucoma models but not for rats.
Methods
All experiments were conducted in accordance with the ARVO Statement for the Use of Animals in Ophthalmic and Vision Research and in compliance with a protocol approved by the Institutional Animal Care and Use Committee at the University of South Florida.
Animal Preparation
Male retired-breeder Brown-Norway rats (300–400 g) were housed under a 12-hour light/12-hour dark cycle with food and water available ad libitum. On the day of experimentation animals were anesthetized with an intraperitoneal (IP) injection of ketamine hydrochloride (75 mg/kg) and xylazine (7.5 mg/kg), supplemented as needed. Anesthesia was maintained by intravenous (IV) delivery of ketamine (30 mg/kg/h) through a femoral vein catheter. A tracheotomy was performed for artificial ventilation, and eye movements were paralyzed by an IV bolus of gallamine triethiodide (26 mg/kg) followed by IV infusion of gallamine (40 mg/kg/h), ketamine (30 mg/kg/h), and dextrose (600 mg/kg/h). Heart rate and body temperature were continually monitored and kept at physiological levels by adjusting anesthetic infusion rate. The animal was rested on a heating pad (37°C) and mounted in a stereotaxic. An intramuscular (IM) bolus of dexamethasone (1 mg) was given to prevent cerebral edema during prolonged anesthesia, and pupils were dilated with 1% cyclopentolate hydrochloride drops. Some experiments were performed with anesthetic and no extra treatments (n = 3), and outflow data were not noticeably different (Supplementary Fig. S1).
Experimental Setup and Calibration
The anterior chamber was obliquely cannulated by a 33-gauge hypodermic needle (TSK Laboratory, Tochigi, Japan, length: 13 mm, lumen: 0.11 mm) with care taken to avoid puncturing the lens capsule. The needle was connected via a three-way stopcock and polyethylene tubing (length: 45 cm, lumen: 0.4 mm) to a piezoresistive pressure sensor (model 26PC; Honeywell, Morristown, NJ, USA) positioned at eye level and a programmable syringe pump (NE-1000; New Era Pump Systems, Farmingdale, NY, USA). The tubing was filled with artificial aqueous humor (130 mM NaCl, 5 mM KCl, 5 mM NaHCO3, 1 mM CaCl2, 0.5 mM MgCl2, 5 mM glucose, 20 mM HEPES, pH 7.25).23 The pressure sensor was temperature compensated and referenced to atmospheric pressure so that any effects of ambient temperature or pressure variation were eliminated. Sensor output was amplified, low-pass filtered at 1 Hz, and digitized at 2 Hz to a computer. The syringe pump was controlled by a custom LabView program (National Instruments, Austin, TX, USA) that perfused the eye at a set rate (CF) or held IOP at a set level by modulating the duty cycle (mCP). After eye cannulation, corneas were covered with clear contact lenses (0.2 mm ACLAR film; Honeywell) and instilled every 15 minutes with a drop of saline to prevent desiccation. The cannulation site was regularly checked to confirm there was no needle movement, internal tissue damage, or visible leakage at high IOP. Data collection began when IOP settled at a level that fluctuated <1 mm Hg peak-to-peak over 15 minutes. This level was defined as the resting IOP.
The hydrodynamic properties of the eye perfusion system were characterized prior to study commencement. First the pressure sensor was calibrated with a mercury manometer to produce linear (R2 = 0.999) and accurate (error = ±0.4 mm Hg) readings for a saline reservoir positioned at variable heights. The system was then connected to a 33-gauge needle submerged in saline and sensor output was recorded for pump rates of 1 to 4 μL/min. System resistance was specified by linear regression of the pressure-flow data. Lastly the needle was sealed, the pump was configured to inject a 1- to 4-μL bolus of fluid into the closed system, and the instantaneous pressure change was recorded. System compliance was specified by linear regression of the pressure–volume data.24 The same bolus sequence was delivered during animal experiments and ocular compliance was estimated by the change in regression slope.
Constant-Flow Technique
The CF technique was applied to 9 rats. After determining the resting IOP, pump rate was incremented in 0.2 μL/min steps between 0.1 and 1.3 μL/min, and for each step the anterior chamber was perfused until IOP stabilized at a level that fluctuated <1 mm Hg for at least 5 minutes. At each steady-state level fluid flow into and out the eye is balanced, meaning that net flow  is:
is:
 |
where  is total outflow rate [μL/min],
  is aqueous production rate [μL/min], and
  is pump rate [μL/min]. The animal was then euthanized with Euthasol (Vibrac, Fort Worth, TX, USA) given to effect, and data were collected in situ for the same rate increments approximately 30 minutes after injection when IOP dropped below 3 mm Hg.19
Modified Constant-Pressure Technique
A modification of the constant-pressure (mCP) technique was applied to 10 rats, in which IOP was held constant by modulating pump duty cycle25 instead of the instantaneous perfusion rate.26,27 Figure 1 illustrates the technique for a 20 mm Hg set point and 2 mm Hg window. Upon set-point specification the pump turns on and injects fluid at a fixed rate, which gradually raises IOP from a resting level of 15 mm Hg. Once 21 mm Hg is reached, the pump turns off and IOP decreases as the excess fluid is cleared by the eye. The pump reactivates when IOP falls to 19 mm Hg, and the cycle repeats until a new set point is specified. In all experiments the window was 2 mm Hg, the pump rate was 1.5 μL/min, and the set point was incremented in steps of 5 mm Hg from an initial point that was ∼5 mm Hg above the resting IOP. Data were collected for at least three to five cycles per step. At each set point, the fluid volume that enters the eye during on phases equals the volume that leaves during off phases since IOP is the same at cycle start and end, meaning that:
 |
where  is the time required to raise IOP by 2 mm Hg (on duration) and
  is the time required for IOP to fall by 2 mm Hg (off duration). The equation can be rearranged to give the net flow:
 |
where  is pump duty cycle. It may be seen that the mCP and CF techniques are theoretically equivalent since
  if the pump never turns off.
  and
and  were measured for each cycle and F was averaged across all cycles of a given set point. The animal was then euthanized, and data were collected in situ for the same set-point increments approximately 30 minutes after injection when IOP dropped below 3 mm Hg.
Figure 1.
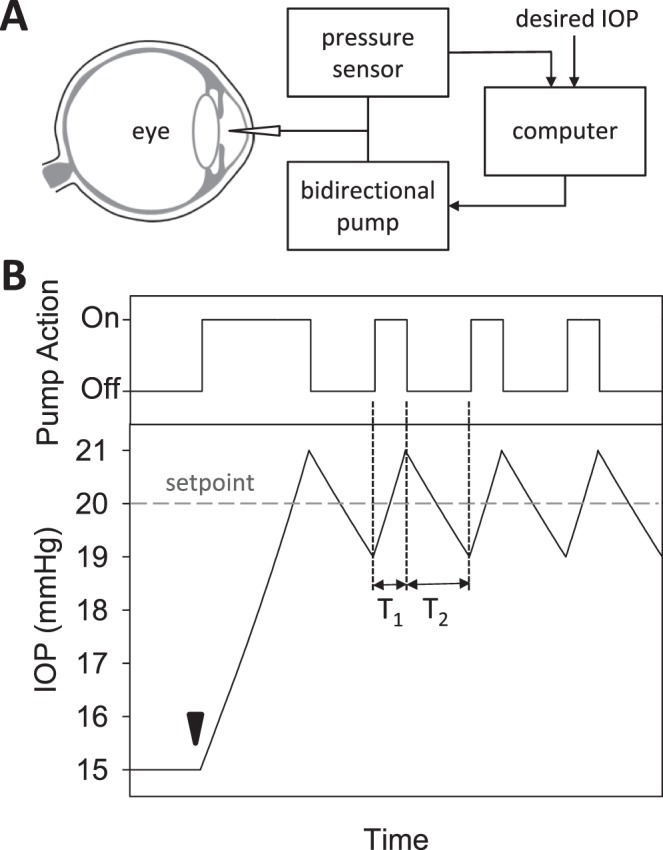
Modified constant-pressure eye perfusion experiment. (A) Schematic diagram of the perfusion system used to assess aqueous humor dynamics of the rat eye. (B) Conceptual illustration of the behavior of the perfusion pump (top) and IOP (bottom) during the experiment. IOP is initially at rest when a set point of 20 mm Hg is specified by the user (arrowhead). The pump subsequently cycles on and off in order to hold IOP within a 2 mm Hg window of the set point. The window size is also specified by the user. T1 and T2 correspond to the pump on and off duration, respectively.
Estimation of Inflow–Outflow Parameters
IOP in a living animal may be described by the modified Goldmann equation,28
 |
where  is conventional outflow facility [μL/min/mm Hg],
  is unconventional outflow rate [μL/min], and
  is episcleral venous pressure [mm Hg].
  is 1 for CF experiments, and it is determined empirically for mCP experiments. The equation does not account for flow in the unconventional pathway that may be pressure dependent. Since
  corresponds to
  for both techniques, this means:
 |
The modified Goldmann equation was fit to in vivo data. The regression slope estimates outflow facility of live eyes ( ), and the y-intercept estimates a combination of three additional parameters (
 ,
,  ,
,  ). Euthanasia eliminates the last two parameters, reducing the equation to:
 |
which was fit to the in situ data. The regression slope and y-intercept estimate outflow facility of dead eyes ( ) and
) and  , respectively.
  and
and  cannot be separately estimated and were therefore combined into:
 |
where  was calculated from the difference in y-intercept of live and dead eyes.
Assessment of Parameter Estimates
Additional experiments were performed on four groups of animals. To test for hysteresis, data were collected and compared for a sequence of increments and decrements in pump rate or set point. To test for washout,29–31 the eye was perfused for 2 to 3 hours at a fixed rate that raised IOP 15 to 20 mm Hg above rest. Pump rate was divided by the pressure change to convert the record to instantaneous outflow facility and fit by a line. The slope estimated washout rate, which was expressed as percentage change per hour by normalizing to outflow facility at pump onset. To assess accuracy, data collection was repeated with a shunt inserted through the cornea and opened to air. The shunt was made from perfluoroalkoxy tubing (length: 20 mm, lumen: 50 μm) and had a measured conductance of  = 0.029 μL/min/mm Hg. The shunt adds a parallel IOP-dependent element to the Goldmann equation, which results in:
 |
where  . Facility estimates with a shunt in the eye should thus increase by
  and the y-intercept should remain the same if the mCP technique is valid. To assess for possible evaporation artifacts, eye hydration was maintained by a steady saline drip or by immersion in a saline bath at room temperature. The bath was achieved by adhering a plastic cup to fur around the eye.
Histologic Processing
The impact of eye perfusion was examined histologically for 5 rats. After data collection was complete, both eyes were enucleated and placed in 4% paraformaldehyde for 24 hours. The eyes were then embedded in paraffin, sliced in 4-μm sections, and mounted on gel-coated slides. Tissue sections of the iridocorneal angle of both eyes were stained with hematoxylin and eosin, viewed under light microscopy, and digitally photographed.
Data Analysis
Statistical significance was assessed with paired and unpaired t-tests at an α level of 0.05 using SigmaPlot software (Systat, Inc., San Jose, CA, USA), unless otherwise specified. Results are expressed within experiments as 95% confidence intervals in brackets and across experiments as mean ± standard deviation (SD).
Results
Perfusion System Properties
The hydraulic resistance of the perfusion system was 0.36 ± 0.01 mm Hg·min/μL (n = 3) when connected to a 33-gauge needle. This corresponds to a hydraulic conductance of 2.78 ± 0.08 μL/min/mm Hg, which nearly matches the expected value given by Poiseuille's law (2.6 μL/min/mm Hg). It is 100-fold larger than the outflow facility of rat eyes measured below so its influence on the measurements can be ignored. Figure 2A shows the system response to fluid boluses administered with the needle sealed shut and with the needle inserted in a rat eye. Pressure increases nearly instantaneously in both cases, then holds steady for the closed system and decays back toward baseline for the open system. Figure 2B relates measured pressure changes to bolus volume. The hydraulic compliance of the entire perfusion system (0.105 ± 0.016 μL/mm Hg, n = 7) was comparable to that of rat eyes (0.091 ± 0.018 μL/mm Hg, n = 3, P = 0.16). Since it was not orders of magnitude greater than ocular compliance, response dynamics were not markedly altered by system tubing.
Figure 2.
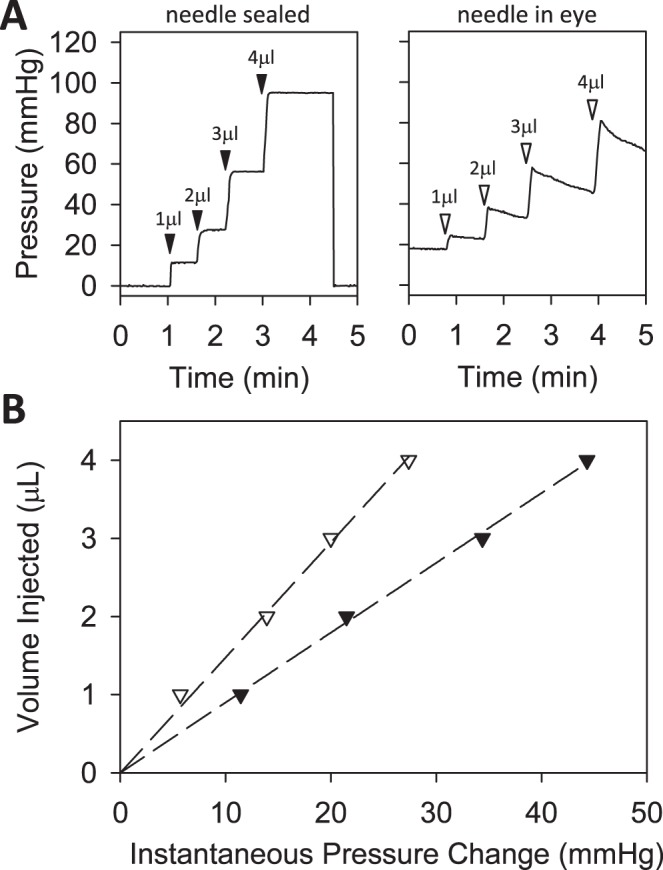
Perfusion system properties. (A) Pressure signal recorded by system in response to bolus injections of 1, 2, 3, and 4 μL (arrowheads). The system was connected to a 33-gauge needle that was sealed with cyanoacrylate (left) or inserted in the anterior chamber of a rat eye (right). (B) Peak instantaneous pressure versus bolus volume for the closed (filled symbols) and open (unfilled symbols) system. The slope of the regression line fit to the two datasets gives the system compliance (0.089 [0.087, 0.091] μL/mm Hg) and combined ocular and system compliance (0.148 [0.142, 0.154] μL/mm Hg), respectively.
Rat Eye Perfusions
Aqueous humor dynamics were quantified for 17 rats. Figure 3A shows representative data from a CF experiment. Following each step in perfusion rate IOP settled over 10 to 30 minutes to a plateau level. Figure 3B plots net flow  versus plateau IOP. The x-intercept (zero net flow) is the resting IOP. Data are all positive (outward flow) because the pump only infused fluid. Linear regression gives an outflow facility of
  = 0.025 μL/min/mm Hg for this animal. Figure 4A shows representative data from a mCP experiment. Following each step in set point, pump duty cycle
  increased, which raised IOP to the specified range and maintained it there. Pump duty cycle was measured for several cycles and was stable over time irrespective of IOP set point (Supplementary Fig. S2). Figure 4B plots net flow averaged over all cycles versus IOP level. The x-intercept is again the resting IOP. Linear regression gives an outflow facility of
  = 0.022 μL/min/mm Hg for this animal. In both experiments the y-intercept is negative, indicating that the pump would have to withdraw fluid to lower IOP to zero. It may be noted that the CF technique took twice as long as the mCP technique to estimate parameter values owing to its lengthy settling times. Data repeatability was checked with a hysteresis test. Figure 5 presents a mCP experiment in which IOP was stepwise decremented and incremented from an initial set point 30 mm Hg above the resting level. Estimates of
  and y-intercept were not significantly different for the two step sequences for this animal and two other animals (P > 0.1 for each), implying that eye outflow properties were not altered by the pressure magnitudes and oscillations used in these experiments.
Figure 3.
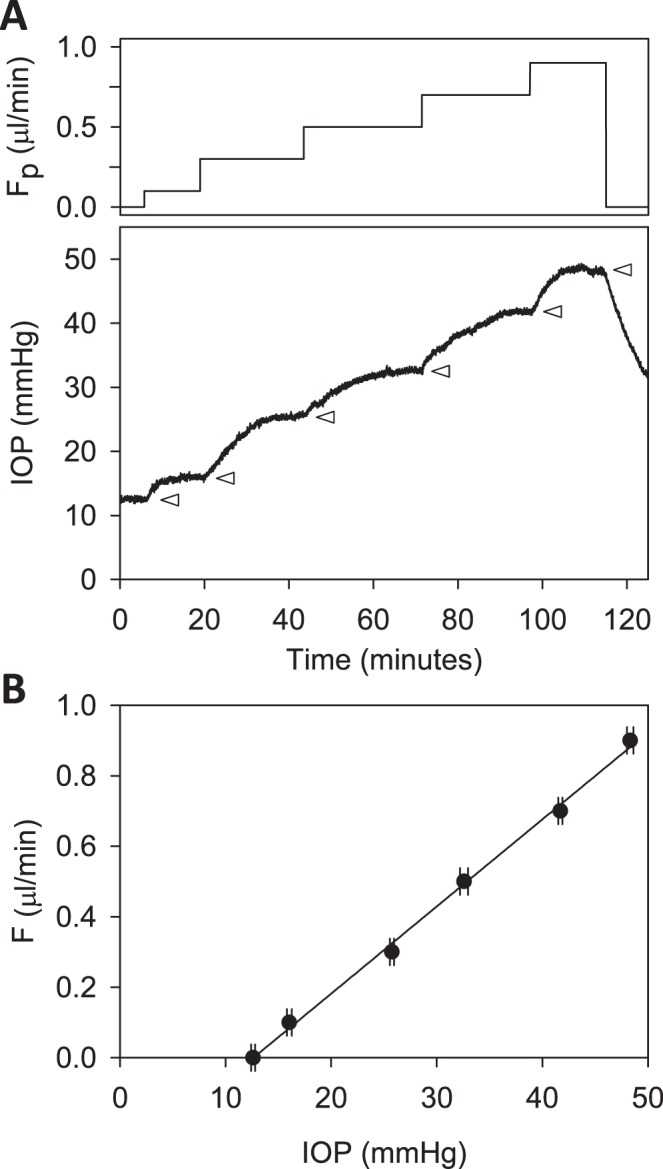
Constant-flow perfusion of a live rat eye. (A) Perfusion rate (top) and IOP response (bottom) are shown for rate increments of 0, 0.1, 0.3, 0.5, 0.7, and 0.9 μL/min. Arrowheads mark the plateau level at which IOP settled after each increment. (B) Plateau IOP versus net eye flow F, which is equivalent to Fpump in a CF experiment. The slope of the regression line fit is outflow facility (C = 0.025 [0.023, 0.027] μL/min/mm Hg), and the y-intercept represents IOP-independent flow (−0.312 [−0.351, −0.273] μL/min).
Figure 4.
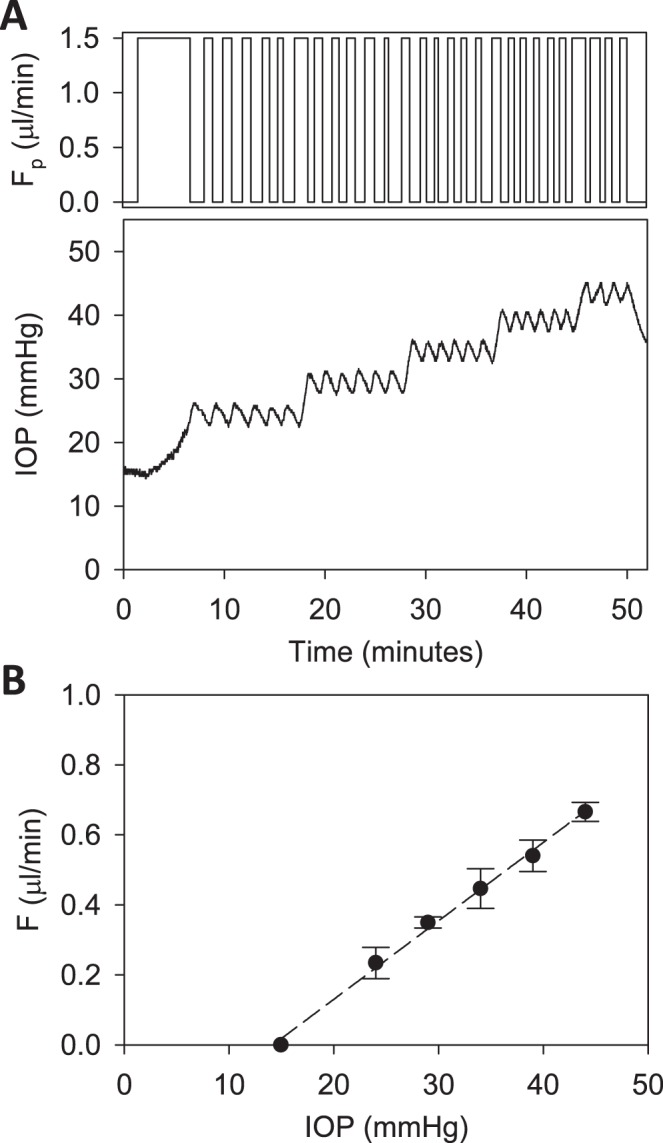
Modified constant-pressure perfusion of a live rat eye. (A) Perfusion rate (top) and IOP response (bottom) are shown for IOP set points of 25, 30, 35, 40, and 45 mm Hg. (B) IOP set point versus net eye flow F, which equals D·Fpump in a mCP experiment. The pump duty cycle D is the average of all cycles in a set point. The slope of the regression line fit is outflow facility (C = 0.022 [0.020, 0.024] μL/min/mm Hg), and the y-intercept represents IOP-independent flow (−0.318 [−0.361, −0.275] μL/min).
Figure 5.
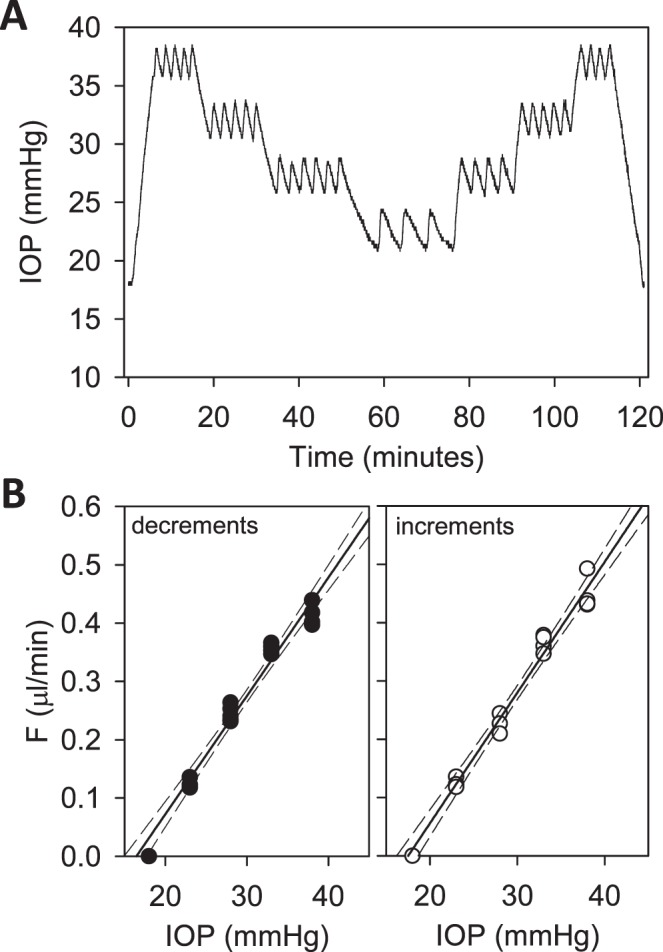
Hysteresis test. (A) IOP of a rat eye was decremented and then incremented in steps of 5 mm Hg between 38 and 23 mm Hg. (B) IOP set point versus flow measured for perfusion rate decrements (left) and increments (right). The respective slopes of the regression line are 0.021 [0.019, 0.023] and 0.022 [0.020, 0.024] μL/min/mm Hg and y-intercepts are −0.334 [−0.387, −0.281] and −0.393 [−0.448, −0.338] μL/min. Dashed lines are 95% confidence intervals on the slope.
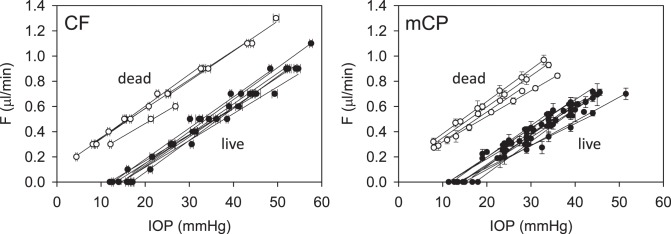
Figure 6 provides pressure-flow data for all experiments. Resting IOP averaged 14.6 ± 1.9 mm Hg in anesthetized rats. Outflow facility estimates for the CF and mCP techniques were indistinguishable across animals and between live and dead eyes (2-way ANOVA, F > 0.16, P > 0.53 for all comparisons) as well as for the same eye of individual animals (P = 0.83). Results were therefore combined to give  = 0.023 ± 0.002 μL/min/mm Hg and
  = 0.024 ± 0.002 μL/min/mm Hg. The data shifted upward in dead eyes by
  = 0.421 ± 0.050 μL/min due to the loss of aqueous production and EVP. The y-intercept became positive in dead eyes, which is indicative of IOP-independent outflow. Studies have attributed this to the unconventional pathway,19,32 which would imply that
  = 0.096 ± 0.024 μL/min at rest (n = 9).
Figure 6.
Pressure-flow data. Results of all CF (left) and mCP (right) experiments performed on live (filled) and dead (unfilled) rat eyes in situ. Lines are linear regression fits of the data.
Control Experiments
Estimates of  and
and  were assessed with control experiments. Figure 7A shows pressure-flow data before and after a shunt of known conductance was inserted in the eye. The additional pressure-dependent drainage pathway had marked effect on outflow facility, which increased by 0.028 ± 0.005 μL/min/mm Hg on average (n = 4). The increase was within measurement error of shunt conductance (P < 0.01), bolstering confidence in the accuracy of outflow facility estimates. The shunt also lowered resting IOP level, as indicated by the shift in x-intercept, but it did not significantly alter the y-intercept (−0.053 ± 0.165 μL/min, P = 0.43). Figure 7B shows pressure-flow data collected from live and dead eyes hydrated with saline via a drip (n = 3) or bath (n = 2). There was no impact on
  (P = 0.93) or
  (P = 0.75), as one would expect. The y-intercept of dead eyes, on the other hand, was no longer measurably greater than zero (
 = 0.003 ± 0.030 μL/min, P = 0.83). This suggests that the positive y-intercept in Figure 6 is not a measure of unconventional outflow rate but rather reflects some fluid loss to evaporation in nonimmersed eyes.
Figure 7.
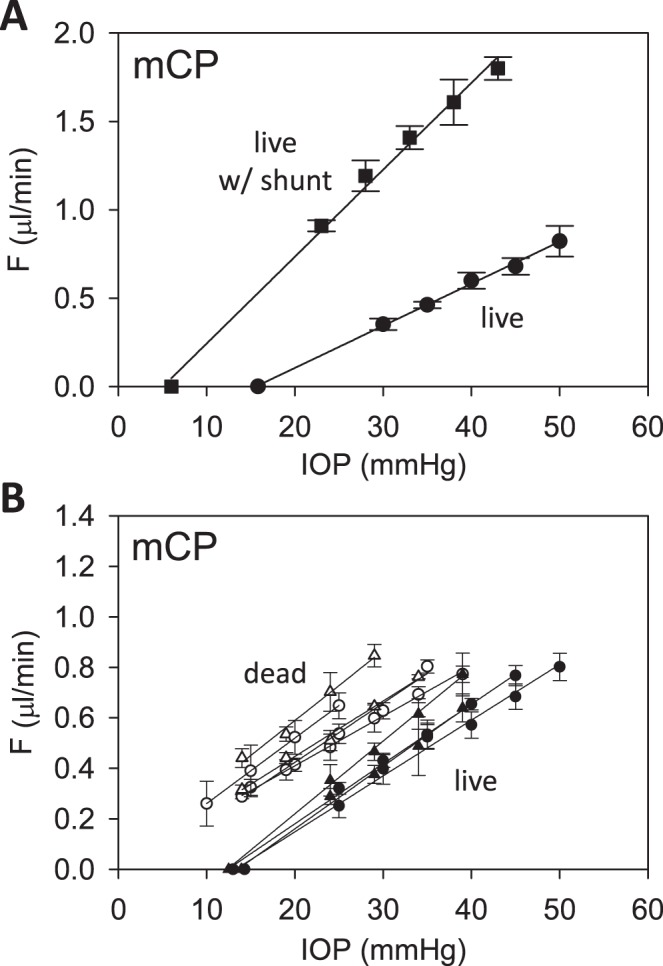
Parameter assessment. (A) mCP experiment in which pressure-flow data were collected before (circles) and after (squares) a shunt was inserted through the cornea. Lines are regression fits of the respective datasets ( = 0.024 [0.022, 0.026] and
  = 0.049 [0.045, 0.053] μL/min/mm Hg). Error bars are standard deviation. (B) Pressure-flow data from mCP experiments on live (filled) and dead (unfilled) rats in which the eye was kept moist by a constant saline drip (circles) or by immersion in a saline bath (triangle). Lines are linear regression fits of the data. Error bars are standard deviation.
Washout Test
Eye perfusion may damage outflow pathways, especially at high flow rates. This would cause parameter estimates to change over time, a phenomenon known as washout.29–31 Figure 8A shows an experiment that tested for washout by perfusing the eye at a constant rate for nearly 3 hours. IOP increased by 14 mm Hg, which translated to an outflow facility of 0.022 μL/min/mm Hg that washed out at 1.1%/h. The washout rate averaged −2.3 ± 4.9%/h for all eyes tested (n = 5), which was not measurably different from zero (P = 0.31). Figure 8B shows that the trabecular meshwork of the perfused eye was morphologically intact and angle structure looked similar to the control eye, consistent with the lack of physiological evidence for washout.
Figure 8.
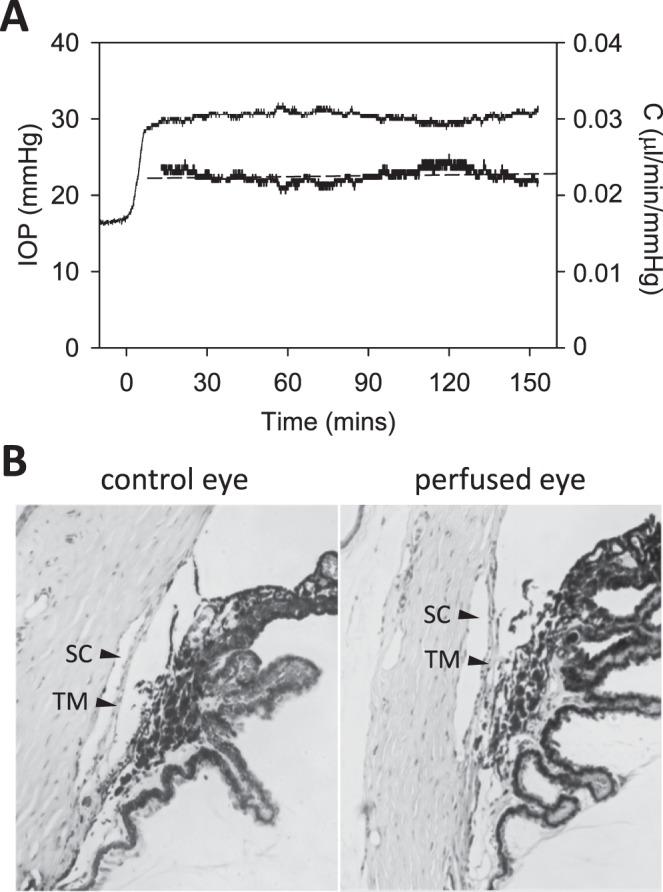
Washout test. (A) IOP (thin line) and instantaneous outflow facility (thick line) record of a live rat eye perfused for 150 minutes at a constant rate of 0.5 μL/min. Dashed line is a linear regression fit of outflow facility data (slope: 1.1%/h). (B) Thin (4-μm) section of the iridocorneal angle of nonperfused (left) and perfused (right) rat eyes stained with hematoxylin and eosin. TM, trabecular meshwork; SC, Schlemm's canal.
Discussion
This study estimated physiological parameters of aqueous humor dynamics in live healthy rat eyes. Conventional outflow facility C was determined from the slope of pressure-flow data, which were linear over the measured range and indistinguishable for live and dead eyes, as observed in mice.19,32 C may overestimate the facility of the trabecular pathway if there are other pressure-dependent outflow pathways in rat eyes as in other animals6 or if outflow facility varies with IOP.33,34 Unconventional outflow rate Fun could not be accurately estimated from the y-intercept of dead eye data. Although much of the eye is protected from evaporation and steps were taken to keep exposed surfaces moist, the intercept was nevertheless sensitive to hydration state. The finding extends reports of no pressure-independent flow in enucleated mice eyes33,34 to non-enucleated rat eyes. It also indicates that previous in situ estimates of Fun in mice are probably contaminated by evaporation.19,32 Aqueous production rate Fin and EVP could not be separately estimated from pressure-flow data alone.
Outflow facility estimates were confirmed using two different techniques (CF and mCP). The mCP technique is a variation on the constant-pressure method of measuring aqueous humor dynamics. It is simple in concept and low in cost because only IOP is measured. Flow rate is inferred from the time it takes a pump to raise IOP a small amount and the time it takes the eye to clear the infused fluid. A similar technique was recently employed to measure outflow of enucleated mice eyes,26,27 except pump rate was not fixed in magnitude but rather modulated continuously using an expensive pump microcontroller. Flow rate was specified by the modulation waveform, which has the advantage that flow can be estimated at any time and not just at end of pump duty cycles. It may extend recording time as IOP took several minutes to reach steady state after set-point changes, presumably because the microcontroller slows pump rate as IOP approaches the new set point. Other variations of the method directly measure flow with a flowmeter and use a gravity feed to eliminate the pump and control circuitry.33–35 The mCP technique was found to produce equivalent results as the CF technique in half the time. Moreover, C estimates were very consistent and were validated by inserting a shunt of known conductance into the eye. The coefficient of variation was 8%, which is similar to measurements from in vivo mouse eyes19,32,36,37 and much lower than those (15%–35%) from enucleated mouse eyes.24,27,38,39
Species Comparisons
Aqueous humor dynamics are known to scale with eye size.13 Conventional outflow facility measured for adult Brown-Norway rats is approximately 10-fold less than that of humans (0.24–0.29 μL/min/mm Hg18,40) and 4-fold more than that of mice (0.003–0.007 μL/min/mm Hg15,24,26,33,34,36–39 but see Refs. 19, 32). The scaling relationship parallels differences in anterior chamber volume among these animals.41 It is similar in scale but slightly smaller in value than prior measurements in rats (C = 0.044 ± 0.010 μL/min/mm Hg14 and 0.051 ± 0.010 μL/min/mm Hg35). Both studies examined Lewis rats so the higher facility of this albino strain may reflect the absence of pigment granules, which can accumulate in the trabecular meshwork. Aqueous humor dynamics have been noted to vary in mice with strain age and outflow facility was greatest for adult albino mice.32,39
Aqueous production rate and EVP cannot be estimated via the Goldmann equation from pressure-flow data alone. One of the parameters must be determined empirically in order to solve for the other. A reported approach is to measure EVP by lowering IOP until there is blood reflux into Schlemm's canal.15,19 The approach was attempted in rats with limited confidence in accuracy. EVP has been measured in young Sprague-Dawley rats, and it averaged 7.8 mm Hg.42 If the value applies to adult Brown-Norway rats,  estimates would predict an aqueous production rate of
  = 0.242 μL/min, which would fall statistically within the 0.350 ± 0.110 μL/min range measured by dye dilution in Lewis rats.14 Similar to outflow facility, this production rate would be approximately 10-fold less than that of humans (2.1–2.9 μL/min during the day12,43,44) and a fewfold more than that of mice (0.06–0.20 μL/min depending on age and strain15,19,32,37,45).
It has long been thought that the eyes of all animals, except humans, exhibit higher outflow facility over time when experimentally perfused. The washout phenomenon has been attributed to clearance of extracellular material in the outflow pathway, clearance of proteins in the iris root, and mechanical disruption of the trabecular meshwork.31 Human eyes were presumed to differ in some important structural or functional respect that prevents washout. Much of this work was performed on larger mammals. Recent studies have found that mouse eyes do not exhibit the phenomenon either.24,27,36 The absence of washout in rats extends the finding to another rodent.
Study Limitations
A principal limitation of this study is that parameters are estimated from the Goldmann equation under the assumption that aqueous humor dynamics are linear and only trabecular outflow is pressure dependent. The linearity assumption appears reasonable for IOP levels up to 40 mm Hg above rest in rats as data scatter nonsystematically about the regression line. The assumption might not, however, be valid at IOP levels that were not tested. For example, it has been found that the outflow facility of enucleated mouse eyes decreases to zero at low IOP and that pressure-flow data are better described by a power function.33,34 If rat eyes exhibit similar nonlinear behavior in vivo, C may grossly misestimate outflow facility at IOP levels below and well above rest.  and possibly
  may be misestimated as well, and estimation errors would compound if additional parameters depend on IOP. IOP levels below rest were not tested owing to the risk of tissue damage from aspiration, but the dead eye results do not support the presence of a power-law nonlinearity in rats since pressure-flow data of well-hydrated eyes were linear down to a y-intercept of zero. Perhaps the nonlinearity observed in mice is related to small eye size or eye enucleation. The assumption of a single IOP-driven outflow pathway requires further investigation. A secondary limitation may be that this study used pharmacologic treatments to eliminate eye movements and extend recording time. The treatments did not appear to influence aqueous humor dynamics since facility measurements were similar for euthanized animals and for a subset of animals not given treatments.
Supplementary Material
Acknowledgments
Supported by a Thomas R. Lee Award from BrightFocus Foundation and by National Institutes of Health Grants R21 EY023376 and R01 EY027037.
Disclosure: K.R. Ficarrotta, None; S.A. Bello, None; Y.H. Mohamed, None; C.L. Passaglia, None
References
- 1. Bill A. . The aqueous humor drainage mechanism in the cynomolgus monkey (Macaca irus) with evidence for unconventional routes. . 1965; 4: 911– 919. [PubMed] [Google Scholar]
- 2. Bill A. . Conventional and uveo-scleral drainage of aqueous humour in the cynomolgus monkey (Macaca irus) at normal and high intraocular pressures. . 1966; 5: 45– 54. [DOI] [PubMed] [Google Scholar]
- 3. Gong H, Tripathi RC, Tripathi BJ. . Morphology of the aqueous outflow pathway. . 1996; 33: 336– 367. [DOI] [PubMed] [Google Scholar]
- 4. Tamm ER. . The trabecular meshwork outflow pathways: structural and functional aspects. . 2009; 88: 648– 655. [DOI] [PubMed] [Google Scholar]
- 5. Alm A, Nilsson SF. . Uveoscleral outflow—a review. . 2009; 88: 760– 768. [DOI] [PubMed] [Google Scholar]
- 6. Johnson M, McLaren JW, Overby DR. . Unconventional aqueous humor outflow: a review. . 2017; 158: 94– 111. [DOI] [PMC free article] [PubMed] [Google Scholar]
- 7. Bill A. . Further studies on the influence of the intraocular pressure on aqueous humor dynamics in cynomolgus monkeys. . 1967; 6: 364– 372. [Google Scholar]
- 8. Johnson M. . What controls aqueous humour outflow resistance? . 2006; 82: 545– 557. [DOI] [PMC free article] [PubMed] [Google Scholar]
- 9. Last JA, Pan T, Ding Y. . Elastic modulus determination of normal and glaucomatous human trabecular meshwork. . 2011; 52: 2147– 2152. [DOI] [PMC free article] [PubMed] [Google Scholar]
- 10. Camras LJ, Stamer WD, Epstein D, Gonzalez P, Yuan F. . Circumferential tensile stiffness of glaucomatous trabecular meshwork. . 2014; 55: 814– 823. [DOI] [PubMed] [Google Scholar]
- 11. Overby DR, Zhou EH, Vargas-Pinto R,et al. . Altered mechanobiology of Schlemm's canal endothelial cells in glaucoma. . 2014; 111: 13876– 13881. [DOI] [PMC free article] [PubMed] [Google Scholar]
- 12. Toris CB, Yablonski ME, Wang YL, Camras CB. . Aqueous humor dynamics in the aging human eye. . 1999; 127: 407– 412. [DOI] [PubMed] [Google Scholar]
- 13. Becker B, Constant MA. . Species variation in facility of aqueous outflow. . 1956; 42: 189– 194. [DOI] [PubMed] [Google Scholar]
- 14. Mermoud A, Baerveldt G, Minckler DS, Prata JA Jr, Rao NA. . Aqueous humor dynamics in rats. . 1996; 234: S198– S203. [DOI] [PubMed] [Google Scholar]
- 15. Aihara M, Lindsey JD, Weinreb RN. . Aqueous humor dynamics in mice. . 2003; 44: 5168– 5173. [DOI] [PubMed] [Google Scholar]
- 16. Reitsamer HA, Kiel JW. . A rabbit model to study orbital venous pressure, intraocular pressure, and ocular hemodynamics simultaneously. . 2002; 43: 3728– 3734. [PubMed] [Google Scholar]
- 17. Zeimer RC, Gieser DK, Wilensky JT, Noth JM, Mori MM, Odunukwe EE. . A practical venomanometer. Measurement of episcleral venous pressure and assessment of the normal range. . 1983; 101: 1447– 1449. [DOI] [PubMed] [Google Scholar]
- 18. Feghali JG, Azar DT, Kaufman PL. . Comparative aqueous outflow facility measurements by pneumatonography and Schiotz tonography. . 1986; 27: 1776– 1780. [PubMed] [Google Scholar]
- 19. Millar JC, Clark AF, Pang IH. . Assessment of aqueous humor dynamics in the mouse by a novel method of constant-flow infusion. . 2011; 52: 685– 694. [DOI] [PubMed] [Google Scholar]
- 20. Pang IH, Clark AF. . Rodent models for glaucoma retinopathy and optic neuropathy. . 2007; 16: 483– 505. [DOI] [PubMed] [Google Scholar]
- 21. Vidal-Sanz M, Salinas-Navarro M, Nadal-Nicolás FM,et al. . Understanding glaucomatous damage: anatomical and functional data from ocular hypertensive rodent retinas. . 2012; 31: 1– 27. [DOI] [PubMed] [Google Scholar]
- 22. Morrison JC, Cepurna WO, Johnson EC. . Modeling glaucoma in rats by sclerosing aqueous outflow pathways to elevate intraocular pressure. . 2015; 141: 23– 32. [DOI] [PMC free article] [PubMed] [Google Scholar]
- 23. McNulty R, Wang H, Mathias RT, Ortwerth BJ, Truscott RJW, Bassnett S. . Regulation of tissue oxygen levels in the mammalian lens. . 2004; 559: 883– 898. [DOI] [PMC free article] [PubMed] [Google Scholar]
- 24. Lei Y, Overby DR, Boussommier-Calleja A, Stamer WD, Ethier CR. . Outflow physiology of the mouse eye: pressure dependence and washout. . 2011; 52: 1865– 1871. [DOI] [PMC free article] [PubMed] [Google Scholar]
- 25. Bello SA, Malavade S, Passaglia CL. . Development of a smart pump for monitoring and controlling intraocular pressure. . 2017; 45: 990– 1002. [DOI] [PMC free article] [PubMed] [Google Scholar]
- 26. Ko MK, Yelenskiy A, Gonzalez JM Jr, Tan JC. . Feedback-controlled constant-pressure anterior chamber perfusion in live mice. . 2014; 20: 163– 170. [PMC free article] [PubMed] [Google Scholar]
- 27. Kizhatil K, Chlebowski A, Tolman NG,et al. . An in vitro system to enhance outflow studies in mouse eyes. . 2016; 57: 5207– 5215. [DOI] [PMC free article] [PubMed] [Google Scholar]
- 28. Brubaker RF. . Goldmann's equation and clinical measures of aqueous dynamics. . 2004; 78: 633– 637. [DOI] [PubMed] [Google Scholar]
- 29. Overby D, Gong H, Qiu G, Freddo TF, Johnson M. . The mechanism of increasing outflow facility during washout in the bovine eye. . 2002; 43: 3455– 3464. [PubMed] [Google Scholar]
- 30. Lu Z, Zhang Y, Freddo TF, Gong H. . Similar hydrodynamic and morphological changes in the aqueous humor outflow pathway after washout and Y27632 treatment in monkey eyes. . 2011; 93: 397– 404. [DOI] [PMC free article] [PubMed] [Google Scholar]
- 31. Gong H, Freddo TF. . The washout phenomenon in aqueous outflow--why does it matter? . 2009; 88: 729– 737. [DOI] [PMC free article] [PubMed] [Google Scholar]
- 32. Millar JC, Phan TN, Pang IH, Clark AF. . Strain and age effects on aqueous humor dynamics in the mouse. . 2015; 56: 5764– 5776. [DOI] [PubMed] [Google Scholar]
- 33. Sherwood JM, Reina-Torres E, Bertrand JA, Rowe B, Overby DR. . Measurement of outflow facility using iPerfusion. . 2016; 11: e0150694. [DOI] [PMC free article] [PubMed] [Google Scholar]
- 34. Madekurozwa M, Reina-Torres E, Overby DR, Sherwood JM. . Direct measurement of pressure-independent aqueous humour flow using iPerfusion. . 2017; 162: 129– 138. [DOI] [PMC free article] [PubMed] [Google Scholar]
- 35. Kee C, Hong T, Choi K. . A sensitive ocular perfusion apparatus measuring outflow facility. . 1997; 16: 1198– 1201. [DOI] [PubMed] [Google Scholar]
- 36. Ko MK, Kim EK, Gonzalez JM Jr, Tan JC. . Dose- and time-dependent effects of actomyosin inhibition on live mouse outflow resistance and aqueous drainage tissues. . 2016; 6: 21492. [DOI] [PMC free article] [PubMed] [Google Scholar]
- 37. Zhang D, Vetrivel L, Verkman AS. . Aquaporin deletion in mice reduces intraocular pressure and aqueous fluid production. . 2002; 119: 561– 569. [DOI] [PMC free article] [PubMed] [Google Scholar]
- 38. Boussommier-Calleja A, Bertrand J, Woodward DF, Ethier CR, Stamer WD, Overby DR. . Pharmacologic manipulation of conventional outflow facility in ex vivo mouse eyes. . 2012; 53: 5838– 5845. [DOI] [PMC free article] [PubMed] [Google Scholar]
- 39. Boussommier-Calleja A, Overby DR. . The influence of genetic background on conventional outflow facility in mice. . 2013; 54: 8251– 8258. [DOI] [PMC free article] [PubMed] [Google Scholar]
- 40. Kazemi A, McLaren JW, Lin SC,et al. . Comparison of aqueous outflow facility measurement by pneumatonography and digital Schiøtz tonography. . 2017; 58: 204– 210. [DOI] [PMC free article] [PubMed] [Google Scholar]
- 41. Thomasy SM, Eaton JS, Timberlake MJ, Miller PE, Matsumoto S, Murphy CJ. . Species differences in the geometry of the anterior segment differentially affect anterior chamber cell scoring systems in laboratory animals. . 2016; 32: 28– 37. [DOI] [PMC free article] [PubMed] [Google Scholar]
- 42. Strohmaier CA, Reitsamer HA, Kiel JW. . Episcleral venous pressure and IOP responses to central electrical stimulation in the rat. . 2013; 54: 6860– 6866. [DOI] [PMC free article] [PubMed] [Google Scholar]
- 43. Nau CB, Malihi M, McLaren JW, Hodge DO, Sit AJ. . Circadian variation of aqueous humor dynamics in older healthy adults. . 2013; 54: 7623– 7629. [DOI] [PMC free article] [PubMed] [Google Scholar]
- 44. Liu H, Fan S, Gulati V,et al. . Aqueous humor dynamics during the day and night in healthy mature volunteers. . 2011; 129: 269– 275. [DOI] [PubMed] [Google Scholar]
- 45. Toris CB, Fan S, Johnson TV,et al. . Aqueous flow measured by fluorophotometry in the mouse. . 2016; 57: 3844– 3852. [DOI] [PMC free article] [PubMed] [Google Scholar]
Associated Data
This section collects any data citations, data availability statements, or supplementary materials included in this article.


