

Abstract
Epithelial ovarian cancer (EOC) is responsible for more cancer-related deaths than any other malignancy of the female reproductive system. The standard of care for advanced EOC involves a combination of cytoreductive surgery and platinum-based chemotherapy. Although a majority of patients respond to a platinum-containing regimen, many fail to respond to first-line treatment (platinum-refractory disease) or experience disease progression within 6 months of completing treatment (platinum-resistant disease). Even in patients who initially respond to platinum-based therapy, secondary development of platinum resistance is common. Many chemotherapeutic regimens with comparable efficacy and toxicities are available, leaving the determination of optimal therapy to the physician’s discretion.
There have been many efforts over the years to develop accurate predictors of outcomes in patients treated with chemotherapy to help inform treatment decisions. Predictive treatment markers are particularly relevant in a disease such as EOC, where a large number of similarly efficacious chemotherapy regimens are available. Chemosensitivity and resistance assays (CSRAs) are attractive approaches to interrogate the efficacy and complex biology of EOC. Some early predictive cellular tests, such as the early clonogenic assays, were limited by technical and logistical issues. Over time, changes in these assays have improved their prognostic and predictive value, but there is still a lack of widespread adoption due to methodological difficulties or limited clinical validation. Herein, we provide an overview of the evolution of CSRAs used to predict outcomes in patients treated with chemotherapy that have been evaluated for use in EOC, with a focus on the latest generation chemoresponse assay.
Keywords: Epithelial ovarian cancer, chemotherapy, outcomes markers, cancer treatment, targeted chemotherapy, chemosensitivity, ChemoFx
1. INTRODUCTION
Epithelial ovarian cancer (EOC) is the fifth most common cause of female cancer death and is responsible for more deaths than any other malignancy of the female reproductive system [1]. In 2015, about 21,000 women are expected to receive a new diagnosis in the United States, with a predicted mortality of approximately 14,000 women [1]. Symptoms are often nonspecific, and many patients with early-stage disease are asymptomatic [2]. As a consequence, the majority of EOC cases are diagnosed at advanced stages or after distant spread [3]. Prognosis for EOC correlates with the extent of residual disease after surgical excision. A recent retrospective analysis of 11,541 women diagnosed with invasive epithelial EOC between 1994 and 2001 indicated that although most patients survived less than 5 years, 31% of patients survived ≥10 years. Of note, approximately one-third of these long-term survivors were initially diagnosed with stage III and stage IV disease [4].
“Ovarian cancer” generally describes epithelial ovarian, fallopian tube, and primary peritoneal cancers [5]. Current standard of care for EOC involves cytoreductive surgery and a combination of paclitaxel and a platinum compound such as carboplatin or cisplatin [6]. Although most patients have platinum-sensitive disease, defined by disease progression >6 months from previous platinum-based treatment, resistance to platinum-based treatment is common, with roughly 20% of women experiencing disease progression ≤6 months after completing a platinum-based regimen (platinum-resistant disease [5]) or who fail to respond at all to first-line treatment (classified as platinum-refractory) [7–10]. In addition to drug resistance, EOC is characterized by frequent disease recurrences and progressively shorter disease-free intervals following subsequent rounds of treatment [3–11]. Patients with platinum-sensitive disease are commonly treated with one of several platinum-based regimens upon recurrence; for patients with platinum-resistant disease, a number of non–platinum-based regimens are typically used [6].
Despite the numerous treatment options available, the median progression-free survival (PFS) in women with primary stages IIB–IV EOC is approximately 16 to 18 months, with a median overall survival (OS) time of 43 to 44 months [3,7,8]. Consequently, there is a need for improved regimens that offer better outcomes in patients with EOC. Currently, chemotherapeutic regimens for primary and recurrent EOC are empirically physician selected; there are no validated algorithms to determine the most efficacious chemotherapy for an individual patient. Given the known variability in outcomes of patients treated with different chemotherapeutic agents, identification of more reliable predictors of effective therapy would likely improve outcomes. This review will provide an overview of the development and evolution of chemosensitivity and resistance assays (CSRAs) used to predict outcomes in patients receiving chemotherapy, with a focus on more recent clinical evidence associated with contemporary assays, while exploring the strengths, limitations, and current knowledge gaps for clinical assay use in EOC.
2. MARKERS INFORM TREATMENT SELECTION IN ONCOLOGY
Biomarkers are objectively measurable indicators of normal biological processes, pathogenic processes, or pharmacologic responses to a therapeutic intervention [12]. Importantly, 2 categories of biomarkers provide physicians with distinct information (Fig. 1). Prognostic markers forecast how a patient may fare in the absence of treatment (or despite non-targeted, standard treatment) by comparing outcomes for marker-positive and marker-negative patients when a therapeutic intervention is not included as a variable [13]. In contrast, predictive markers compare the effect of a given intervention in both marker-positive and marker-negative patients and prospectively identify individuals likely to have a benefit from a specific treatment [13].
Fig. 1.

Predictive versus prognostic biomarkers. Figures represent simplified examples of how biomarker-therapy-outcome interactions might occur. (A) In an unselected population, the effect of standard of care (SOC) vs. a new therapy (New) is assessed. Patients treated with New show increased survival time (ie, improved outcomes; green arrow) relative to patients treated with SOC. (B) When the effect of SOC is evaluated in both marker-positive (dashed red line) and marker-negative (dashed blue line) patient populations, improved survival in the marker-positive population indicates a prognostic effect of the marker (yellow arrow). (C) When the effect of SOC vs. New is assessed in both the marker-positive and marker-negative populations, patients in both populations treated with New show an increased survival time relative to patients treated with SOC (green arrows). Additionally, the marker-positive population has better outcomes than the marker-negative populations (yellow arrows), regardless of which therapy (SOC or New) is used, indicating a prognostic effect of the marker. There is no predictive effect of the marker (ie, the treatment effect is independent of marker status). (D) When the effect of SOC vs. New is assessed in both the marker-positive and marker-negative populations, New does not improve patient outcomes over SOC in the marker-negative population (circled green arrow between blue lines) but does show a large improvement in patient outcomes when compared with SOC in the marker-positive population (green arrow between red lines), indicating a predictive effect of the marker. (E) When the effect of SOC vs. New is assessed in both the marker-positive and marker-negative populations, patients show improved outcomes when treated with New vs. SOC (green arrow), regardless of marker status. There does not appear to be an effect of marker status on outcome in patients treated with either SOC or New (yellow circles), indicating no predictive or prognostic effect of the marker. Figure reproduced from Težak Z, Kondratovich MV, Mansfield E. US FDA and personalized medicine: in vitro diagnostic regulatory perspective. Per Med. 2010;7(5):517–530. With permission from Future Medicine Ltd.
Traditional molecular biomarkers that inform treatment selection include genetic, genomic, and protein expression data from tissue samples that can inform optimal treatment selection [14]. Tumor cell biology is complex, however, involving dynamic changes induced by gain or loss of function mutations that result in specific acquired capabilities, including insensitivity to antigrowth signals, tissue invasion and metastasis, and evasion of apoptosis [15]. Further, there are many molecular and biochemical mechanisms among tumor types that may underlie these capabilities in any given patient [15], many of which remain uncharacterized. Determination of the precise mechanisms of dysregulation underlying a particular cancer has the potential to allow accurate prediction of whether a given therapy is likely to succeed or fail in an individual patient.
Although at present only a subset of mechanisms underlying the ability of EOC to invade and metastasize are characterized and targetable, screening for specific genetic mutations in other solid tumors has provided an opportunity for the development and utilization of targeted therapeutics. For example, in colorectal cancer, a non-randomized evaluation of tumor samples collected from a prospective trial studying the relative contribution of cetuximab when combined with supportive care showed that K-ras genotype was predictive of colorectal tumor response to cetuximab [16]. Similar studies have shown strong associations between a mutation in K-ras and resistance to panitumumab or cetuximab in metastatic colorectal carcinoma [17]. In breast cancer, amplification of the ERBB2 (formerly HER2 or HER2/neu) gene correlates with a poorer prognosis [18]. In contrast, EOC is a disease of genetic instability with the most consistent molecular abnormality being p53 mutations [19]. Indeed, bevacizumab has recently been approved by the US Food and Drug Administration (FDA) for the treatment of platinum-resistant EOC [20]. Only the poly (ADP-ribose) polymerase inhibitors (PARPi), such as olaparib, have been able to target the DNA repair deficiencies leading to genetic instability in EOC [21]. Indeed, olaparib recently received accelerated FDA approval for treatment of patients with advanced-stage EOC with deleterious germline mutations of BRCA who have been treated with ≥3 prior lines of chemotherapy [21]. Because at least 10% of invasive EOC cases involve BRCA mutations [22] and olaparib is indicated for late stages of disease [21], treatment informed by this validated genetic marker provides benefit to a limited subgroup of patients. In a recent retrospective study in 26 patients with gynecological malignancies, a commercially-available tumor profiling report identified targeted therapies for several patients, though none were FDA-approved for use in the individual’s tumor type and no patients were candidates for olaparib [23]. Such studies highlight some challenges currently facing utilization of biomarker discovery and targeted therapy development in EOC. This suggests that selection of the most efficacious therapy in EOC may result from not only an understanding of the molecular and biochemical processes underlying cancer growth but also alternative predictive screening tools.
In addition to the genetic and driver mutations identified from interrogation of the molecular phenotype of solid tumors, additional markers, such as those based on imaging and electrophysiological analyses, have been developed [14]. For example, identification of tumor-node-metastasis staging using CT and MRI has been used as both prognostic and predictive biomarkers. Further, recent work has also indicated that other measurements, including objective quantification of physical function (ie, measurement of balance, lower extremity strength, and gait using the short physical performance battery), may function as prognostic biomarkers predicting premature mortality among cancer survivors [24].
Markers yielding a prognostic or predictive response to a therapeutic intervention may also include those obtained from CSRAs, in which response to one or more chemotherapy agent(s) is objectively quantified in vitro [25]. Here, the response to each single-agent or combination chemotherapy serves as a phenotypic marker to indicate the relative sensitivity or resistance of a tumor to a specific treatment option and may therefore be useful for informing selection of effective therapy [25]. Such assays may be particularly useful where multiple therapeutic options exist and there are no clear selection criteria for a specific regimen for an individual patient, as in EOC [6,26].
2.1. Predictors of Outcome in Patients Treated With Chemotherapy: Ideal Characteristics
Currently, empiric selection of chemotherapeutic regimens in EOC relies on data from clinical trials. However, identification of reliable predictors of outcomes in patients treated with chemotherapy could offer several advantages, including the ability to address the needs of individual patients, effective disease control, improved therapeutic outcomes, and improved quality of life. Effective predictors of treatment outcomes must satisfy certain criteria, including measurable clinical benefit. Predictors of outcomes in patients receiving chemotherapy should also allow the user to clearly prioritize between several treatment options. To be adopted for widespread use, a predictor of patient outcomes also needs to be cost-effective, accurate, reproducible, and easy to use. It is important to note that such predictive markers will indicate the relative efficacy of the drug(s) tested but not necessarily the absolute effect of a specific drug dose [27].
3. PREDICTORS OF OUTCOME IN PATIENTS TREATED WITH CHEMOTHERAPY—EARLY CSRA ASSAYS
The first attempt at large-scale predictive assays involved development of human tumor stem cell assays in the 1970s with the goal of identifying effective anticancer drugs for individual patients. Investigators developed methods that promoted growth of cell suspensions derived from human tumors in enriched agar [28]. This led to the development of cell-survival assays that measured the colony-forming efficiency of tumor-derived cells in the presence of various drugs [29]. Such assays became popular in clinical drug testing and preclinical drug screening following initial reports describing correlations between in vitro cellular responses and clinical responses. An early study indicated significant correlations between in vitro and in vivo sensitivity of EOC to anticancer drugs in all of the 18 samples tested (P<0.005) [30]. However, concerns over technical (e.g., low plating efficiencies [26]), theoretical (eg, uncertainty surrounding interpretation [31]), and other assay limitations [32] shifted focus toward the development of alternative tests.
The next stage of development of predictive assays involved use of CSRAs incorporating a variety of detection systems. In the section that follows, we discuss examples of assays that have been used to predict lack of response to chemotherapy (resistance assays) and/or response to chemotherapy (sensitivity assays; Fig 2). Although the technologies of the assays differed, all shared similar principles and general procedures: (a) tumor cells were isolated and established in an in vitro medium; (b) cells were incubated with the chemotherapeutic agent(s) of interest; (c) cell survival (or death) was assessed; and (d) a report detailing sensitivity and/or resistance to tested drugs was generated.
Fig. 2.

Developmental timeline and overview of CSRAs. Human tumor stem cell (HTSC) assays, aimed at identifying effective anticancer agents for individual patients, were initially developed in the 1970s and became popular following initial reports describing correlations between in vitro cellular responses and clinical responses. Concerns over technical, theoretical, and other limitations of HTSC assays led to the development of more sophisticated CSRAs that used a variety of in vitro detection systems to predict response (or lack thereof) to select chemotherapeutic agents. CSRA, chemosensitivity and resistance assay; DISC, differential staining cytotoxicity assay; EDRA, extreme drug resistance assay; HDRA, histoculture drug response assay; HTSC, human tumor stem cell assay; MiCK, microculture-kinetic assay; MTT, methylthiazol-tetrazolium assay.
3.1. DiSC Assay
The differential staining cytotoxicity (DiSC) assay uses differential staining/dye exclusion principles [33,34]. DiSC was originally developed to test hematologic neoplasms that grew poorly in culture [34] and assesses cellular response to chemotherapy by determining cell death within an entire population of cells [31,33]. Following culture in the presence of chemotherapeutic agents [31,34], the samples are stained with Fast Green dye; following counterstaining, “living” and “dead” cells can be differentiated based on their appearance. The DiSC assay has been used to predict response to chemotherapy in patients with lung carcinomas [34], with no large studies conducted in EOC. A number of practical limitations, including the amount of labor associated with preparing and scoring DiSC microscope slides, have minimized interest in and use of this assay.
3.2. MTT Assay
The methylthiazol-tetrazolium (MTT) assay capitalizes on the ability of live, but not dead, cells to reduce a tetrazolium-based compound (MTT) to a blue formazan product [35]. This assay has been directly compared to both DiSC and clonogenic-based assays [27,35]. Although the technical success rate was similar to that of both clonogenic and DiSC assays, the MTT assay demonstrated improved speed and accuracy due to the semi-automated nature of the test [27,35]. The assay has been examined in several malignancies, including EOC [36]. In patients with EOC and no previous treatment with cytotoxic drugs, assay results were correlated with clinical outcomes 6 to 9 months after surgery. However, OS was not significantly different between patients receiving therapy predicted to be sensitive and patients receiving therapy predicted to be resistant using the MTT assay (cumulative survival, 36% vs. 15%; P=0.19). Similar results were observed in a subgroup of patients receiving platinum-based chemotherapy (cumulative survival, 36% vs. 18%; P=0.37), indicating that the MTT assay has limited correlation with long-term outcomes in patients with EOC.
3.3. EDRA
The Extreme Drug Resistance Assay (EDRA) relies on the metabolic incorporation of tritiated thymidine (and the inhibition of thymidine incorporation by anticancer drugs) to measure cell viability [37] and predict resistance to chemotherapy [38]. In the context of this assay, extreme drug resistance is defined as tumor cell growth larger than a standard deviation over the median growth observed following exposure to a chemotherapeutic agent [39]. The EDRA has a poor capacity to predict sensitivity to drugs, but it has a high degree of accuracy when predicting drug resistance [37,40]. The use of EDRA to inform treatment selection in EOC has been studied with variable results [39,40]. Based on clinical outcome from 79 treatment-naïve patients with advanced EOC, platinum resistance detected by in vitro EDRA independently predicted progression-free survival (PFS) (6 months vs. 24 months; CI, 1.82–7.83) and OS (19% vs. 68%; CI, 1.06–5.07) [41]. In one retrospective study of 50 women with EOC, platinum-sensitive patients treated with EDRA-directed therapy had a significantly improved response rate (65% vs. 35%) and higher rate of PFS at one year (68% vs. 16%) compared with patients treated empirically [40]. However, EDRA-guided therapy did not improve outcomes in platinum-resistant patients [40] and in cases of recurrent EOC [42]. Eltabbakh et al found that EDR to paclitaxel did not necessarily correlate response to the combination of paclitaxel and cisplatin as primary therapy for EOC patients [43]. A later study evaluated the use of an EDRA in 39 patients with primary EOC; 39 patients who did not receive EDRA-guided therapy served as a control population. No significant difference in overall response rate was observed between the 2 groups (87.5% vs. 71.8%) [39]. In addition, significant differences in EDR frequency have been observed based on histological subtypes of EOC [44]. However, Matsuo et al. investigated that low drug resistance (LDR) to both platinum and taxane chemotherapy, as determined by an in vitro EDRA, predicts improved survival in patients who undergo cytoreductive surgery [45]. Hence, it is more reasonable to select an LDR agent than an EDR agent to increase the probability of tumor response. Tiersten et al. saw no significant differences in PFS outcomes between platinum-sensitive and resistant populations based on EDRAs and highlighted the need for prospective vs. retrospective studies [46]. Overall, interpretation of the value of EDRA is limited by the small sample sizes in clinical trials conducted to date and the lack of correlation between assay results and overall outcomes.
3.4. HDRA
The Histoculture Drug Response Assay (HDRA), which was developed in the early 1990s and uses the MTT endpoint for detection [47], differs from other assays in that tumor specimens maintain their 3-dimensional structure in culture [48]. In a small study of patients with EOC (n=29), overall accuracy of the test (ie, agreement between sensitivity as determined by the HDRA and observed clinical response) was shown to exceed 80% [49]. In a prospective study of 104 patients with EOC, patients predicted to be sensitive to both paclitaxel and carboplatin by HDRA (n=24) had a significantly lower recurrence rate (29.2% vs. 71.4%; P=0.02), as well as prolongation of PFS (34 months vs. 16 months, P=0.03), compared with patients deemed resistant to one or both agents (n=49) [50]. Correlation between HDRA results and OS was not assessed. A later study of 79 patients with EOC had similar findings: patients predicted to be carboplatin-sensitive by HDRA (n=22) experienced a significantly longer disease-free interval than those receiving therapy deemed resistant by the HDRA (n=15; 23.2 months vs. 13.8 months; P<0.05) [51]. Median overall survival, however, was not significantly different between the groups (60.4 months vs. 37.3 months; P=0.621), indicating a poor correlation of this assay with long-term outcomes.
3.5. MiCK Assay
The recently developed microculture kinetic (MiCK) assay measures chemotherapy-induced apoptosis [52] by measuring changes in optical density, and recent studies have investigated the use of this assay in EOC [53,54]. In an observational study of 98 evaluable patients with EOC, clinical responses of empirically treated patients correlated with MiCK assay results: patients treated with the best chemotherapy option, as determined by the MiCK assay, had longer OS relative to those treated with a non-best therapy (>45 months vs. 25 months; P<0.01). Additionally, significantly fewer patients treated with the best chemotherapy, according to MiCK, recurred (53.3% vs. 76.3% for patients treated with non-best therapy; P=0.02). A separate investigation indicated that use of the MiCK assay to select therapy led to increased OS (10.1 months vs. 4.1 months if the physician did not use the MiCK assay; P=0.02) [54]. However, of the 44 patients in this study, only 2 had EOC (other tumors, including breast, non-small cell lung cancer, and non-Hodgkin lymphoma were included in the analyses). Thus, the potential value of this assay in the management of EOC remains unproven.
4. PREDICTORS OF OUTCOME IN PATIENTS TREATED WITH CHEMOTHERAPY: CHEMORESPONSE ASSAY
While the studies described above support the feasibility of integrating a predictive assay into therapeutic decisions, several limitations, including technical difficulties [26,31,35], small sample sizes [49], poor correlations with OS [50,51], or lack of effect in critical subpopulations [40], have prevented their widespread adoption. The recently developed chemoresponse assay, ChemoFx®, integrates some technical advances and has been extensively evaluated in patients with EOC during the past decade. This in vitro test, which has been evaluated in a manner similar to that used to validate other markers designed to aid effective treatment selection [16], quantifies the effect of chemotherapeutic agents on proliferating cells derived from patient tumor specimens using direct visualization techniques (Fig. 3) [55]. Published studies have reported improved reliability and precision relative to manually performed assays due to the integration of automated cell plating, drug preparation, and drug-application techniques used to perform the test [56,57]. Analytical validation conducted using cell lines and both single-agent and combination chemotherapy demonstrated consistently low coefficients of variance (<5%) [56,57]. The section below summarizes clinical evidence (including results of a large prospective study) supporting the association between the chemoresponse assay-predicted sensitivity and resistance with treatment outcomes (i.e., PFS and OS) in patients receiving chemotherapy in both primary and recurrent EOC (Table 1).
Fig. 3.
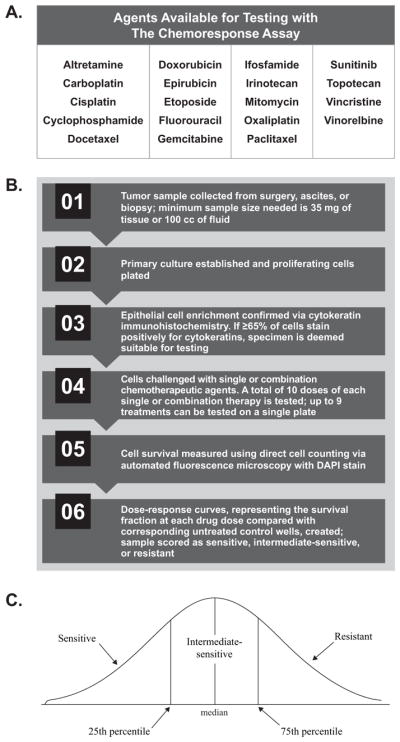
The chemoresponse assay (ChemoFx®) process overview. (A) Physicians select a panel of chemotherapeutic agents to be tested, alone or in combination, against each tumor sample (personal communication, Helomics). (B) During the automated chemoresponse assay process, tumor samples are challenged with physician-selected single or combination chemotherapeutic agents and a dose-response curve reflecting the survival fraction of each drug dose is generated. (C) The area under the dose response curve reflects the drug response score, with lower values indicating that a tumor is more sensitive to a treatment in vitro. Tumor response to each single or combination agent is then classified as sensitive, intermediate, or resistant.
Table 1.
Summary of recent publications supporting the chemoresponse assay (ChemoFx®).
| Publication | Patient Population | Study Characteristics | Key Results |
|---|---|---|---|
| Clinical Validation Studies | |||
| Tian et al. 2014a | 262 women with persistent, progressive, or recurrent EOC | Predictive analysis of patients enrolled in Rutherford et al. 2013 |
|
| Krivak et al. 2014b | 276 women with advanced primary EOC | Prospectively accrued observational study |
|
| Rutherford et al. 2013c | 262 women with persistent, progressive, or recurrent EOC; fallopian tube; or primary peritoneal cancer | Non-interventional, non-randomized study |
|
| Herzog et al. 2010d | 192 women with advanced primary EOC treated with platinum-based chemotherapy | Retrospective study |
|
| Gallion et al. 2006e | 256 patients with EOC or peritoneal cancer | Retrospective study |
|
| Clinical Utility Studies | |||
| Previs et al. 2015f | 383 women with stage III–IV Type I and Type II EOC, fallopian tube, and peritoneal cancer | Exploratory ancillary data analysis including patients from a prospective observational study (Krivak et al. 2014) |
|
| Dalton et al. 2014g | 63 women with recurrent EOC, peritoneal cancer, fallopian tube cancer, or uterine cancer | Clinical utility study of metachronous tumors |
|
| Dalton et al. 2014h | 242 women with recurrent EOC | Clinical utility study of metachronous tumors |
|
| Grendys et al. 2014i | 192 women with advanced primary EOC treated with platinum-based therapy comprising an assay-informed arm vs. historical control cohort (7685 women from 4 large, cooperative phase III drug studies) | Analysis of Herzog et al. 2010 |
|
| Economic Analyses | |||
| Plamadeala et al. 2015j | Two cohorts (baseline vs. assay-consistent) modeled from Rutherford et al. 2013 | Economic benefit study |
|
| Havrilesky et al. 2010k | 3 patient cohorts
|
Economic benefit study |
|
CI, confidence interval; EOC, epithelial ovarian cancer; HR, hazard ratio; ICER/LYS, incremental cost-effectiveness rating per life-year saved; OS, overall survival; PFI, progression-free interval; PFS, progression-free survival.
Reference 64,
reference 61,
reference 63,
reference 58,
reference 11,
reference 62,
reference 66,
reference 65,
reference 25,
reference 68,
reference 67.
4.1. Primary Epithelial Ovarian Cancer
In an early retrospective study of 192 women with advanced-stage primary EOC who received carboplatin or cisplatin as a single-agent or in combination as therapy, treatment with an agent predicted to be sensitive or intermediate-sensitive by the chemoresponse assay was associated with significant prolongation of OS relative to women treated with an agent predicted to be resistant (72.5 months and 48.6 months vs. 28.2 months, respectively; P=0.04) [58]. Further, data from this cohort was compared with a cohort of more than 7000 women with primary EOC from 4 large cooperative group drug studies with similar pathological characteristics as the chemoresponse assay cohort [7,8,59,60]. Treatment with chemotherapy predicted to be sensitive by the chemoresponse assay led to a 65% prolongation in OS (72.5 months vs. 44 months). By contrast, patients treated with therapy predicted to be resistant by the chemoresponse assay experienced a 36% decrease in OS compared with the control cohort (28.2 months vs. 44 months).
The ability of the chemoresponse assay to identify patients with platinum-resistant EOC was evaluated in a study of 276 women treated with carboplatin/paclitaxel-based chemotherapy after cytoreductive surgery [61]. Patients for whom the chemoresponse assay predicted resistance to carboplatin displayed a significantly higher risk of disease progression than patients with the chemoresponse assay results predicting sensitivity or intermediate-sensitivity (median PFS: 11.8 months vs. 16.6 months; P<0.001). Thus, the chemoresponse assay successfully identified patients who were resistant to platinum-based chemotherapy prior to treatment initiation. Importantly, the chemoresponse assay identified at least one alternative chemotherapy option that was either sensitive or intermediate-sensitive in nearly 60% of carboplatin-resistant tumors, indicating that use of the chemoresponse assay to select therapy may provide an opportunity to improve patient outcomes by informing more effective first-line treatment options. In addition, an exploratory ancillary data analysis compared pre-treatment chemoresponse assay results in 383 women with advanced stage Type I and Type II disease [62]. Thirty women were classified as Type I (grade 1 serous and endometrioid as well as clear cell and mucinous cancers) and the remaining 353 were classified as Type II (grade 2–3 serous and endometrioid as well as undifferentiated cancers). No significant difference in chemoresponse assay results was observed between Type I and Type II cancers, although Type I cancers were responsive to fewer therapies compared to Type II (P=0.183) and were more likely to display multidrug resistance (P=0.268). Further, the chemoresponse assay identified at least one sensitive treatment for the majority of patients, regardless of classification (Type I, 86%; Type II, 93%).
4.2. Recurrent Epithelial Ovarian Cancer
A non-interventional, non-randomized study in women (N=262) with recurrent EOC evaluated patient outcomes following chemotherapy and examined the correlation of outcome with predicted sensitivity using the chemoresponse assay [63]. Tumor samples were collected at the time of cancer recurrence and tested against a panel of both single and combination chemotherapeutic agents. Importantly, physicians selected treatment for all patients without knowledge of the chemoresponse assay results. Treatment with a chemotherapy predicted to be sensitive by the chemoresponse assay was associated with significantly prolonged PFS (8.8 months vs. 5.9 months in patients treated with non-sensitive therapies; P=0.009). Further, patients treated with therapies predicted to be sensitive experienced a 39% lower risk of mortality compared with patients treated with non-sensitive therapies (median OS, 37.5 months vs. 23.9 months; hazard ratio [HR], 0.61; 95% CI, 0.41–0.89; P=0.010). Additionally, although only 29% of patients received therapies predicted to be sensitive when treatment was empirically chosen by physicians, the chemoresponse assay identified at least one sensitive option for 52% of patients.
Additional analyses of this trial evaluated the potential prognostic and predictive capabilities of the chemoresponse assay [64]. The association of the chemoresponse assay-predicted responses to the administered treatment (i.e., PFS) with actual patient outcomes (match condition) compared with a randomly selected chemoresponse assay result for the same patient (mismatch condition) was assessed. The HRs for PFS under match (HR, 0.67; 95% CI, 0.50–0.91; P=0.009) and mismatch conditions (HR, 0.81; 95% CI, 0.66–0.99; based on 3000 iterations) were both <1.0, indicating prognostic capabilities of the assay. Further, the stronger association of assay results and PFS under match versus mismatch conditions supports the predictive capabilities of the chemoresponse assay. The impact of cross-drug response (i.e., the influence of either sensitivity or resistance to all assay therapies) on PFS was also assessed. Multivariate analyses demonstrated that while cross-drug response was not significantly associated with PFS (HR, 1.02; 95% CI, 0.95–1.09; P=0.629), there was a strong association between the result predicted by the chemoresponse assay for the administered treatment and PFS (HR, 0.60; 95% CI, 0.36–1.02; P=0.057). Together, these analyses provide supportive evidence for the predictive capabilities of the chemoresponse assay.
In a separate study, the correlation between the chemoresponse assay results and progression-free interval (PFI) was assessed in a series of 256 patients with EOC or peritoneal cancer [11]. In the subset (n=135) of patients treated with chemotherapeutic regimens that exactly matched the drugs tested using the chemoresponse assay, the HR for patients treated with agents predicted to be resistant by the chemoresponse assay compared with patients treated with agents predicted to be sensitive by the chemoresponse assay was 2.9 (CI, 1.4–6.3; P<0.001); similar results were achieved when the analysis included both the patients who received an agent or agents that exactly matched (n=135), as well as patients who received an agent that partially matched (n=121) the agent tested using the chemoresponse assay (HR, 2.1; CI, 1.2–3.6; P=0.01). Further, while the median PFI for patients treated with a regimen predicted to be resistant was 9 months, the median PFI for patients treated with a regimen predicted to be sensitive was not reached based on number of reported events.
Finally, to investigate whether the chemoresponse assay results from primary EOC tumor samples may inform treatment decisions at the time of recurrence, the chemoresponse assay results for 7 guideline-recommended therapies were generated using metachronous tumor pairs from 242 women with EOC [65]. Tumors were collected at both primary occurrence and at a subsequent recurrence for all patients. In general, recurrent tumor profiles were more resistant than their paired primary tumors. Increased resistance was observed for 3 out of 4 agents commonly used for primary EOC (cisplatin, P=0.012; paclitaxel, P<0.001; and docetaxel P<0.001), but only 1 of 3 agents commonly used for recurrent EOC (doxorubicin, P<0.001). Similar results were observed in a separate retrospective analysis of metachronous tumor pairs from patients diagnosed with EOC, peritoneal cancer, fallopian tube cancer, or uterine cancer [66]. A significant shift toward chemoresistance was observed between recurrent and primary tumors for paclitaxel (P=0.04), but not for other agents tested.
Further analyses evaluated the effect of time on chemoresponse assay results obtained for metachronous EOC tumor pairs [65]. When primary and recurrent tumor pairs were collected within 17 months of each other, the predicted responses to chemotherapy remained unchanged for all but 2 of the first-line therapies (paclitaxel and docetaxel; both P<0.05). When tumor specimens were collected ≥17 months apart, a significant difference in predicted sensitivity was observed for all agents tested (P≤0.02 for all comparisons).
4.3. Economic Benefits of the Chemoresponse Assay
In addition to the clinical evidence supporting the use of the chemoresponse assay in EOC, 2 independent studies have reported potential economic advantages of using this tool to inform treatment selection. In the first study, the expected cost for 6 cycles of chemotherapy was estimated in 3 groups of patients: a previously reported group of patients with 65% actual adherence to the chemoresponse assay results, a modeled group of patients with 100% adherence to the chemoresponse assay results, and a modeled group of patients based on empiric treatment selection [67]. Cost of treatment (including the cost of chemotherapeutic agents, hematopoiesis-stimulating agents, support drugs, and the chemoresponse assay test) was nearly $25,000 less for patients who were 100% compliant with treatment predicted to be sensitive ($23,986) compared with patients receiving empirically selected treatment ($48,758).
In a separate analysis, the cost-effectiveness of using the chemoresponse assay to guide treatment selection at recurrence was assessed using incremental cost-effectiveness ratios per life-year saved (ICER/LYS) values, which measure the ratio of the difference in average costs per patient to the difference in observed mean OS, in modeled groups of patients [68]. Use of the chemoresponse assay to aid in the selection of effective therapy was associated with a cost-effective ICER/LYS of roughly $2700 in both platinum-sensitive and platinum-resistant patient subgroups. A medical intervention is generally deemed cost-effective if the ICER/LYS is less than $50,000 to $100,000 per additional LYS. Further, when the least expensive therapies predicted to be sensitive by the chemoresponse assay were chosen, the average cost of 6 cycles of chemotherapy dropped below $2000 in the modeled cohort of 100% compliant patients, again indicating potential cost-saving benefits of using the chemoresponse assay to guide selection of chemotherapy.
5. PREDICTORS OF OUTCOME IN PATIENTS TREATED WITH CHEMOTHERAPY: LIMITATIONS
Despite the growing body of evidence supporting the use of a marker/assay predictive of treatment outcome to inform selection of effective chemotherapy in EOC, there are important limitations to consider.
As the understanding of the complexity of tumors has grown throughout recent decades, so has the appreciation for the many factors that may influence an individual’s response to chemotherapy. Such factors include intratumoral heterogeneity (e.g., the presence of cancer stem cells), interactions with the tumor microenvironment, and conflicting inflammatory responses from tumor-antagonizing and tumor-promoting leukocytes [69]. Additionally, metastatic disease may have unique genetic changes and microenvironment interactions distinct from the primary tumor, leading to an altered response to treatment. Additionally, acquired resistance to treatment may result from a number of mechanisms. For example, targeted agents directed at a specific pathway or mechanism may still allow some cells to survive, and these cells may then reestablish functional capability via mutation, epigenetic reprogramming, or remodeling of the stromal microenvironment. Alternatively, cells may reduce and/or shift their dependence on a particular pathway in response to cytotoxic or targeted therapy; as such, the most effective therapy selection may require a combination of therapies co-targeting several pathways at once. Given this added complexity of acquired resistance, determination of the most efficacious therapy is, in some ways, akin to aiming for a moving and evolving target throughout the course of a disease, and an in vitro predictive marker is unable to account for such complex and dynamic interactions that may influence the efficacy of a given agent. However, such a tool may still yield valuable information about the relative efficacy of specific cytotoxic agents; particularly when used in combination with predictive markers. This may be particularly important when determining first-line therapy for patients with EOC, as up to 70% of patients with advanced-stage disease will experience recurrence at some point [11]. Predictive markers provide valuable information regarding tumor sensitivity and resistance to specific agents, but cannot predict if and when a patient will experience recurrence. However, 2 studies investigating the consistency of predicted tumor response results across metachronous gynecological tumor pairs have suggested that the chemoresponse assay results from primary disease may also inform treatment at recurrence [65,66], particularly if disease recurs within 17 months (the median PFS of women with primary EOC).
Finally, a marker used to predict treatment response will provide the most accurate information when the agent(s) tested in vitro exactly match the treatment used clinically [11]. For example, the predicted response to doxorubicin should not be inferred to predict the response to pegylated liposomal doxorubicin, an alternative formulation of the drug with different uptake, clearance, and tumor exposure [70]. Thus, care must be taken in not only the choice of drugs to test, but also the interpretation and implementation of results.
Regardless of these limitations, a predictor of outcome in patients with EOC treated with chemotherapy has potential to be a useful tool. Considering the complexity of the disease state and numerous variables that may influence the performance of a given agent in vivo, physicians may consider using treatment marker results in combination with other tools (e.g., genetic screening kits to guide biologic and targeted therapy) to inform therapy selection for individual patients.
6. PREDICTORS OF CHEMOTHERAPY OUTCOMES IN EOC: GUIDELINE RECOMMENDATIONS AND MARKER VALIDATION
Current clinical practice guidelines, including those published by the American Society of Clinical Oncology (ASCO) in 2011, do not recommend the use of assays that predict sensitivity or resistance to chemotherapeutic agents outside of the clinical trial setting [29,71], and optimal evaluation of the predictive value of such assays is the subject of debate [72–74]. Additionally, current National Comprehensive Cancer Network (NCCN) guidelines recognize that some NCCN member institutions use treatment markers to inform selection of optimal chemotherapy from among the many equivalent options but indicate that current evidence does not warrant the use of such tests to supplant standard-of-care chemotherapy [6]. It is worth noting that the most recent guidance from ASCO [71] has been largely based on evaluation of a limited number of published studies available through 2010. Recent studies demonstrating advancements in predictive treatment markers should prompt potential revision of current guidelines.
In the non-interventional trial performed by Rutherford et al, patients treated with agents predicted to be sensitive by the chemoresponse assay demonstrated improved treatment outcomes (i.e., PFS and OS) compared with patients treated with agents predicted to be resistant (Fig. 4) [63]. In this study, however, patients were not randomized to a treatment group as outlined in the ASCO technology assessments [29,71]. Rather, physicians empirically treated their patients with one of 15 prospectively-specified agents or regimens and could access the chemoresponse assay results only after disease progression; therefore, no patients in this study received therapy informed by the chemoresponse assay [63]. Historically, a randomized study design, in which patients receive chemotherapy based on either empiric (i.e., physician-selected) or marker-guided treatment has been thought to be the most informative trial design necessary to define the role of a predictor of clinical outcome [71]. Such a trial would directly compare treatment outcomes (e.g., PFS and OS) following either physician-selected treatment or treatment with the single best option/regimen identified by a predictive marker. Additionally, by providing the physician in the marker arm with a single drug/regimen, this trial design would clarify interpretation of results by removing physician bias and other variables that may influence treatment selection in the experimental arm. In particular, such a randomized trial performed in patients with platinum-resistant EOC (and thus, with a generally poorer prognosis), has been deemed by some as the ideal study in which to identify whether a marker has demonstrable predictive value. As demonstrated in a randomized trial in which recurrent platinum-resistant EOC patients received either assay-guided (using an ATP-based tumor chemosensitivity assay) or physician-guided therapy, however, such a trial design is not without limitations, including the potential for physician bias [75].
Fig. 4.

Association of improvement of PFS and OS with prediction of resistance by the chemoresponse assay. Probability of PFS (left) and OS (right) is depicted over time in patients (n=262) with tumors determined by the chemoresponse assay to be either sensitive (n=75) or have intermediate resistance (n=187) to therapy. CI, confidence interval; HR, hazard ratio; OS, overall survival; PFS, progression-free survival. Figures reproduced from Rutherford T, Orr J Jr., Grendys E Jr., et al. A prospective study evaluating the clinical relevance of a chemoresponse assay for treatment of patients with persistent or recurrent ovarian cancer. Gynecol Oncol 2013; 131(2): 362–367. With permission from the authors under the terms of Creative Commons Attribution License.
More recent marker study design publications have outlined limitations of the randomized marker-guided study design by questioning its ability to determine if a marker is predictive (and not only prognostic) and highlighting the large sample size required for appropriate statistical analyses, which may be difficult in a less common disease such as EOC [76,77]. Additionally, a recent evaluation by the Center for Medical Technology Policy indicated that a trial design in which marker results guide analysis but not treatment assignment is recommended for evaluating marker utility [78]. This type of trial design has been used to support the predictive value of treatment markers, including KRAS [16] and EGFR [79], that are currently used to assist physicians in choosing effective treatments. More recently, a preplanned retrospective analysis from a study that was similar in design to previous marker validation studies [16,79], in which patients with platinum-sensitive recurrent serous EOC were randomized to receive placebo or olaparib regardless of BRCA mutation status, supported the hypothesis that olaparib was most likely to benefit patients with BRCA mutations [80]. As the understanding of cancer biology continues to grow and the use of treatment markers to identify the most appropriate therapy for an individual patient becomes more widespread, additional studies and further discussion may be necessary to achieve consensus regarding the trial design and data sufficient to validate markers used to inform effective therapy selection.
RESEARCH HIGHLIGHTS.
There is a need to optimize chemotherapy selection in epithelial ovarian cancer.
No tool used to predict response to chemotherapy has gained widespread acceptance.
We review early assays and contemporary chemosensitivity and resistance assays used to predict treatment outcomes.
We discuss strengths and limitations of using predictors of chemotherapy response.
Acknowledgments
Funding was provided by Helomics for editorial support in the development of this manuscript. Medical writing and editorial assistance was provided under the direction of the authors by Gretchen Chidester and Sasha Elliott at MedThink SciCom.
Footnotes
Send Orders for Reprints to reprints@benthamscience.ae
CONFLICT OF INTEREST
No research funding was provided for this manuscript. BJM has received commercial research grants from Amgen, Array Bio-Pharma, Eli Lilly, Genentech, Merck, Janssen/Johnson & Johnson, Novartis, and Tesaro; has received speakers bureau honoraria from Johnson & Johnson and Roche/Genentech; and is a consultant/advisory board member for Arno Therapeutics, Array Bio-Pharma, Astellas Pharma, AstraZeneca, Boehringer Ingelheim, Celgene, GlaxoSmithKline, Insys, Merck, Morphotek, Nektar Therapeutics, Qiagen, Roche/Genentech, and Tesaro. TJH has served as a consultant/advisory board member for AstraZeneca, Caris Life Sciences, Johnson & Johnson, Pfizer, and Roche. KST has served as a consultant for Helomics.
References
- 1.What are the key statistics about ovarian cancer? American Cancer Society; [Accessed November 19, 2015]. [revised 2015 March 12] Available from: http://www.cancer.org/cancer/ovariancancer/detailedguide/ovarian-cancer-key-statistics. [Google Scholar]
- 2.Cannistra SA. Cancer of the ovary. N Engl J Med. 2004;351(24):2519–29. doi: 10.1056/NEJMra041842. [DOI] [PubMed] [Google Scholar]
- 3.Jayson GC, Kohn EC, Kitchener HC, Ledermann JA. Ovarian cancer. Lancet. 2014;384(9951):1376–88. doi: 10.1016/S0140-6736(13)62146-7. [DOI] [PubMed] [Google Scholar]
- 4.Cress RD, Chen YS, Morris CR, Petersen M, Leiserowitz GS. Characteristics of long-term survivors of epithelial ovarian cancer. Obstet Gynecol. 2015;126(3):491–7. doi: 10.1097/AOG.0000000000000981. [DOI] [PMC free article] [PubMed] [Google Scholar]
- 5.Ovarian Epithelial, Fallopian Tube, and Primary Peritoneal Cancer Treatment—for health professionals (PDQ®) National Cancer Institute; [Accessed November 19, 2015]. Recurrent or persistent ovarian epithelial, fallopian tube, and primary peritoneal cancer treatment. [revised 2015 August 21] Available from: http://www.cancer.gov/cancertopics/pdq/treatment/ovarianepithelial/HealthProfessional/page6. [Google Scholar]
- 6.Ovarian, Fallopian Tube, and Primary Peritoneal Cancer—for patients. National Cancer Institute; [Accessed November 17, 2015]. Available from: http://www.cancer.gov/cancertopics/types/ovarian. [Google Scholar]
- 7.Bookman MA, Brady MF, McGuire WP, et al. Evaluation of new platinum-based treatment regimens in advanced-stage ovarian cancer: a phase III trial of the Gynecologic Cancer Intergroup. J Clin Oncol. 2009;27(9):1419–25. doi: 10.1200/JCO.2008.19.1684. [DOI] [PMC free article] [PubMed] [Google Scholar]
- 8.du Bois A, Luck HJ, Meier W, et al. A randomized clinical trial of cisplatin/paclitaxel versus carboplatin/paclitaxel as first-line treatment of ovarian cancer. J Natl Cancer Inst. 2003;95(17):1320–9. doi: 10.1093/jnci/djg036. [DOI] [PubMed] [Google Scholar]
- 9.Markman M, Bookman MA. Second-line treatment of ovarian cancer. Oncologist. 2000;5(1):26–35. doi: 10.1634/theoncologist.5-1-26. [DOI] [PubMed] [Google Scholar]
- 10.Pujade-Lauraine E, Hilpert F, Weber B, et al. Bevacizumab combined with chemotherapy for platinum-resistant recurrent ovarian cancer: The AURELIA open-label randomized phase III trial. J Clin Oncol. 2014;32(13):1302–8. doi: 10.1200/JCO.2013.51.4489. [DOI] [PubMed] [Google Scholar]
- 11.Gallion H, Christopherson WA, Coleman RL, et al. Progression-free interval in ovarian cancer and predictive value of an ex vivo chemoresponse assay. Int J Gynecol Cancer. 2006;16(1):194–201. doi: 10.1111/j.1525-1438.2006.00301.x. [DOI] [PubMed] [Google Scholar]
- 12.Biomarkers Definitions Working Group. Biomarkers and surrogate endpoints: preferred definitions and conceptual framework. Clin Pharmacol Ther. 2001;69(3):89–95. doi: 10.1067/mcp.2001.113989. [DOI] [PubMed] [Google Scholar]
- 13.Težak Ž, Kondratovich MV, Mansfield EM. US FDA and personalized medicine: in vitro diagnostic regulatory perspective. Per Med. 2010;7(5):517–30. doi: 10.2217/pme.10.53. [DOI] [PubMed] [Google Scholar]
- 14.Waterton JC, Pylkkanen L. Qualification of imaging biomarkers for oncology drug development. Eur J Cancer. 2012;48(4):409–15. doi: 10.1016/j.ejca.2011.11.037. [DOI] [PubMed] [Google Scholar]
- 15.Hanahan D, Weinberg RA. The hallmarks of cancer. Cell. 2000;100(1):57–70. doi: 10.1016/s0092-8674(00)81683-9. [DOI] [PubMed] [Google Scholar]
- 16.Karapetis CS, Khambata-Ford S, Jonker DJ, et al. K-ras mutations and benefit from cetuximab in advanced colorectal cancer. N Engl J Med. 2008;359(17):1757–65. doi: 10.1056/NEJMoa0804385. [DOI] [PubMed] [Google Scholar]
- 17.Shackelford RE, Whitling NA, McNab P, Japa S, Coppola D. KRAS testing: a tool for the implementation of personalized medicine. Genes Cancer. 2012;3(7–8):459–66. doi: 10.1177/1947601912460547. [DOI] [PMC free article] [PubMed] [Google Scholar]
- 18.Slamon DJ, Clark GM, Wong SG, Levin WJ, Ullrich A, McGuire WL. Human breast cancer: correlation of relapse and survival with amplification of the HER-2/neu oncogene. Science. 1987;235(4785):177–82. doi: 10.1126/science.3798106. [DOI] [PubMed] [Google Scholar]
- 19.Coward JI, Middleton K, Murphy F. New perspectives on targeted therapy in ovarian cancer. Int J Womens Health. 2015;7:189–203. doi: 10.2147/IJWH.S52379. [DOI] [PMC free article] [PubMed] [Google Scholar]
- 20.Liu FW, Cripe J, Tewari KS. Anti-angiogenesis therapy in gynecologic malignancies. Oncology (Williston Park) 2015;29(5):350–60. [PubMed] [Google Scholar]
- 21.LYNPARZA. Lynparza Prescribing Information. 2014 Available at: www.lynparza.com.
- 22.Pal T, Permuth-Wey J, Betts JA, et al. BRCA1 and BRCA2 mutations account for a large proportion of ovarian carcinoma cases. Cancer. 2005;104(12):2807–16. doi: 10.1002/cncr.21536. [DOI] [PubMed] [Google Scholar]
- 23.Hillman RT, Ward K, Saenz C, McHale M, Plaxe S. Barriers prevent patient access to personalized therapies identified by molecular tumor profiling of gynecologic malignancies. J Pers Med. 2015;5(2):165–73. doi: 10.3390/jpm5020165. [DOI] [PMC free article] [PubMed] [Google Scholar]
- 24.Brown JC, Harhay MO, Harhay MN. Physical function as a prognostic biomarker among cancer survivors. Br J Cancer. 2015;112(1):194–8. doi: 10.1038/bjc.2014.568. [DOI] [PMC free article] [PubMed] [Google Scholar]
- 25.Grendys EC, Jr, Fiorica JV, Orr JW, Jr, et al. Overview of a chemoresponse assay in ovarian cancer. Clin Transl Oncol. 2014;16(9):761–9. doi: 10.1007/s12094-014-1192-8. [DOI] [PMC free article] [PubMed] [Google Scholar]
- 26.Selby PJ, Raghavan D. Role of laboratory chemosensitivity testing in the selection of cancer chemotherapy for individual patients. J Clin Pathol. 1981;34(5):455–63. doi: 10.1136/jcp.34.5.455. [DOI] [PMC free article] [PubMed] [Google Scholar]
- 27.Pieters R, Huismans DR, Leyva A, Veerman AJ. Comparison of the rapid automated MTT-assay with a dye exclusion assay for chemosensitivity testing in childhood leukaemia. Br J Cancer. 1989;59(2):217–20. doi: 10.1038/bjc.1989.44. [DOI] [PMC free article] [PubMed] [Google Scholar]
- 28.Hamburger AW, Salmon SE. Primary bioassay of human tumor stem cells. Science. 1977;197(4302):461–3. doi: 10.1126/science.560061. [DOI] [PubMed] [Google Scholar]
- 29.Schrag D, Garewal HS, Burstein HJ, et al. American society of clinical oncology technology assessment: chemotherapy sensitivity and resistance assays. J Clin Oncol. 2004;22(17):3631–8. doi: 10.1200/JCO.2004.05.065. [DOI] [PubMed] [Google Scholar]
- 30.Salmon SE, Hamburger AW, Soehnlen B, Durie BG, Alberts DS, Moon TE. Quantitation of differential sensitivity of human-tumor stem cells to anticancer drugs. N Engl J Med. 1978;298(24):1321–7. doi: 10.1056/NEJM197806152982401. [DOI] [PubMed] [Google Scholar]
- 31.Weisenthal LM. Differential Staining Cytotoxicity assay: a review. Methods Mol Biol. 2011;731:259–83. doi: 10.1007/978-1-61779-080-5_22. [DOI] [PubMed] [Google Scholar]
- 32.Sumantran VN. Cellular chemosensitivity assays: an overview. Methods Mol Biol. 2011;731:219–36. doi: 10.1007/978-1-61779-080-5_19. [DOI] [PubMed] [Google Scholar]
- 33.Weisenthal LM, Marsden JA, Dill PL, Macaluso CK. A novel dye exclusion method for testing in vitro chemosensitivity of human tumors. Cancer Res. 1983;43(2):749–57. [PubMed] [Google Scholar]
- 34.Wilbur DW, Camacho ES, Hilliard DA, Dill PL, Weisenthal LM. Chemotherapy of non-small cell lung carcinoma guided by an in vitro drug resistance assay measuring total tumour cell kill. Br J Cancer. 1992;65(1):27–32. doi: 10.1038/bjc.1992.5. [DOI] [PMC free article] [PubMed] [Google Scholar]
- 35.Carmichael J, DeGraff WG, Gazdar AF, Minna JD, Mitchell JB. Evaluation of a tetrazolium-based semiautomated colorimetric assay: assessment of chemosensitivity testing. Cancer Res. 1987;47(4):936–42. [PubMed] [Google Scholar]
- 36.Taylor CG, Sargent JM, Elgie AW, Reid FD, Alton PA, Hill JG. The clinical relevance of chemosensitivity testing in ovarian cancer. Cancer Detect Prev. 1998;22(4):305–12. doi: 10.1046/j.1525-1500.1998.cdoa39.x. [DOI] [PubMed] [Google Scholar]
- 37.Sondak VK, Bertelsen CA, Tanigawa N, et al. Clinical correlations with chemosensitivities measured in a rapid thymidine incorporation assay. Cancer Res. 1984;44(4):1725–8. [PubMed] [Google Scholar]
- 38.Schinköthe T, Haeger S, Gabri MR. Practical guidelines for diagnostic use of in vitro chemosensitivity tests. Anticancer Res. 2007;27(3A):1365–7. [PubMed] [Google Scholar]
- 39.Joo WD, Lee JY, Kim JH, et al. Efficacy of taxane and platinum-based chemotherapy guided by extreme drug resistance assay in patients with epithelial ovarian cancer. J Gynecol Oncol. 2009;20(2):96–100. doi: 10.3802/jgo.2009.20.2.96. [DOI] [PMC free article] [PubMed] [Google Scholar]
- 40.Loizzi V, Chan JK, Osann K, Cappuccini F, DiSaia PJ, Berman ML. Survival outcomes in patients with recurrent ovarian cancer who were treated with chemoresistance assay-guided chemotherapy. Am J Obstet Gynecol. 2003;189(5):1301–7. doi: 10.1067/s0002-9378(03)00629-x. [DOI] [PubMed] [Google Scholar]
- 41.Holloway RW, Mehta RS, Finkler NJ, et al. Association between in vitro platinum resistance in the EDR assay and clinical outcomes for ovarian cancer patients. Gynecol Oncol. 2002;87(1):8–16. doi: 10.1006/gyno.2002.6797. [DOI] [PubMed] [Google Scholar]
- 42.Tewari KS, Mehta RS, Burger RA, et al. Conservation of in vitro drug resistance patterns in epithelial ovarian carcinoma. Gynecol Oncol. 2005;98(3):360–8. doi: 10.1016/j.ygyno.2005.04.036. [DOI] [PubMed] [Google Scholar]
- 43.Eltabbakh GH, Piver MS, Hempling RE, et al. Correlation between extreme drug resistance assay and response to primary paclitaxel and cisplatin in patients with epithelial ovarian cancer. Gynecol Oncol. 1998;70(3):392–7. doi: 10.1006/gyno.1998.5109. [DOI] [PubMed] [Google Scholar]
- 44.Cloven NG, Kyshtoobayeva A, Burger RA, Yu IR, Fruehauf JP. In vitro chemoresistance and biomarker profiles are unique for histologic subtypes of epithelial ovarian cancer. Gynecol Oncol. 2004;92(1):160–66. doi: 10.1016/j.ygyno.2003.09.030. [DOI] [PubMed] [Google Scholar]
- 45.Matsuo K, Bond VK, Eno ML, Im DD, Rosenshein NB. Low drug resistance to both platinum and taxane chemotherapy on an in vitro drug resistance assay predicts improved survival in patients with advanced epithelial ovarian, fallopian and peritoneal cancer. Int J Cancer. 2009;125(11):2721–7. doi: 10.1002/ijc.24654. [DOI] [PubMed] [Google Scholar]
- 46.Tiersten AD, Moon J, Smith HO, et al. Chemotherapy resistance as a predictor of progression-free survival in ovarian cancer patients treated with neoadjuvant chemotherapy and surgical cytoreduction followed by intraperitoneal chemotherapy: a Southwest Oncology Group Study. Oncology. 2009;77(6):395–9. doi: 10.1159/000279386. [DOI] [PMC free article] [PubMed] [Google Scholar]
- 47.Furukawa T, Kubota T, Hoffman RM. Clinical applications of the histoculture drug response assay. Clin Cancer Res. 1995;1(3):305–11. [PubMed] [Google Scholar]
- 48.Vescio RA, Redfern CH, Nelson TJ, Ugoretz S, Stern PH, Hoffman RM. In vivo-like drug responses of human tumors growing in three-dimensional gel-supported primary culture. Proc Natl Acad Sci USA. 1987;84(14):5029–33. doi: 10.1073/pnas.84.14.5029. [DOI] [PMC free article] [PubMed] [Google Scholar]
- 49.Nakada S, Aoki D, Ohie S, et al. Chemosensitivity testing of ovarian cancer using the histoculture drug response assay: sensitivity to cisplatin and clinical response. Int J Gynecol Cancer. 2005;15(3):445–52. doi: 10.1111/j.1525-1438.2005.15307.x. [DOI] [PubMed] [Google Scholar]
- 50.Jung PS, Kim DY, Kim MB, et al. Progression-free survival is accurately predicted in patients treated with chemotherapy for epithelial ovarian cancer by the histoculture drug response assay in a prospective correlative clinical trial at a single institution. Anti-cancer Res. 2013;33(3):1029–34. [PubMed] [Google Scholar]
- 51.Lee SW, Kim YM, Kim MB, et al. In vitro chemosensitivity using the histoculture drug response assay in human epithelial ovarian cancer. Acta Med Okayama. 2012;66(3):271–77. doi: 10.18926/AMO/48567. [DOI] [PubMed] [Google Scholar]
- 52.Bosserman L, Prendergast F, Herbst R, et al. The microculture-kinetic (MiCK) assay: the role of a drug-induced apoptosis assay in drug development and clinical care. Cancer Res. 2012;72(16):3901–05. doi: 10.1158/0008-5472.CAN-12-0681. [DOI] [PubMed] [Google Scholar]
- 53.Salom E, Penalver M, Homesley H, et al. Correlation of pretreatment drug induced apoptosis in ovarian cancer cells with patient survival and clinical response. J Transl Med. 2012;10:162. doi: 10.1186/1479-5876-10-162. [DOI] [PMC free article] [PubMed] [Google Scholar]
- 54.Bosserman LD, Rajurkar SP, Rogers K, et al. Correlation of drug-induced apoptosis assay results with oncologist treatment decisions and patient response and survival. Cancer. 2012;118(19):4877–83. doi: 10.1002/cncr.27444. [DOI] [PubMed] [Google Scholar]
- 55.Brower SL, Fensterer JE, Bush JE. The ChemoFx assay: an ex vivo chemosensitivity and resistance assay for predicting patient response to cancer chemotherapy. Methods Mol Biol. 2008;414:57–78. doi: 10.1007/978-1-59745-339-4_6. [DOI] [PubMed] [Google Scholar]
- 56.Heinzman JM, Rice SD, Corkan LA. Robotic liquid handlers and semiautomated cell quantification systems increase consistency and reproducibility in high-throughput, cell-based assay. JALA. 2010;15:7–14. [Google Scholar]
- 57.Mi Z, Holmes FA, Hellerstedt B, et al. Feasibility assessment of a chemoresponse assay to predict pathologic response in neoadjuvant chemotherapy for breast cancer patients. Anticancer Res. 2008;28(3B):1733–40. [PubMed] [Google Scholar]
- 58.Herzog TJ, Krivak TC, Fader AN, Coleman RL. Chemosensitivity testing with ChemoFx and overall survival in primary ovarian cancer. Am J Obstet Gynecol. 2010;203(1):68e1–6. doi: 10.1016/j.ajog.2010.01.059. [DOI] [PubMed] [Google Scholar]
- 59.Pfisterer J, Weber B, Reuss A, et al. Randomized phase III trial of topotecan following carboplatin and paclitaxel in first-line treatment of advanced ovarian cancer: a gynecologic cancer intergroup trial of the AGO-OVAR and GINECO. J Natl Cancer Inst. 2006;98(15):1036–45. doi: 10.1093/jnci/djj296. [DOI] [PubMed] [Google Scholar]
- 60.du Bois A, Weber B, Rochon J, et al. Addition of epirubicin as a third drug to carboplatin-paclitaxel in first-line treatment of advanced ovarian cancer: a prospectively randomized gynecologic cancer intergroup trial by the Arbeitsgemeinschaft Gynaekologische Onkologie Ovarian Cancer Study Group and the Groupe d’Investigateurs Nationaux pour l’Etude des Cancers Ovariens. J Clin Oncol. 2006;24(7):1127–35. doi: 10.1200/JCO.2005.03.2938. [DOI] [PubMed] [Google Scholar]
- 61.Krivak TC, Lele S, Richard S, et al. A chemoresponse assay for prediction of platinum resistance in primary ovarian cancer. Am J Obstet Gynecol. 2014;211(1):68e1–8. doi: 10.1016/j.ajog.2014.02.009. [DOI] [PubMed] [Google Scholar]
- 62.Previs R, Leath CA, 3rd, Coleman RL, et al. Evaluation of in vitro chemoresponse profiles in women with Type I and Type II epithelial ovarian cancers: An observational study ancillary analysis. Gynecol Oncol. 2015;138(2):267–71. doi: 10.1016/j.ygyno.2015.05.038. [DOI] [PubMed] [Google Scholar]
- 63.Rutherford T, Orr J, Jr, Grendys E, Jr, et al. A prospective study evaluating the clinical relevance of a chemoresponse assay for treatment of patients with persistent or recurrent ovarian cancer. Gynecol Oncol. 2013;131(2):362–7. doi: 10.1016/j.ygyno.2013.08.009. [DOI] [PubMed] [Google Scholar]
- 64.Tian C, Sargent DJ, Krivak TC, et al. Evaluation of a chemoresponse assay as a predictive marker in the treatment of recurrent ovarian cancer: further analysis of a prospective study. Br J Cancer. 2014;111(5):843–50. doi: 10.1038/bjc.2014.375. [DOI] [PMC free article] [PubMed] [Google Scholar]
- 65.Dalton HJ, Fiorica JV, Edwards RP, et al. In vitro chemoresponse in metachronous pairs of ovarian cancers. Anticancer Res. 2014;34(12):7191–6. [PubMed] [Google Scholar]
- 66.Dalton HJ, Fiorica J, McClure CK, et al. In vitro chemoresponse in metachronous pairs of gynecologic cancers. Gynecol Oncol Res Pract. 2014;1(7):1–5. doi: 10.1186/2053-6844-1-7. [DOI] [PMC free article] [PubMed] [Google Scholar]
- 67.Havrilesky LJ, Krivak TC, Mucenski JW, Myers ER. Impact of a chemoresponse assay on treatment costs for recurrent ovarian cancer. Am J Obstet Gynecol. 2010;203(2):160e1–7. doi: 10.1016/j.ajog.2010.02.054. [DOI] [PubMed] [Google Scholar]
- 68.Plamadeala V, Kelley JL, Chan JK, et al. A cost-effectiveness analysis of a chemoresponse assay for treatment of patients with recurrent epithelial ovarian cancer. Gynecol Oncol. 2015;136(1):94–8. doi: 10.1016/j.ygyno.2014.11.019. [DOI] [PubMed] [Google Scholar]
- 69.Hanahan D, Weinberg RA. Hallmarks of cancer: the next generation. Cell. 2011;144(5):646–74. doi: 10.1016/j.cell.2011.02.013. [DOI] [PubMed] [Google Scholar]
- 70.Green AE, Rose PG. Pegylated liposomal doxorubicin in ovarian cancer. Int J Nanomedicine. 2006;1(3):229–39. [PMC free article] [PubMed] [Google Scholar]
- 71.Burstein HJ, Mangu PB, Somerfield MR, et al. American Society of Clinical Oncology clinical practice guideline update on the use of chemotherapy sensitivity and resistance assays. J Clin Oncol. 2011;29(24):3328–30. doi: 10.1200/JCO.2011.36.0354. [DOI] [PubMed] [Google Scholar]
- 72.Korn EL, Freidlin B. Evaluation of chemoresponse assays as predictive markers. Br J Cancer. 2015;112(4):621–3. doi: 10.1038/bjc.2014.661. [DOI] [PMC free article] [PubMed] [Google Scholar]
- 73.Tian C, Gabrin MJ, Brower SL, Sargent DJ. Comment on: ‘Evaluation of chemoresponse assays as predictive markers’. Br J Cancer. 2015;112(12):1977–8. doi: 10.1038/bjc.2015.156. [DOI] [PMC free article] [PubMed] [Google Scholar]
- 74.Korn EL, Freidlin B. Response to comment on: ‘Evaluation of chemoresponse assays as predictive biomarkers’. Br J Cancer. 2015;112(12):1978. doi: 10.1038/bjc.2015.157. [DOI] [PMC free article] [PubMed] [Google Scholar]
- 75.Cree IA, Kurbacher CM, Lamont A, Hindley AC, Love S TCA Ovarian Cancer Trial Group. A prospective randomized controlled trial of tumour chemosensitivity assay directed chemotherapy versus physician’s choice in patients with recurrent platinum-resistant ovarian cancer. Anticancer Drugs. 2007;18(9):1093–101. doi: 10.1097/CAD.0b013e3281de727e. [DOI] [PubMed] [Google Scholar]
- 76.Freidlin B, McShane LM, Korn EL. Randomized clinical trials with biomarkers: design issues. J Natl Cancer Inst. 2010;102(3):152–60. doi: 10.1093/jnci/djp477. [DOI] [PMC free article] [PubMed] [Google Scholar]
- 77.Simon R. Clinical trial designs for evaluating the medical utility of prognostic and predictive biomarkers in oncology. Per Med. 2010;7(1):33–47. doi: 10.2217/pme.09.49. [DOI] [PMC free article] [PubMed] [Google Scholar]
- 78.Center for Medical Technology Policy. Evaluation of clinical validity and clinical utility of actionable molecular diagnostic tests in adult. Oncology. 2013 www.cmtpnct.org/resource-center/view/egd-on-mdx.
- 79.Heymach JV, Lockwood SJ, Herbst RS, Johnson BE, Ryan AJ. EGFR biomarkers predict benefit from vandetanib in combination with docetaxel in a randomized phase III study of second-line treatment of patients with advanced non-small cell lung cancer. Ann Oncol. 2014;25(10):1941–8. doi: 10.1093/annonc/mdu269. [DOI] [PMC free article] [PubMed] [Google Scholar]
- 80.Ledermann J, Harter P, Gourley C, et al. Olaparib maintenance therapy in patients with platinum-sensitive relapsed serous ovarian cancer: a preplanned retrospective analysis of outcomes by BRCA status in a randomised phase 2 trial. Lancet Oncol. 2014;15(8):852–61. doi: 10.1016/S1470-2045(14)70228-1. [DOI] [PubMed] [Google Scholar]