Abstract
Retinopathy of prematurity is a blinding disease that affects extremely low gestational age neonates. Its etiology is due to extrauterinehyperoxia in an immature antioxidant system culminating as oxidative stress on the retina. Our aim is to elucidate the role of pharmacological antioxidants in modulating the biochemical and molecular response of human retinal microvascular endothelial cells (HRECs) exposed to oxidative stress. HRECs were treated with MnTBAP [a superoxide dismutase (SOD) mimetic], catalase, EUK-134 (SOD + catalase), or saline prior to exposure to normoxia (Nx), hyperoxia (Hx), or intermittent hypoxia (IH). Media levels of SOD, catalase, glutathione peroxidase (GPx), 8-isoPGF2α, and H2O2; cellular SOD and catalase; cellular function (migration and tube formation); and antioxidant gene expression were assessed. Pharmacological antioxidants had delayed suppressive effect on 8-isoPGF2α. MnTBAP and catalase were more effective for H2O2 scavenging in the media than co-administration in the form of EUK-134. A delayed response was noted in SOD and catalase media activity in MnTBAP- and catalase-treated cells, respectively in 50% and IH. MnTBAP had progressively increased media GPx in all oxygen conditions. Antioxidants resulted in normal, but more abundant tubulogenesis in IH and Hx. The distinct temporal response to oxidative stress reflected the respective antioxidant’s potency and catalytic properties. The cell permeability of the antioxidants limited the ability to scavenge intracellular free radicals. The results support that MnTBAP or catalase may be more effective for the prevention of oxidative stress in oxygen-induced retinopathy.
Keywords: Antioxidants, Human retinal endothelial cells, Hydrogen peroxide, Intermittent hypoxia, Oxidative stress
1. INTRODUCTION
Severe retinopathy of prematurity (ROP) is a leading cause of childhood blindness [1]. The pathogenesis of ROP involves a two-phase disease process: vaso-obliteration (phase I) at birth followed by vaso-proliferation (phase II) [2]. However, new insight of the mechanism of ROP continues to expand when DiFiore et al. [3] reported a direct correlation between the frequency of intermittent hypoxia (IH) and the severity of ROP [4, 5]. Hartnett et al. [6] showed that the fluctuation of arterial oxygen corresponded to an increased risk for threshold ROP in infants and intravitreal neovascularization in rat pups. Therefore, our knowledge of the pathogenesis of ROP in the fluctuating oxygen model continues to evolve, which provides an opportunity for new drugs to be studied for clinical utility in the prevention and/or treatment of ROP.
The retinal vasculature of a preterm infant has an increased vulnerability to autoxidation by reactive oxygen species (ROS) and reactive nitrogen species (RNS), leading to cellular damage, loss of normal function, and apoptosis of retinal cells through activation of kinases and caspases [7]. This is due to the lack of autoregulation of the choroidal blood flow, the presence of vasoactive mediators (i.e., prostanoids, nitric oxide), increasing blood flow to the retina, and the insufficient production of endogenous antioxidants for scavenging the physiological levels of ROS and RNS generated during mitochondrial oxidative phosphorylation (OXPHOS) [8–11]. The electron transport chain (ETC) develops a mitochondrial inner membrane potential with complexes I–IV to promote adenosine triphosphate (ATP) production at complex V. When an oxygen molecule gets reduced by an electron at complexes I, III, and possibly II, it generates the primary radical superoxide anion (O2·−). Superoxide anion gets dismutated either nonenzymatically or enzymatically by the ubiquitous family of enzyme, superoxide dismutases (SOD), to hydrogen peroxide (H2O2) in the cytoplasmic compartments (SOD1 or CuZnSOD), mitochondrial matrix (SOD2 or MnSOD), or extracellular elements (SOD3 or ECSOD) [12]. Physiological levels of H2O2 are decomposed by cytosolic catalase, mitochondrial glutathione peroxidase-1 (GPx1) and the mitochondrial thioredoxin enzyme family (peroxidredoxins, thioredoxin, thioredoxin reductase). However, the accrued reserve of O2·− reacts with nitric oxide (NO) to form peroxynitrite anion (ONOO−) or with H2O2 to give rise to highly reactive hydroxyl radical (OH·) through the Haber–Weiss/Fenton reaction [13, 14] wreaking cellular havoc. Therefore, an intricate balance system must exist between physiological ROS production and the detoxification of ROS by mitochondrial antioxidants to prevent oxidative stress.
A multitude of pharmacological antioxidants have been experimented in the past for the prevention of ROP. Vitamin E supplementation [15, 16], vitamin A [17], D-penicillamine [18, 19], allopurinol [20], and lutein and zeaxanthin [21] showed either inconclusive evidence for routine clinical use or recommended performance of further safety and delivery trials. Our laboratory had previously demonstrated that IH upregulates complex I of the ETC leading to accumulation of O2·−. However, administration of MnTBAP (an SOD mimetic) to scavenge excess O2·− did not prevent oxygen-induced retinopathy (OIR) in the rat model [22], likely due to the accumulation of H2O2, a non-radical byproduct of SOD [23].
These previous findings led to the hypothesis that co-treatment of isolated human retinal endothelial cells (HRECs) with SOD and catalase will prevent H2O2 accumulation and have a more beneficial effect on responses to IH and oxidative stress than SOD or catalase alone. Thus, the overarching objective of this study is to examine the effects of pharmacological antioxidants on the biomolecular responses of HRECs to IH and oxidative stress.
2. MATERIAL AND METHODS
2.1. Cells
HRECs (ACBRI-181) were purchased (Cell Systems, Kirkland, WA, USA) at 80% confluence (1.5 × 10⁶ cells) and acclimatized for 2–3 h in an incubator at 37°C prior to plating in specialized medium of P75 flasks. Cells were cultured with culture boost containing growth factors, antibiotics (Bac-Off, Kirkland, WA, USA), and 5% amphotericin B. Cell media was changed every 2 days and the cells were passaged at 80% confluence. After 4 passages, the cells were seeded onto 24-well plates (4 × 10⁴ cells in 0.5 ml media/well) coated with an extracellular matrix (ECM) product that promotes cell attachment and incubated at 37°C and 100% humidity. The number of cells was determined with TC20 automatic cell counter (BioRad Life Sciences, Hercules, CA, USA).
2.2. Experimental Design
Twenty seven 24-well plates were placed in each oxygen condition: normoxia (Nx; 21% O2; 5% CO2), hyperoxia (Hx; 50% O2; 5% CO2), and intermittent hypoxia (50% O2 with brief, clustered episodes of 10% O2; 5% CO2). In each oxygen environment, 3 plates each (24, 48, and 72 h) were treated with 5 µg/ml of either MnTBAP, bovine liver catalase, or EUK-134 (Sigma Aldrich, St. Louis, MO, USA). On the day of the experiment, the media was replaced with media containing drug or placebo saline, and the cells were randomly assigned to the various oxygen environments. Media and cells were harvested at 24, 48, and 72 h post treatment and frozen at −80°C until assay. For media samples, 3 wells in each group were pooled for a total of 8 samples per group. For cell samples, 6 wells were pooled for a total of 4 samples per group.
2.3. Hx and IH Profiles
Cells exposed to Hx and IH were placed into specialized dual subchambers (PROOX model 110 oxygen regulator, Biospherix, Redfield, NY, USA) attached to a C42 oxycycler (BioSpherix, Parish, NY, USA). The oxycycler supplied O2, N2, and CO2 to the subchambers according to the oxygen profile created to simulate IH [24–28]. The oxygen environment was monitored with oxygen sensors inside the chambers. For the Hx profile, oxygen was set continuously at 50% and remained constant until the end of the experiment. For the IH profile, oxygen was set at 50% for 30 min, followed by three 1-min hypoxia (10% O2) episodes, each 10 min apart, for a total of eight clustered episodes/day consistent with the severe OIR model reported by our laboratory [29]. The oxygen content in the media was continuously monitored using an oxyvalidator with an oxygen sensor (BioSpherix) inserted directly into the media of a sacrificial well with cells.
2.4. 8-isoPGF2α Assay
Levels of 8-isoPGF2α in the media were determined using commercially available enzyme immunoassay kits purchased from Cayman Chemical (Ann Arbor, MI, USA), according to the manufacturer’s protocol.
2.5. H2O2 Assay
Levels of H2O2 in the media were determined using H2O2 fluorometric assay kits purchased from Cayman Chemical as previously described [23]. The H2O2 assay kit quantitates extracellular H2O2 produced by cultured cells. Catalase, an H2O2scavenger, was used for checking specificity of the assay.
2.6. SOD, Catalase, and GPx Activity Assays
SOD, catalase and GPx activities were assessed in the media with the use of activity kits purchased from Cayman Chemical as previously described [22, 30]. The activity of all three types of SOD was measured by the dismutation of superoxide radicals generated by xanthine oxidase and hypoxanthine. GPx catalyzes the reduction of hydroperoxides, including hydrogen peroxide, by reduced glutathione and functions to protect the cell from oxidative damage. The GPx activity assay measures all of the glutathione-dependent peroxidases. Catalase is involved in the detoxification of H2O2. It catalyzes the conversion of two molecules of H2O2 to molecular oxygen and two molecules of water. The catalase activity assay utilizes the peroxidatic function of catalase for determination of enzyme activity.
2.7. Immunofluorescence
Cells were plated at the same time onto sterile 16-well culture slides (Fisher Scientific, Pittsburgh, PA, USA) and exposed to similar conditions as described above for the 24-well plates. At the end of each experimental time, 24, 48, and 72 h, the slides were washed, fixed in 4% paraformaldehyde, permeabilized, and incubated with 8-hydroxy-2′-deoxyguanosine (8-OHdG), catalase, SOD1, SOD2, and SOD3 primary antibodies (Santa Cruz Biotechnology, Dallas, TX, USA), followed by Alexa Fluor fluorescent secondary antibodies (Life Technologies, Grand Island, NY, USA). Cells were imaged at 20× magnification using an Olympus IX73 inverted microscope system and CellSens imaging software (Olympus, Center Valley, PA, USA).
2.8. Real-Time PCR
Total RNA was harvested from cells by addition of RNAPro solution (MP Biomedicals, Solon, Ohio, USA) to the wells. RNA was extracted using the FastPrep-24 system (MP Biomedicals) and purified using the RNEasy mini cleanup kits (Qiagen, Germantown, MD, USA). Reverse transcriptase was performed using a RT2 First Strand kit (SABiosciences, Frederick, MD, USA). Real-time PCR arrays were carried out in duplicate using the Human Signaling PCR Arrays (SABiosciences/Qiagen) with a BioRad IQ5 real-time instrument (BioRad, Hercules, CA, USA), as previously described [22]. Each PCR array plate consisted of a panel of 5 housekeeping genes to normalize the PCR data; replicate genomic DNA controls to detect non-transcribed genomic DNA contamination with a high level of sensitivity; replicate reverse transcription controls to test the efficiency of the RT2 first strand reaction; and replicate positive PCR controls to test the efficiency of the PCR reaction itself using a pre-dispensed artificial DNA sequence and the primer set that detects it. The replicate controls also test for inter-well and intra-plate consistency.
2.9. Tube Formation Assay
Becton Dickinson (BD)-BioCoat Angiogenesis System-EC tube formation 96-well plates (BD Biosciences, Bedford, MA, USA) were used for migration assays. Cells from each group were plated at 2 × 10⁴ in 50 µl media in each well. The plates were incubated for 16–18 h at 37°C and then labeled with BD calcein AM fluorescent dye. The plates were imaged at 4× magnification using an Olympus BX53 microscope, DP72 digital camera, and CellSens imaging software (Olympus, Center Valley, PA, USA). The digital images were analyzed using WimTube image analysis software (Wimasis, Munich, Germany) to measure the following: (1) total tube length, which is the arithmetic sum of the length of whole tubular structures; (2) total tube, which measures the arithmetic sum of tubular structures between two branching points or a branching point and a loose end; (3) total branching point, which is the arithmetic sum of the point where three or more tubes converge; (4) total loop, which is the sum of all circular objects enclosed by the tubular structures; (5) mean loop area, which is the arithmetic mean of the area of all the loops; and (6) mean loop perimeter, which is the arithmetic mean of the border of the tubular structure of all loops. Three images were analyzed per oxygen and treatment group to calculate mean values.
2.10. Statistical Analysis
To determine differences among the Nx, Hx, and IH oxygen groups and differences among the treatment groups, two-way ANOVA was used for normally distributed data and Kruskal–Wallis test for non-normally distributed data, following Bartlett’s test for normality. Post hoc analysis was performed using the Tukey or Student–Newman–Keuls test. Significance was set at p < 0.05, and data are reported as mean ± SEM. All analyses were two-tailed and performed using SPSS software version 16.0 (SPSS Inc., Chicago, IL, USA) and GraphPad Prism software version 5.02 (GraphPad Inc., San Diego, CA, USA).
3. RESULTS
3.1. Cell Morphology
The normal cobblestone morphology of HRECs was observed at 24 and 48 h in all treated and saline groups exposed to Nx, Hx, and IH. Cellular senescence was noticeable at 72 h with an associated loss of the cobblestone morphology, especially in the saline-treated group in Nx and Hx. At 72 h, MnTBAP, catalase, and EUK-134-treated cells in Hx preserved the cobblestone morphology. However, only catalase-treated cells displayed the cobblestone morphology in IH at 72 h (data not shown).
3.2. Effect on 8-isoPGF2α
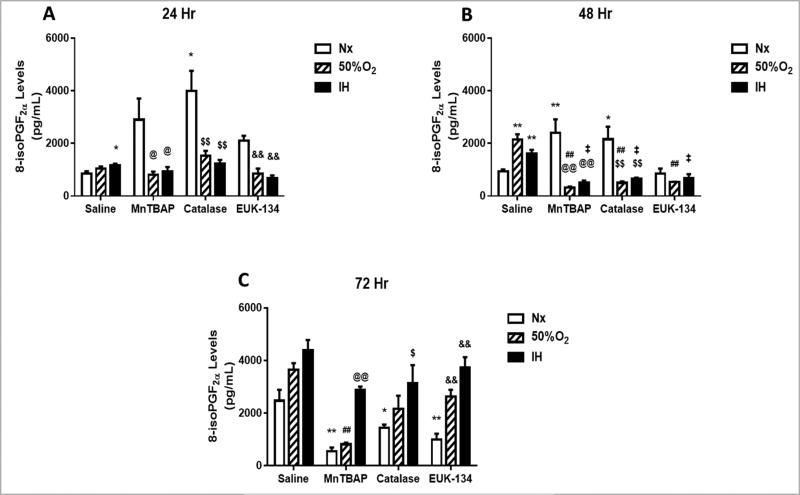
8-isoPGF2α is a reliable and proven biomarker for oxidative stress and is generated by free-radical-induced peroxidation of arachidonic acid [31]. At 24 h post treatment, all pharmacological antioxidants (MnTBAP, catalase, EUK-134) caused elevations in media levels of 8-isoPGF2α in Nx conditions, but not in Hx or IH (Figure 1A). At 48 h, levels of 8-isoPGF2α rose in the saline-treated cells exposed to Hx and IH, and declined in the antioxidant-treated cells exposed to Nx, Hx, and IH (Figure 1B). By 72 h, 8-isoPGF2α levels were elevated in the control groups and reduced in the antioxidant-treated groups, although the most significant reduction was noted with MnTBAP treatment in Nx and Hx (Figure 1C).
FIGURE 1. Effect of MnTBAP, catalase or EUK-134 on 8-isoPGF2α levels in the media of human retinal endothelial cells exposed to Nx, Hx (50% O2), or IH.
Data are presented as mean ± SEM (n = 8 samples/group). *p < 0.05, **p < 0.01 vs Saline Nx; ##p < 0.01 vs Saline 50%; ‡p < 0.01 vs Saline IH; @p < 0.05, @@p < 0.01 vs MnTBAPNx, $$p < 0.01 vs Catalase Nx; &&p < 0.01 vs EUK-134 Nx.
3.3. Effect on H2O2
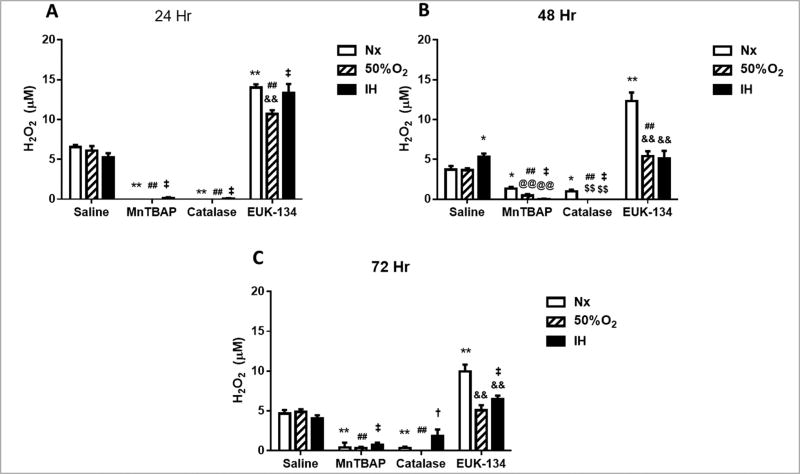
The principal mitochondrial ROS is O2·− which is rapidly dismutated to the more stable H2O2 and O2 by mitochondrial SOD (SOD2). If H2O2 is allowed to accumulate due to low catalase and GPx activities, it reacts with iron to form the highly reactive hydroxyl radical. At 24 h, both MnTBAP (SOD mimetic) and catalase successfully reduced H2O2 levels in the media during exposure to all oxygen conditions (Figure 2A). This effect was sustained at 48 (Figure 2B) and 72 h (Figure 2C). In contrast, treatment with EUK-134 (SOD and catalase) resulted in accumulation of H2O2 in all oxygen conditions (Figure 2), and only moderately declined at 72 h (Figure 2C), suggesting that co-administration of SOD and catalase may not be as effective for H2O2 scavenging as catalase alone.
FIGURE 2. Effect of MnTBAP, catalase or EUK-134 on H2O2 levels in the media of human retinal endothelial cells exposed to Nx, Hx (50% O2), or IH.
Data are presented as mean ± SEM (n = 8 samples/group). *p < 0.05, **p < 0.01 vs Saline Nx; ##p < 0.01 vs Saline 50%; †p < 0.05, ‡p < 0.01 vs Saline IH; @@p < 0.01 vs MnTBAPNx, $$p < 0.01 vs Catalase Nx; &&p < 0.01 vs EUK-134 Nx.
3.4. Effect on SOD
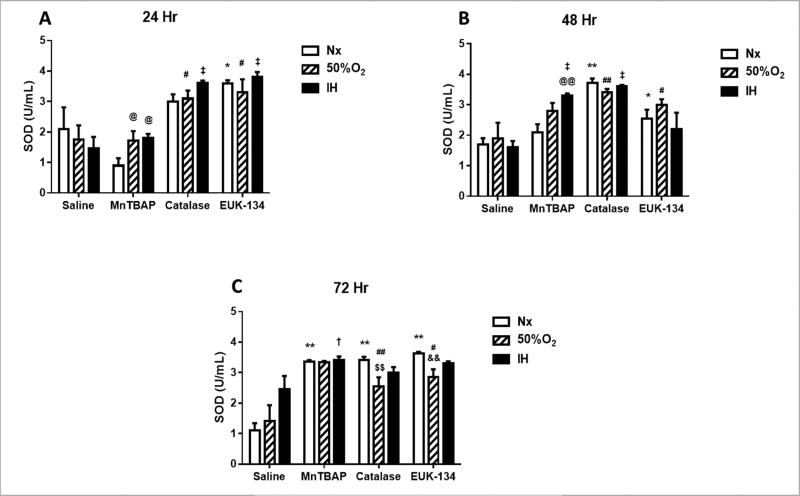
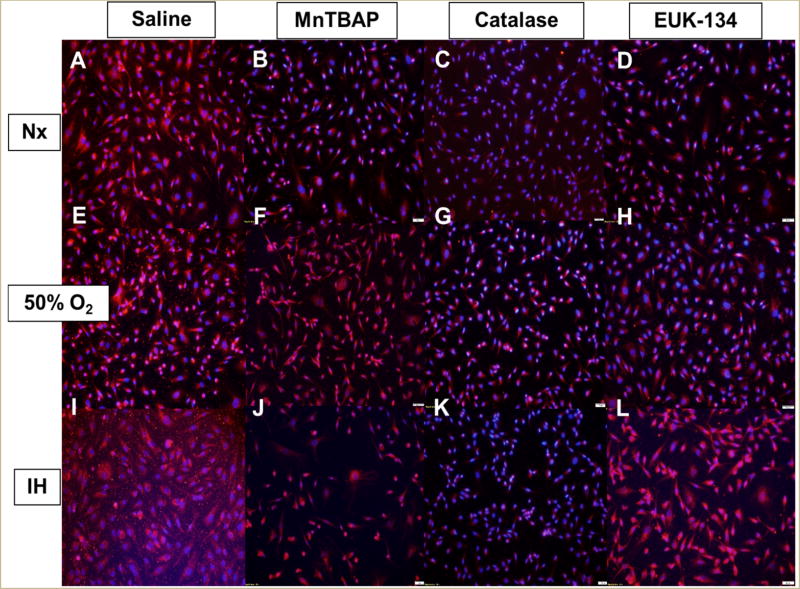
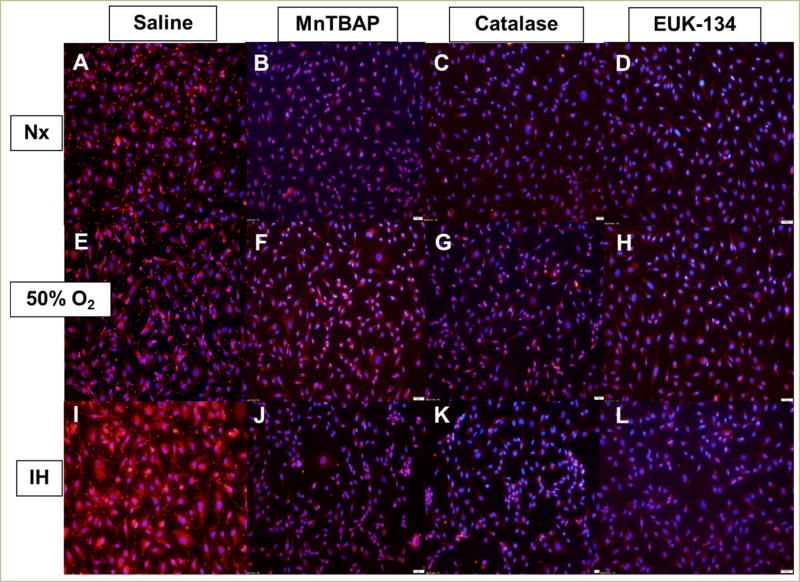
In the media, there was an immediate and significant increase in SOD activity, which includes SOD1 (cytoplasmic), SOD2 (mitochondrial), and SOD3 (extracellular), in all O2 conditions at 24 h of exposure to catalase and EUK-134 (Figure 3A). By 48 (Figure 3B) and 72 h (Figure 3C), there was a progressive increase in SOD activity in all O2 conditions with MnTBAP treatment, while SOD activity remained consistently high with catalase and EUK-134 treatment. Examination of the protein levels of specific SOD types in the HRECs showed that SOD1 was decreased in Nx with all antioxidants; however, there was no substantive change in SOD1 with MnTBAP treatment in Hx and IH, as well as with EUK-134 treatment in IH (Figure 4). IH resulted in higher expression of SOD2 in the saline-treated cells (Figure 5I). This effect was reversed with antioxidant treatment (Figure 5J–5L).
FIGURE 3. Effect of MnTBAP, catalase or EUK-134 on SOD activity levels in the media of human retinal endothelial cells exposed to Nx, Hx (50% O2), or IH.
Data are presented as mean ± SEM (n = 8 samples/group). *p < 0.05, **p < 0.01 vs Saline Nx; #p < 0.05, ##p < 0.01 vs Saline 50%; †p < 0.05, ‡p < 0.01 vs Saline IH; @p < 0.05, @@p < 0.01 vs MnTBAPNx, $$p < 0.01 vs Catalase Nx; &&p < 0.01 vs EUK-134 Nx.
FIGURE 4. Effect of MnTBAP, catalase or EUK-134 on SOD1 protein expression in human retinal endothelial cells exposed to Nx (panels A–D), Hx (50% O2, panels E–H), or IH (panels I–L).
SOD1 was determined using immunofluorescence staining. Images were captured at 20× magnification.
FIGURE 5. Effect of MnTBAP, catalase or EUK-134 on SOD2 protein expression in human retinal endothelial cells exposed to Nx (panels A–D), Hx (50% O2, panels E–H), or IH (panels I–L).
SOD2 was determined using immunofluorescence staining. Images were captured at 20× magnification.
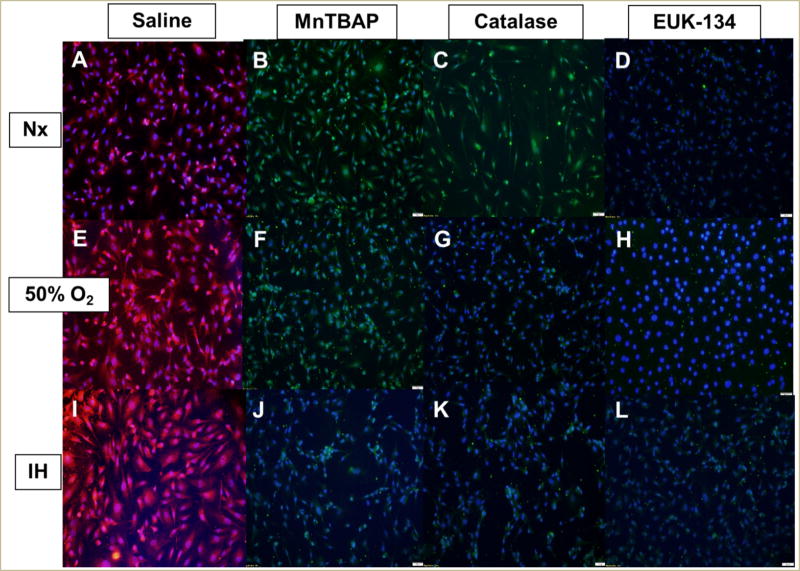
Similarly, SOD3 was suppressed with all antioxidants in all oxygen environments (Figure 6), although the most effective suppression was accomplished with EUK-134 (Figure 6D, 6H, and 6L). Real-time PCR analysis of the HRECs showed that catalase and MnTBAP treatment in Nx resulted in a >5-fold downregulation in both SOD1 and SOD2 (Table 1).
FIGURE 6. Effect of MnTBAP, catalase or EUK-134 on SOD3 protein expression in human retinal endothelial cells exposed to Nx (panels A–D), Hx (50% O2, panels E–H), or IH (panels I–L).
SOD3 was determined using immunofluorescence staining. Images were captured at 20× magnification.
TABLE1.
Fold change in antioxidant genes at 72 h
| Genes | Sal 50% |
Sal IH |
Cat Nx |
Cat 50% |
Cat IH |
MnT Nx |
MnT 50% |
MnT IH |
EUK Nx |
EUK 50% |
EUK IH |
|---|---|---|---|---|---|---|---|---|---|---|---|
| CAT | −5.5 | 1.9 | −19.2 | −2.7 | −18.4 | −48.6 | −7.1 | −2.9 | −15.0 | −28.4 | −5.9 |
| GPX1 | −2.1 | −1.1 | −1.7 | 1.3 | −1.9 | −2.4 | −2.4 | −2.4 | −1.2 | −2.4 | −2.4 |
| GPX2 | −26.7 | 1.2 | −14.9 | −17.7 | −4.6 | −128.8 | −113.0 | −5.7 | −76.4 | −165.2 | −46.0 |
| GPX3 | −2.2 | 1.7 | −5.1 | −4.5 | −6.6 | −21.8 | −6.9 | −2.1 | −3.3 | 1.0 | −21.8 |
| GPX4 | −1.4 | 1.5 | −2.5 | −4.4 | −4.9 | −38.4 | −6.2 | −1.6 | −3.8 | −1.8 | −20.2 |
| GPX5 | −4.7 | 2.0 | −5.1 | −5.6 | −2.4 | −111.4 | −28.6 | −1.6 | −22.0 | −38.2 | −9.3 |
| GPX6 | −1.3 | 1.3 | −2.4 | −2.4 | 1.6 | −2.4 | −1.9 | −2.0 | −1.0 | 1.4 | −2.4 |
| SOD1 | −2.8 | 1.1 | −8.0 | −2.6 | −1.9 | −144.8 | −2.8 | −2.5 | −4.1 | −4.2 | −2.7 |
| SOD2 | −3.3 | −1.1 | −11.7 | −2.1 | 1.2 | −152.6 | −3.1 | −2.0 | −4.4 | −3.2 | −2.4 |
| SOD3 | −1.5 | 1.0 | 1.0 | 1.2 | −1.1 | −1.4 | 1.1 | −1.4 | 1.1 | −1.5 | 1.3 |
Note: Genes of interest are: CAT (catalase); GPX (glutathione peroxidase); SOD (superoxide dismutase). Data are fold change from saline treatment in normoxic conditions (Sal Nx). Genes that are >5-fold downregulated are in red font. Sal (saline); Cat (catalase); MnT (MnTBAP); EUK (EUK-134); Nx (normoxia); IH (intermittent hypoxia).
3.5. Effect on Catalase
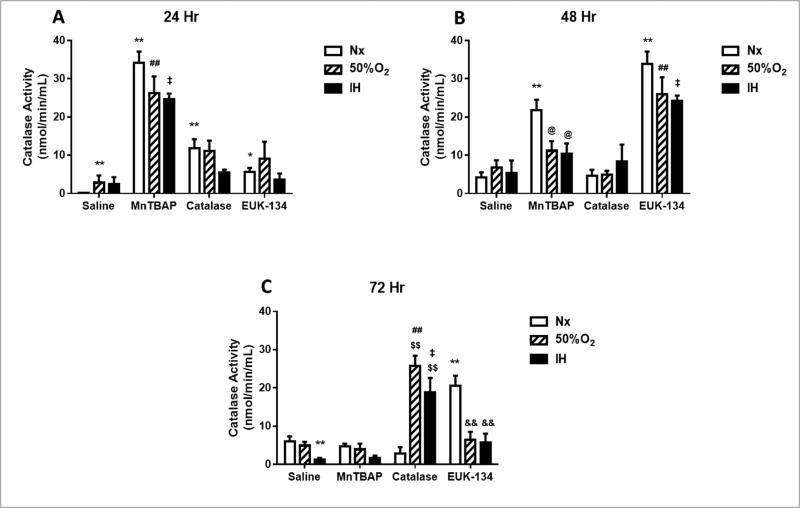
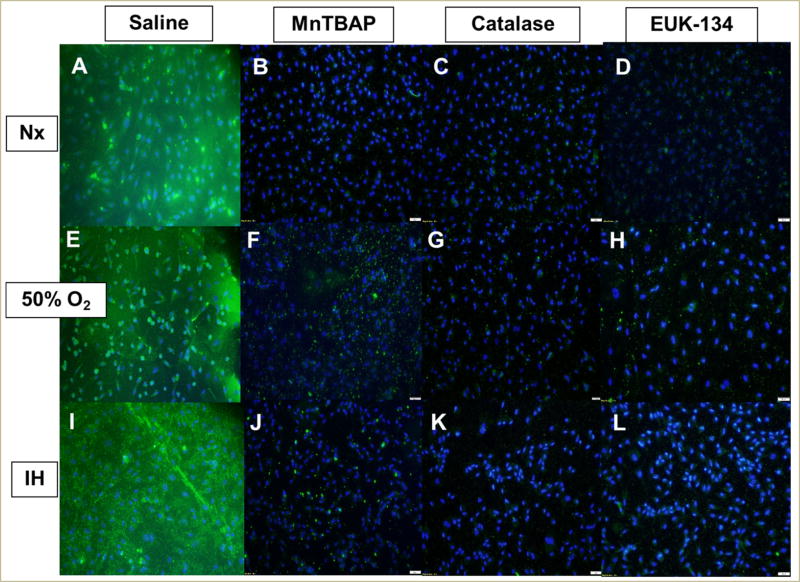
In the media, MnTBAP treatment increased catalase activity levels at 24 h in all oxygen conditions, with less pronounced elevations when exposed to catalase or EUK-134 compared to the saline-treated cells (Figure 7A). By 48 (Figure 7B) and 72 h (Figure 7C), the effect of MnTBAP progressively declined to reach placebo levels at 72 h. In contrast, catalase activity increased at 72 h, but only in the Hx and IH groups (Figure 7C). EUK-134 caused a peak in catalase activity at 48 h in all oxygen environments, but this effect was not sustained at 72 h, particularly in the Hx and IH groups. In the HRECs, all antioxidants suppressed catalase expression in all oxygen environments compared to saline treatment (Figure 8). Real-time PCR analysis of the HRECs showed that EUK-134 consistently downregulated catalase expression by >5-fold in all oxygen environments (Table 1).
FIGURE 7. Effect of MnTBAP, catalase or EUK-134 on catalase activity levels in the media of human retinal endothelial cells exposed to Nx, Hx (50% O2), or IH.
Data are presented as mean ± SEM (n = 8 samples/group).
FIGURE 8. Effect of MnTBAP, catalase or EUK-134 on catalase protein expression in human retinal endothelial cells exposed to Nx (panels A–D), Hx (50% O2, panels E–H), or IH (panels I–L).
Catalase was determined using immunofluorescence staining. Images were captured at 20× magnification.
3.6. Effect on GPx
At 24 h, MnTBAP significantly elevated Gpx levels in the media in all oxygen conditions compared to saline, catalase, and EUK-134 treatment, and the levels doubled by 72 h (data not shown). In the cells, MnTBAP treatment in Nx and Hx; and EUK-134 treatment in IH caused a >5-fold downregulation in GPx-2, -3, -4, and -5 expression (Table 1).
3.7. Cell Migration and Tube Formation Assay
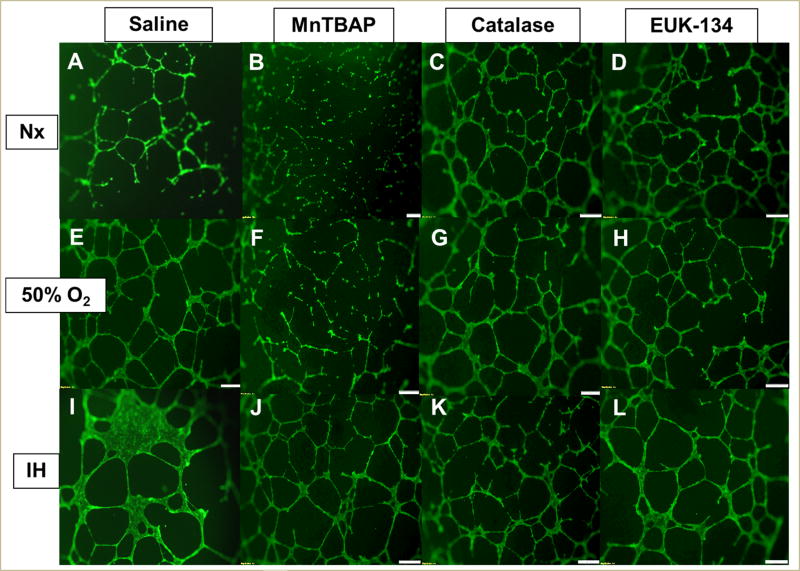
The HRECs underwent proliferation, migration, and differentiation into networks of branching polygons and anastomosis of tubes forming a central vacuole. Table 2 presents the morphometric analyses of HREC function and capacity to form tubes at 24 h. Data showed that MnTBAP, catalase, and EUK-134 led to less tube formation in Hx than Nx-exposed cells. However, cells treated with catalase and EUK-134 in IH formed significantly more tubes than Nx cells. Saline-treated cells exposed to Hx and IH formed more tubes than Nx. At 48 h, treatment with MnTBAP, catalase, and EUK-134 in Hx and IH resulted in significantly less tube formation compared to treatment in Nx. However, compared to saline, MnTBAP, catalase, and EUK-134 caused more tube formation in Nx and IH, but not in Hx (Table 3). By 72 h, MnTBAP treatment in Nx suppressed tube formation and branching points compared to saline treatment. Catalase and EUK-134 caused an opposite effect (Table 4). This is reflected by Figure 9. A similar response was noted in Hx. However, MnTBAP treatment caused more tube formation in cells exposed to IH compared to Nx. Similarly, MnTBAP, catalase, and EUK-134 treatment in IH caused more tube formation compared to saline treatment in IH although the saline-treated cells exposed to IH displayed obvious thicker polygonal, tumorigenic cells at 72 h (Figure 9I).
TABLE 2.
Morphometric analysis of cells at 24 h post treatment
| Groups | Mean No. Tubes |
Mean Tube Length (µm) |
Mean Total Branching Points |
Mean No. Loops |
Mean Loop Area (µm2) |
Mean Loop Perimeter |
Mean Loop Perimeter/Area |
|---|---|---|---|---|---|---|---|
| Normoxia (Nx) | |||||||
| Saline | 70.3 ± 6.9 | 9328.0 ± 763.4 | 29 ± 5.1 | 6.3 ± 2.3 | 10340.4 ± 5447.5 | 370.7 ± 102.3 | 0.05 ± 0.0095 |
| Catalase | 116.3 ± 23.8 | 10094.3 ± 880.7 | 39.3 ± 9.6 | 3.7 ± 0.7 | 20048.2 ± 11470.8 | 538.3 ± 177.3 | 0.04 ± 0.014 |
| MnTBAP | 225.3 ± 24.5** | 18953.0 ± 1893.1** | 105.0 ± 14.0** | 23.3 ± 4.5** | 10737.8 ± 2356.5 | 444.0 ± 48.8 | 0.04 ± 0.006 |
| EUK-134 | 70.7 ± 6.1 | 6356.9 ± 479.3 | 17.3 ± 3.9 | 3.0 ± 1.0 | 2348.5 ± 427.9 | 214.5 ± 24.2 | 0.09 ± 0.007* |
| Hyperoxia (50% O2) | |||||||
| Saline | 188.0 ± 10.6## | 18107.1 ± 547.1## | 95.0 ± 6.5## | 20.7 ± 2.4# | 37211.2 ± 1806.1# | 807.0 ± 32.9# | 0.02 ± 0.0004# |
| Catalase | 38.7 ± 8.4**## | 2866.7 ± 393.0**## | 6.7 ± 1.5** | 0** | 0** | 0** | 0**# |
| MnTBAP | 37.0 ± 37.0**## | 2733.0 ± 1682.6**## | 5.7 ± 3.8**## | 0.3 ± 0.3**## | 0** | 0** | 0** |
| EUK-134 | 32.7 ± 3.9**## | 3066.7 ± 819.2**# | 7.0 ± 2.5** | 0** | 0** | 0**## | 0**## |
| Intermittent Hypoxia (IH) | |||||||
| Saline | 117.0 ± 11.5# | 12820.1 ± 691.0# | 59.7 ± 7.9# | 17.0 ± 3.6 | 31630.9 ± 7319.5 | 748.0 ± 116.8# | 0.02 ± 0.002# |
| Catalase | 212.7 ± 15.7**# | 15566.5 ± 1564.3# | 95.3 ± 12.5## | 15.3 ± 6.0 | 29910.8 ± 17402.6# | 720.9 ± 262.9 | 0.03 ± 0.006 |
| MnTBAP | 131.7 ± 15.0# | 7847.8 ± 824.7*## | 29.0 ± 4.6## | 0.7 ± 0.7**## | 879.6 ± 879.6**## | 76.6 ± 76.6 | 0.03 ± 0.03 |
| EUK-134 | 164.3 ± 11.9## | 11460.9 ± 579.9## | 61.0 ± 3.5## | 8.5 ± 2.0 | 8311.6 ± 1169.4## | 340.5 ± 18.4## | 0.04 ± 0.004## |
Note: Data are mean ± SEM (n = 3 wells per group).
p < 0.05,
p < 0.01 vs Saline;
p < 0.05,
p < 0.01 vs Nx.
TABLE 3.
Morphometric analysis of cells at 48 h post treatment
| Groups | Mean No. Tubes |
Mean Tube Length (µm) |
Mean Total Branching Points |
Mean No. Loops |
Mean Loop Area (µm2) |
Mean Loop Perimeter |
Mean Loop Perimeter/ Area |
|---|---|---|---|---|---|---|---|
| Normoxia (Nx) | |||||||
| Saline | 105.3 ± 9.6 | 11243.5 ± 784.6 | 57.0 ± 5.1 | 15.7 ± 0.88 | 32299.3 ± 4872.2 | 679.4 ± 37.5 | 0.02 ± 0.002 |
| Catalase | 297.3 ± 12.6** | 21061.0 ± 409.1** | 136.0 ± 3.2** | 30.0 ± 1.2 | 22834.2 ± 3197.3 | 679.1 ± 43.0 | 0.03 ± 0.002* |
| MnTBAP | 343.7 ± 5.3** | 24067.6 ± 1028.6** | 162.0 ± 5.6** | 42.0 ± 4.9 | 20751.5 ± 1550.8 | 660.4 ± 29.8 | 0.03 ± 0.0009* |
| EUK-134 | 305.0 ± 9.5** | 21579.1 ± 1064.3** | 151.0 ± 10.5** | 36.7 ± 8.4 | 24807.9 ± 2541.0 | 687.5 ± 63.7 | 0.03 ± 0.003* |
| Hyperoxia (50% O2) | |||||||
| Saline | 264.7 ± 24.8## | 19103.0 ± 1621.5## | 122.3 ± 16.2## | 23.7 ± 3.8 | 23026.3 ± 5815.4 | 648.3 ± 95.0 | 0.03 ± 0.005 |
| Catalase | 204.7 ± 17.5## | 17761.3 ± 677.3## | 101.7 ± 7.3## | 23.0 ± 1.0## | 40270.3 ± 7388.2 | 812.5 ± 94.7 | 0.02 ± 0.001## |
| MnTBAP | 161.0 ± 11.9**## | 10146.0 ± 932.8**## | 45.7 ± 9.2**## | 1.3 ± 0.3**## | 3479.3 ± 1219.9 | 256.7 ± 39.4* | 0.08 ± 0.01** |
| EUK-134 | 206.3 ± 17.1## | 17123.3 ± 351.0## | 94.0 ± 8.1 | 19.7 ± 2.7 | 40263.3 ± 7040.8 | 837.8 ± 74.1 | 0.02 ± 0.002 |
| Intermittent Hypoxia (IH) | |||||||
| Saline | 98.3 ± 12.2 | 12848.0 ± 271.6 | 51.3 ± 7.3 | 14.7 ± 3.2 | 36349.5 ± 6513.0 | 794.9 ± 125.4 | 0.02 ± 0.0007 |
| Catalase | 212.6 ± 0.7**## | 18283.8 ± 179.3*## | 103.7 ± 1.3**## | 24.0 ± 1.2## | 34826.4 ± 765.6 | 757.2 ± 49.1 | 0.02 ± 0.001## |
| MnTBAP | 202.0 ± 3.8**## | 18377.3 ± 348.1**## | 102.3 ± 1.8**## | 22.7 ± 2.3## | 42289.9 ± 7826.0 | 886.2 ± 125.2 | 0.02 ± 0.009 |
| EUK-134 | 215.0 ± 15.2**## | 16755.6 ± 593.5## | 99.0 ± 6.1** | 19.0 ± 0.6## | 15957.7 ± 2852.9 | 512.2 ± 50.2 | 0.03 ± 0.003 |
Note: Data are mean ± SEM (n = 3 wells per group).
p < 0.05,
p < 0.01 vs Saline;
p < 0.01 vs Nx.
TABLE 4.
Morphometric analysis of cells at 72 h post treatment
| Groups | Mean No. Tubes |
Mean Tube Length (µm) |
Mean Total Branching Points |
Mean No. Loops |
Mean Loop Area (µm2) |
Mean Loop Perimeter |
Mean Loop Perimeter/ Area |
|---|---|---|---|---|---|---|---|
| Normoxia (Nx) | |||||||
| Saline | 90.3 ± 10.5 | 7964.0 ± 917.4 | 28.7 ± 9.5 | 5.7 ± 2.4 | 5975.6 ± 2693.5 | 294.4 ± 94.2 | 0.09 ± 0.04 |
| Catalase | 178.3 ± 29.8* | 17921.8 ± 922.3** | 87.7 ± 14.8** | 19.0 ± 2.3** | 34384.9 ± 5083.0** | 778.8 ± 67.1** | 0.02 ± 0.001 |
| MnTBAP | 102.0 ± 7.2 | 4569.8 ± 335.5* | 8.7 ± 2.6 | 0 ±0 | 0 ± 0* | 0 ± 0* | 0 ±0* |
| EUK-134 | 252.7 ± 24.5** | 18539.0 ± 406.7** | 114.0 ± 9.0** | 20.0 ± 1.7** | 28045.2 ± 5107.5** | 721.6 ± 49.6** | 0.03 ± 0.004 |
| Hyperoxia (50% O2) | |||||||
| Saline | 134.0 ± 43.6 | 15883.3 ± 1608.5## | 68.3 ± 21.1## | 17.3 ± 3.2 | 42717.0 ± 3646.1## | 912.3 ± 15.3## | 0.02 ± 0.001 |
| Catalase | 191.3 ± 2.7 | 17930.0 ± 236.3 | 92.0 ± 2.1 | 17.7 ± 0.7 | 47793.9 ± 3849.0 | 1013.1 ± 47.4 | 0.02 ± 0.008 |
| MnTBAP | 142.3 ± 8.7 | 8125.3 ± 666.3** | 26.7 ± 3.4** | 1.0 | 1554.3 | 174.9 | 0.11 |
| EUK-134 | 199.7 ± 6.4 | 18293.7 ± 373.8 | 97.7 ± 4.3 | 19.3 ± 2.3 | 43049.2 ± 12055.4 | 921.4 ± 178.5 | 0.02 ± 0.002# |
| Intermittent Hypoxia (IH) | |||||||
| Saline | 88.3 ± 11.0 | 12041.7 ± 1061.0 | 45.7 ± 7.9 | 12.3 ± 3.7 | 31707.1 ± 6094.4# | 616.4 ± 99.7 | 0.02 ± 0.001 |
| Catalase | 250.3 ± 8.8** | 19318.2 ± 278.2 | 110.7 ± 4.3 | 18.0 ± 0.6 | 30037.0 ± 7773.5 | 757.5 ± 112.7 | 0.03 ± 0.003 |
| MnTBAP | 237.0 ± 6.8**## | 19384.6 ± 855.4## | 106.0 ± 6.8## | 19.7 ± 3.3 | 29766.0 ± 3715.8 | 703.3 ± 68.8 | 0.02 ± 0.002 |
| EUK-134 | 202.7 ± 9.4** | 18092.8 ± 733.3 | 101.0 ± 6.4 | 24.7 ± 2.4 | 44232 ± 9945.7 | 900.2 ± 175.5 | 0.02 ± 0.0007## |
Note: Data are mean ± SEM (n = 3 wells per group).
p < 0.05,
p < 0.01 vs Saline;
p < 0.05,
p < 0.01 vs Nx.
FIGURE 9. Effect of MnTBAP, catalase or EUK-134 on tube formation capacity of human retinal endothelial cells exposed to Nx (panels A–D), Hx (50% O2, panels E–H), or IH (panels I–L).
Images were captured at 4× magnification.
4. DISCUSSION
The role of IH in the development of OIR is well established [3, 5, 10, 22, 23, 29, 32]. However, the specific retinal endothelial cell responses to oxidative stress in OIR are poorly understood. The present study is the first to describe the effects of IH on isolated human retinal endothelial cells and the efficacy of pharmacological antioxidants for preventing oxidative stress in this setting. Vessels of the immature retina of extremely low gestational age neonates (ELGANs) at risk for severe ROP are fragile, leaky, and susceptible to hemorrhage. In normal and aberrant angiogenesis, retinal endothelial cells migrate, proliferate, and form new vessels in response to various cues. To understand the mechanisms associated with IH-induced oxidative damage in the retina, we exposed HRECs to various oxygen conditions and treated them with antioxidants, the first line of defense against oxidative stress, in order to test the hypothesis that co-treatment with SOD and catalase will prevent H2O2 accumulation and have a more beneficial effect than SOD or catalase individually. We have identified the following: (1) effect of pharmacological antioxidants on media levels of 8-isoPGF2α was delayed. A reduction in oxidative stress may take up to 72 h; (2) MnTBAP (SOD mimetic) and catalase were more effective for H2O2 scavenging in the media when administered individually; (3) EUK-134 (combination of SOD and catalase) was not effective for H2O2scavenging; (4) catalase and EUK-134 rapidly elevated media SOD activity whereas a delayed response was noted for MnTBAP. This suggests that exogenous SOD reduces extracellular SOD activity; (5) MnTBAP had a latent suppressive effect on media catalase levels, up to 72 h; (6) MnTBAP, but not catalase or EUK-134 progressively increased media GPx levels in all oxygen conditions, peaking at 72 h; and (7) treatment with all antioxidants resulted in normal, but abundant tubulogenesis, while saline-treated cells exposed to IH caused tumorigenic tubes. Together, these findings demonstrate that all antioxidants, individually and co-administered, were effective for reducing oxidative stress in HRECS. However, co-administration of SOD and catalase in the form of EUK-134 is not as effective as individual administration. Instead, co-administration of exogenous SOD and catalase may result in extracellular accumulation of H2O2 and subsequent production of hydroxyl radical via interaction with iron. Given the effects of MnTBAP on H2O2 and GPx production, at the right doses, it may be the best choice for protecting the eyes against free radical damage.
The delayed suppressive effect on 8-isoPGF2α reflects the mechanism of action of these pharmacological antioxidants. We speculate that MnTBAP, catalase, and EUK-134 work intracellularly through penetration of the endothelial cell membrane in order to scavenge free radicals in the cytosol. Therefore, the limited cell permeability of these antioxidants may have delayed the enzymatic role, leading to early cumulative 8-isoPGF2α. Once the antioxidant enters the endothelial cell, the catalytic property unique to the antioxidant further determines the rate of successive chemical kinetics, such as the dismutation of O2·− and its product, H2O2. MnTBAP and catalase were more effective for H2O2 scavenging in the media in all oxygen conditions when administered individually. From this finding, we extrapolate that MnTBAP and catalase entered the endothelial cells better than EUK-134 allowing earlier intracellular catalysis of H2O2, thereby, preventing H2O2from exuding into the media. Our data suggests that MnTBAP may possess catalase activity since H2O2 did not accumulate in the media. Other studies also reported that MnTBAP has redox properties that scavenge a wider range of free radicals than only O2·−, and that MnTBAP possesses both SOD activity and some catalase activity [33, 34].
EUK-134 was not as effective for H2O2 scavenging as MnTBAP and catalase individually. The down-regulated catalase expression by >5-fold in EUK-134 treatment in all oxygen conditions sheds some light to the H2O2 accumulation. This discovery is surprising because EUK-134 has been documented to broadly scavenge peroxynitrite, O2·−, and H2O2. Moreover, EUK-134 is a synthetic salen-manganese complex that has been modified to increase its catalase activity while retaining SOD activity compared with the previous prototype, EUK-8. Moreover, EUK-134 has one of the better catalytic rate profiles of salen-manganese complexes [35]. Alternatively, EUK-134 is approximately 43% less lipophilic than EUK-138 with almost identical SOD and catalase catalytic properties [36], which may compromise EUK-134’s cell membrane permeability and potency to scavenge intracellular free radicals, and therefore, explain our result. Our result may also indicate that a concentration higher than 5 µg/ml may be necessary to suppress the production of H2O2. Another explanation is that EUK-134 may need to enter the mitochondrial matrix to relieve the pathological H2O2 load. There is a second generation EUK drug, EUK-207, which is a mitochondrial targeted SOD mimetic with equivalent catalytic properties to EUK-134. Although EUK-207 may be more efficient at scavenging the free radicals originating from the mitochondrial matrix [37, 38], if the cell membrane permeability of EUK-207 is similar to that of EUK-134, then we anticipate a similar delay in scavenging H2O2.
MnTBAP-treated cells exhibited delayed extracelular media SOD activity reflecting the effective intracellular dismutation of O2·− by both endogenous SOD and exogenous MnTBAP. Commercial preparations of metalloporphrins, such as MnTBAP, are low molecular weight biomolecules that readily penetrate the cellular and subcellular membranes [33]. Both the manganese (Mn) metal and porphyrin complex of MnTBAP can catalyze O2·− dismutation per se, therefore, deferring extracellular SOD activity in the media. MnTBAP had a latent suppressive effect on media catalase level in response to intracellular H2O2 production by both endogenous SOD and exogenous MnTBAP. On the other hand, catalase-treated cells had delayed catalase activity, which implies that catalase sufficiently scavenged intracellular H2O2 preventing H2O2from exuding into the media until 72 h. We speculate that bovine liver catalase drug works in the cytosol or in other subcellular compartments, such as peroxisomes, since catalase is naturally nonexistent in most mitochondria of mammalian cells and catalase mitochondrial expression is only attainable by recombinant plasmid technology [39]. Similar to the latent suppressive effect of catalase media activity, our data also indicates that MnTBAP-treated cells had progressively increased media GPx levels in all oxygen conditions, starting at 24 h. The nascent tubes and reduced cell numbers that survived to 72 h in MnTBAP treatment in Nx and Hx undermine the antioxidant gene expression data for MnTBAP. Our result implies that intracellular H2O2 produced from O2·− catalysis by SOD has leaked extracellularly into the media where catalase and GPx are detected to reduce H2O2 to water. However, instead of an up-regulation of catalase and GPx genes, we measured a >5-fold down-regulation in GPx-2, -3, -4, and -5 expression for MnTBAP treatment of HRECs in Nx and Hx. This was in contrast to the higher levels of antioxidants measured in the media. Measurement of antioxidants in the media was essential to determine how the cells respond to changes in O2 and to supplementation. H2O2 readily crosses cell membranes. Therefore, catalase added outside the cell can exert both intracellular and extracellular effects on H2O2. Scavenging of extracellular H2O2 will result in depletion of intracellular H2O2 [40]. It was important to determine differences in antioxidant activity with and without treatment to establish the uptake capacity of the cells and secretion into the surrounding media under these noxious conditions. SODs are the primary ROS detoxifying enzymes of the cell and the first response to O2·−. Normally, SOD expression is induced or repressed to match ROS production such that more ROS will lead to more SOD expression. In the present study, lower SOD expression in the cells may suggest reduced ROS production in response to exogenous antioxidants and ROS neutralization. When intracellular H2O2 is depleted, catalase and glutathione are also suppressed.
Finally, the antioxidants resulted in normal, but abundant tubulogenesis compared to saline treatment in IH and Nx. This is unexpected because intermittent hypoxia has been shown to promote endothelial cell resistance to pro-apoptotic stresses [41, 42]. However, our finding may be spurious because we expose our HRECs to more episodes of IH per day than other studies with possible pronounced deleterious effects on cellular differentiation and tubulogenesis as observed in saline IH cells. Catalase- and EUK-134-treated cells in IH formed similar quantities of tube networks as their normoxia counterparts at 48 and 72 h, and this finding further supports our rationale. Moreover, saline treatment in IH exhibited pathological, tumorigenic-appearing cells compared to antioxidants. Additionally, saline Nx cells experienced a decimated tubular network by 72 h. The saline normoxia cells may be exhibiting physiological cell cycle behavior and begin to die at 72 h.
In conclusion, the advantage of using a cellular model for comparison of therapeutic potential is that it is a simple biological system that is less likely to be influenced by drug metabolism and bioavailability. However, the benefits from the catalytic antioxidants observed in our in vitro model may not parallel in vivo efficacy. While all antioxidant preparations used in this study were effective for the protection of HRECs from oxidative stress due to Hx and IH, MnTBAP and catalase administered individually was superior to their co-administration in the form of EUK-134. Further in vivo studies examining the pharmacokinetic and pharmacodynamic profiles, drug safety, and dose guidelines are needed prior to clinical application of these pharmacological antioxidant compounds.
Acknowledgments
This work was supported by the National Institutes of Health–Eunice Kennedy Shriver National Institute of Child Health and Human Development, Bethesda MD, USA (Grant #1U54HD071594).
ABBREVIATIONS
- 8-isoPGF2α
8-isoprostane
- 8-OHdG
8-hydroxy-2′-deoxyguanosine
- ETC
electron transport chain
- GPx
glutathione peroxidase
- HREC
human retinal microvascular endothelial cell
- Hx
hyperoxia
- IH
intermittent hypoxia
- MnTBAP
Mn(III) tetrakis(4-benzoic acid)porphyrin
- Nx
normoxia
- OIR
oxygen-induced retinopathy
- RNS
reactive nitrogen species
- ROP
retinopathy of prematurity
- ROS
reactive oxygen species
- SOD
superoxide dismutase
References
- 1.Stoll BJ, Hansen NI, Bell EF, Shankaran S, Laptook AR, Walsh MC, et al. Neonatal outcomes of extremely preterm infants from the NICHD Neonatal Research Network. Pediatrics. 2010;126(3):443–56. doi: 10.1542/peds.2009-2959. [DOI] [PMC free article] [PubMed] [Google Scholar]
- 2.Ashton N, Ward B, Serpell G. Role of oxygen in the genesis of retrolental fibroplasia; a preliminary report. Br J Ophthalmol. 1953;37(9):513–20. doi: 10.1136/bjo.37.9.513. [DOI] [PMC free article] [PubMed] [Google Scholar]
- 3.Di Fiore JM, Kaffashi F, Loparo K, Sattar A, Schluchter M, Foglyano R, et al. The relationship between patterns of intermittent hypoxia and retinopathy of prematurity in preterm infants. Pediatr Res. 2012;72(6):606–12. doi: 10.1038/pr.2012.132. [DOI] [PMC free article] [PubMed] [Google Scholar]
- 4.Di Fiore JM, Bloom JN, Orge F, Schutt A, Schluchter M, Cheruvu VK, et al. A higher incidence of intermittent hypoxemic episodes is associated with severe retinopathy of prematurity. J Pediatr. 2010;157(1):69–73. doi: 10.1016/j.jpeds.2010.01.046. [DOI] [PMC free article] [PubMed] [Google Scholar]
- 5.Martin RJ, Wang K, Koroglu O, Di Fiore J, Kc P. Intermittent hypoxic episodes in preterm infants: do they matter? Neonatology. 2011;100(3):303–10. doi: 10.1159/000329922. [DOI] [PMC free article] [PubMed] [Google Scholar]
- 6.Hartnett ME. The effects of oxygen stresses on the development of features of severe retinopathy of prematurity: knowledge from the 50/10 OIR model. Doc Ophthalmol. 2010;120(1):25–39. doi: 10.1007/s10633-009-9181-x. [DOI] [PMC free article] [PubMed] [Google Scholar]
- 7.Scherz-Shouval R, Elazar Z. ROS, mitochondria and the regulation of autophagy. Trends Cell Biol. 2007;17(9):422–7. doi: 10.1016/j.tcb.2007.07.009. [DOI] [PubMed] [Google Scholar]
- 8.Hardy P, Dumont I, Bhattacharya M, Hou X, Lachapelle P, Varma DR, et al. Oxidants, nitric oxide and prostanoids in the developing ocular vasculature: a basis for ischemic retinopathy. Cardiovasc Res. 2000;47(3):489–509. doi: 10.1016/s0008-6363(00)00084-5. [DOI] [PubMed] [Google Scholar]
- 9.Katz ML, Robison WG., Jr Autoxidative damage to the retina: potential role in retinopathy of prematurity. Birth Defects Orig Artic Ser. 1988;24(1):237–48. [PubMed] [Google Scholar]
- 10.Penn JS. Oxygen-induced retinopathy in the rat: possible contribution of peroxidation reactions. Doc Ophthalmol. 1990;74(3):179–86. doi: 10.1007/BF02482607. [DOI] [PubMed] [Google Scholar]
- 11.Andreyev AY, Kushnareva YE, Starkov AA. Mitochondrial metabolism of reactive oxygen species. Biochemistry (Mosc) 2005;70(2):200–14. doi: 10.1007/s10541-005-0102-7. [DOI] [PubMed] [Google Scholar]
- 12.Zelko IN, Mariani TJ, Folz RJ. Superoxide dismutase multigene family: a comparison of the CuZn-SOD (SOD1), Mn-SOD (SOD2), and EC-SOD (SOD3) gene structures, evolution, and expression. Free RadicBiol Med. 2002;33(3):337–49. doi: 10.1016/s0891-5849(02)00905-x. [DOI] [PubMed] [Google Scholar]
- 13.Haber F. Uber die katalyse des hydroperoxydes. Naturwissenschaften. 1932;20:948–50. [Google Scholar]
- 14.Fenton H. Oxidation of tartaric acid in presence of iron. ChemSoc Trans. 1894;65:899–910. [Google Scholar]
- 15.Hittner HM, Godio LB, Rudolph AJ, Adams JM, Garcia-Prats JA, Friedman Z, et al. Retrolental fibroplasia: efficacy of vitamin E in a double-blind clinical study of preterm infants. N Engl J Med. 1981;305(23):1365–71. doi: 10.1056/NEJM198112033052301. [DOI] [PubMed] [Google Scholar]
- 16.Brion LP, Bell EF, Raghuveer TS. Vitamin E supplementation for prevention of morbidity and mortality in preterm infants. Cochrane Database Syst Rev. 2003;(4):CD003665. doi: 10.1002/14651858.CD003665. [DOI] [PubMed] [Google Scholar]
- 17.Darlow BA, Graham PJ. Vitamin A supplementation for preventing morbidity and mortality in very low birthweight infants. Cochrane Database Syst Rev. 2002;(4):CD000501. doi: 10.1002/14651858.CD000501. [DOI] [PubMed] [Google Scholar]
- 18.Vekerdy-Lakatos S, Lakatos L, Oroszlan G, Itzes B. One year longitudinal follow-up of premature infants treated with D-penicillamine in the neonatal period. ActaPaediatr Hung. 1987;28(1):9–16. [PubMed] [Google Scholar]
- 19.Qureshi MJ, Kumar M. D-Penicillamine for preventing retinopathy of prematurity in preterm infants. Cochrane Database Syst Rev. 2013;(9):CD001073. doi: 10.1002/14651858.CD001073.pub2. [DOI] [PMC free article] [PubMed] [Google Scholar]
- 20.Russell GA, Cooke RW. Randomised controlled trial of allopurinol prophylaxis in very preterm infants. Arch Dis Child Fetal Neonatal Ed. 1995;73(1):F27–31. doi: 10.1136/fn.73.1.f27. [DOI] [PMC free article] [PubMed] [Google Scholar]
- 21.Romagnoli C, Giannantonio C, Cota F, Papacci P, Vento G, Valente E, et al. A prospective, randomized, double blind study comparing lutein to placebo for reducing occurrence and severity of retinopathy of prematurity. J Matern Fetal Neonatal Med. 2011;24(Suppl 1):147–50. doi: 10.3109/14767058.2011.607618. [DOI] [PubMed] [Google Scholar]
- 22.Jivabhai Patel S, Bany-Mohammed F, McNally L, Valencia GB, Lazzaro DR, Aranda JV, et al. Exogenous superoxide dismutase mimetic without scavenging H2O2 causes photoreceptor damage in a rat model for oxygen-induced retinopathy. Invest Ophthalmol Vis Sci. 2015;56(3):1665–77. doi: 10.1167/iovs.14-15321. [DOI] [PMC free article] [PubMed] [Google Scholar]
- 23.Beharry KD, Cai CL, Sharma P, Bronshtein V, Valencia GB, Lazzaro DR, et al. Hydrogen peroxide accumulation in the choroid during intermittent hypoxia increases risk of severe oxygen-induced retinopathy in neonatal rats. Invest Ophthalmol Vis Sci. 2013;54(12):7644–57. doi: 10.1167/iovs.13-13040. [DOI] [PMC free article] [PubMed] [Google Scholar]
- 24.Werdich XQ, McCollum GW, Rajaratnam VS, Penn JS. Variable oxygen and retinal VEGF levels: correlation with incidence and severity of pathology in a rat model of oxygen-induced retinopathy. Exp Eye Res. 2004;79(5):623–30. doi: 10.1016/j.exer.2004.07.006. [DOI] [PubMed] [Google Scholar]
- 25.Penn JS, Henry MM, Tolman BL. Exposure to alternating hypoxia and hyperoxia causes severe proliferative retinopathy in the newborn rat. Pediatr Res. 1994;36(6):724–31. doi: 10.1203/00006450-199412000-00007. [DOI] [PubMed] [Google Scholar]
- 26.Penn JS, Tolman BL, Henry MM. Oxygen-induced retinopathy in the rat: relationship of retinal nonperfusion to subsequent neovascularization. Invest Ophthalmol Vis Sci. 1994;35(9):3429–35. [PubMed] [Google Scholar]
- 27.Penn JS, McCollum GW, Barnett JM, Werdich XQ, Koepke KA, Rajaratnam VS. Angiostatic effect of penetrating ocular injury: role of pigment epithelium-derived factor. Invest Ophthalmol Vis Sci. 2006;47(1):405–14. doi: 10.1167/iovs.05-0673. [DOI] [PubMed] [Google Scholar]
- 28.McColm JR, Geisen P, Hartnett ME. VEGF isoforms and their expression after a single episode of hypoxia or repeated fluctuations between hyperoxia and hypoxia: relevance to clinical ROP. Mol Vis. 2004;10:512–20. [PMC free article] [PubMed] [Google Scholar]
- 29.Coleman RJ, Beharry KD, Brock RS, Abad-Santos P, Abad-Santos M, Modanlou HD. Effects of brief, clustered versus dispersed hypoxic episodes on systemic and ocular growth factors in a rat model of oxygen-induced retinopathy. Pediatr Res. 2008;64(1):50–5. doi: 10.1203/PDR.0b013e31817307ac. [DOI] [PubMed] [Google Scholar]
- 30.Chang M, Bany-Mohammed F, Kenney MC, Beharry KD. Effects of a superoxide dismutase mimetic on biomarkers of lung angiogenesis and alveolarization during hyperoxia with intermittent hypoxia. Am J Transl Res. 2013;5(6):594–607. [PMC free article] [PubMed] [Google Scholar]
- 31.Morrow JD, Hill KE, Burk RF, Nammour TM, Badr KF, Roberts LJ., 2nd A series of prostaglandin F2-like compounds are produced in vivo in humans by a non-cyclooxygenase, free radical-catalyzed mechanism. Proc Natl AcadSci USA. 1990;87(23):9383–7. doi: 10.1073/pnas.87.23.9383. [DOI] [PMC free article] [PubMed] [Google Scholar]
- 32.York JR, Landers S, Kirby RS, Arbogast PG, Penn JS. Arterial oxygen fluctuation and retinopathy of prematurity in very-low-birth-weight infants. J Perinatol. 2004;24(2):82–7. doi: 10.1038/sj.jp.7211040. [DOI] [PubMed] [Google Scholar]
- 33.Batinic-Haberle I, Reboucas JS, Spasojevic I. Superoxide dismutase mimics: chemistry, pharmacology, and therapeutic potential. Antioxid Redox Signal. 2010;13(6):877–918. doi: 10.1089/ars.2009.2876. [DOI] [PMC free article] [PubMed] [Google Scholar]
- 34.Liu D, Shan Y, Valluru L, Bao F. Mn(III) tetrakis (4-benzoic acid) porphyrin scavenges reactive species, reduces oxidative stress, and improves functional recovery after experimental spinal cord injury in rats: comparison with methylprednisolone. BMC Neurosci. 2013;14:23. doi: 10.1186/1471-2202-14-23. [DOI] [PMC free article] [PubMed] [Google Scholar]
- 35.Doctrow SR, Huffman K, Marcus CB, Tocco G, Malfroy E, Adinolfi CA, et al. Salen-manganese complexes as catalytic scavengers of hydrogen peroxide and cytoprotective agents: structure-activity relationship studies. J Med Chem. 2002;45(20):4549–58. doi: 10.1021/jm020207y. [DOI] [PubMed] [Google Scholar]
- 36.Pong K, Doctrow SR, Huffman K, Adinolfi CA, Baudry M. Attenuation of staurosporine-induced apoptosis, oxidative stress, and mitochondrial dysfunction by synthetic superoxide dismutase and catalase mimetics, in cultured cortical neurons. ExpNeurol. 2001;171(1):84–97. doi: 10.1006/exnr.2001.7747. [DOI] [PubMed] [Google Scholar]
- 37.Ajith TA, Padmajanair G. mitochondrial pharmaceutics: a new therapeutic strategy to ameliorate oxidative stress in Alzheimer’s Disease. Curr Aging Sci. 2015;8(3):235–40. doi: 10.2174/187460980803151027115147. [DOI] [PubMed] [Google Scholar]
- 38.Doctrow S, Salen Mn. complexes are superoxide dismutase/catalase mimetics that protect the mitochondria. Current Inorganic Chemistry. 2012;2:325–34. [Google Scholar]
- 39.Bai J, Rodriguez AM, Melendez JA, Cederbaum AI. Overexpression of catalase in cytosolic or mitochondrial compartment protects HepG2 cells against oxidative injury. J BiolChem. 1999;274(37):26217–24. doi: 10.1074/jbc.274.37.26217. [DOI] [PubMed] [Google Scholar]
- 40.Halliwell B. Oxidative stress in cell culture: an under-appreciated problem? FEBS Lett. 2003;540(1–3):3–6. doi: 10.1016/S0014-5793(03)00235-7. [DOI] [PubMed] [Google Scholar]
- 41.Martinive P, Defresne F, Bouzin C, Saliez J, Lair F, Gregoire V, et al. Preconditioning of the tumor vasculature and tumor cells by intermittent hypoxia: implications for anticancer therapies. Cancer Res. 2006;66(24):11736–44. doi: 10.1158/0008-5472.CAN-06-2056. [DOI] [PubMed] [Google Scholar]
- 42.Toffoli S, Roegiers A, Feron O, Van Steenbrugge M, Ninane N, Raes M, et al. Intermittent hypoxia is an angiogenic inducer for endothelial cells: role of HIF-1. Angiogenesis. 2009;12(1):47–67. doi: 10.1007/s10456-009-9131-y. [DOI] [PubMed] [Google Scholar]


