Abstract
Background FSGS is a pattern of podocyte injury that leads to loss of glomerular function. Podocytes support other podocytes and glomerular capillary structure, oppose hemodynamic forces, form the slit diaphragm, and have mechanical properties that permit these functions. However, the biophysical characteristics of glomeruli and podocytes in disease remain unclear.
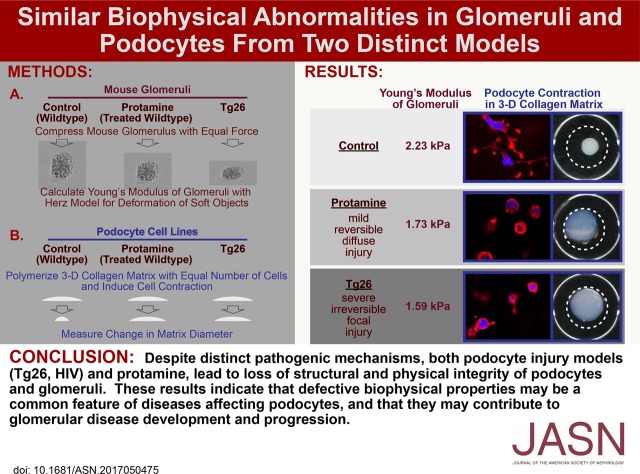
Methods Using microindentation, atomic force microscopy, immunofluorescence microscopy, quantitative RT-PCR, and a three-dimensional collagen gel contraction assay, we studied the biophysical and structural properties of glomeruli and podocytes in chronic (Tg26 mice [HIV protein expression]) and acute (protamine administration [cytoskeletal rearrangement]) models of podocyte injury.
Results Compared with wild-type glomeruli, Tg26 glomeruli became progressively more deformable with disease progression, despite increased collagen content. Tg26 podocytes had disordered cytoskeletons, markedly abnormal focal adhesions, and weaker adhesion; they failed to respond to mechanical signals and exerted minimal traction force in three-dimensional collagen gels. Protamine treatment had similar but milder effects on glomeruli and podocytes.
Conclusions Reduced structural integrity of Tg26 podocytes causes increased deformability of glomerular capillaries and limits the ability of capillaries to counter hemodynamic force, possibly leading to further podocyte injury. Loss of normal podocyte mechanical integrity could injure neighboring podocytes due to the absence of normal biophysical signals required for podocyte maintenance. The severe defects in podocyte mechanical behavior in the Tg26 model may explain why Tg26 glomeruli soften progressively, despite increased collagen deposition, and may be the basis for the rapid course of glomerular diseases associated with severe podocyte injury. In milder injury (protamine), similar processes occur but over a longer time.
Keywords: podocyte, biophysics, renal fibrosis, glomerulus
FSGS is a pattern of podocyte injury caused by a range of insults.1 Disease progression is marked by accumulation of fibrous tissue that replaces normal cell structures, leading to stiffening of the glomeruli and loss of function. Genetic, fibrotic, and inflammatory processes contribute to progressive glomerular disease. In some diseases and podocyte reduction models, disease progresses, because initially normal podocytes become injured secondary to loss of neighboring primarily injured podocytes.2 Common features of progressive glomerular diseases include cytoskeletal abnormalities of podocytes, podocyte detachment and loss, progressive proteinuria, and increased collagen production in glomeruli.
The biophysical characteristics of podocytes and capillary walls, including elasticity and cell responses to different forms of physical force, remain relatively undefined but relate directly to podocyte structure, adhesion, and susceptibility to shear stress, important factors in progressive glomerular disease.3 Understanding the biophysical characteristics of normal and diseased glomerular capillaries is necessary, because glomerular capillaries are subject to physical forces, and their responses to pathologic conditions depend, in part, on their mechanical integrity. The cytoskeletal structure of podocytes supports glomerular capillary structure in response to normal and pathologic hemodynamic forces, although the relative contributions of podocytes and the glomerular basement membrane (GBM) are not fully resolved.4 Additionally, mechanical environment can affect the differentiated state of numerous cell types, including podocytes,5–7 which are determinants of the mechanical properties of glomerular capillaries and glomeruli.8,9
To understand the biophysical characteristics of glomeruli and podocytes in disease, we studied the mechanical properties of glomeruli and podocytes in two mechanistically distinct, established models of extreme and mild glomerular disease: Tg26 mice (podocytes expressing HIV, severe) and protamine sulfate–induced minimal change disease (acute, reversible, mild).10–13 In Tg26 transgenic mice, podocyte expression of the HIV genome leads to disordered cytoskeletal structure and disruption of capillaries.10,14–17 This model recapitulates some features of the human renal disease,11 including rapid progression and markedly disordered podocytes.18–20 Protamine administration causes reversible podocyte foot process effacement and proteinuria, and with repeated administration, it can lead to permanent progressive glomerular injury.13,21–23 We also studied the characteristics of podocytes in these two models and assessed the features of podocytes that are relevant to glomerular capillary mechanical and elastic properties, including podocyte cell elastic properties, cytoskeletal structure, cell adhesion, responses to changing elastic environment, and contractility. In both models, glomeruli and podocytes are more deformable than normal, and the podocytes lose functions, particularly adhesion and generation of contractile force, that would reduce their ability to provide mechanical support for normal neighboring podocytes and glomerular capillaries.
Methods
Tg26 Mouse and Protamine Models
The transgenic mouse models of HIVAN FVB/N-Tg(HIV)26Aln/PkltJ (strain 022354; Jackson Laboratory), commonly referred to as “Tg26,” are on the FVB/N background and express a replication-defective HIV proviral genome (Δgag, pol) under the native HIV-1 promoter. Podocyte cell lines derived from normal and Tg26 transgenic mice bred with H-2Kb-tsA58 Immortomice were described previously.24 The wild-type (WT) podocytes were studied after differentiation (10–12 days at 38°C, when their morphology was characteristic of differentiated cells with growth arrest and increased synaptopodin expression).14 Tg26 cells were studied after 10–12 days at 38°C, but one of their characteristics is failure to differentiate. Primary podocytes were grown out from isolated glomeruli on type 1 collagen in RPMI 1640 with 10% FCS for 3–5 days, the cellular material was resuspended, and cells were isolated by passage through a 33-μm pore sieve to remove glomerular remnants. The cells were assessed for synaptopodin expression and used for studies.25 Mesangial cells from normal and Tg26 mice were immortalized after isolation from glomeruli with lentiviral expression of a ts-SV40 large T antigen (pLenti-SV40-T-tsA58). For the protamine model, isolated glomeruli or normal podocytes were treated with protamine in tissue culture medium (RPMI 1640) at the concentrations indicated for 1–2 hours before studies were performed.13,23
Microindentation
For measurement of the Young modulus (E) of isolated glomeruli, a glomerulus is placed under the probe of a microtensiometer (Kibron Inc., Helsinki, Finland). The probe is lowered onto the glomerulus using a micromanipulator (Eppendorf, Germany). At intervals of 2 μm, voltage is recorded from the readout of the microtensiometer. Force is calculated from voltage, and force and displacement are used to calculate an elastic modulus.26
Quantitative RT-PCR
RNA from differentiated podocytes, mesangial cells, and isolated glomeruli was extracted with Qiagen RNEasy and reverse transcribed with the ABI First-Strand synthesis kit (Invitrogen). SYBR Green master mix (Thermofisher) with the StepOne Real Time PCR System (Applied Biosystems) per the manufacturer’s instructions was used for quantitative RT-PCR. Gene expression was probed with the oligos listed in Supplemental Material and normalized with glyceraldehyde-3-phosphate dehydrogenase control.5,27
Measurement of Cell Adhesion
Adhesion was measured by washing equally seeded cells after plating on collagen- or poly-l-lysine–coated 96-well plates for 30 minutes and related to paxillin phosphorylation. Adherent cells were fixed in formalin and stained with 0.01% crystal violet. Stain was solubilized with methanol/acetic acid, and absorbance at 590 nm was measured with a microplate reader.27
Fabrication of Variable Stiffness Gels
Variable stiffness polyacrylamide gels were prepared as previously described27 with specific elasticities from varying the concentration of Bis-acrylamide. Gels were coated with 50 mM sulfosuccinimidyl 6-(4′-azido-2′-nitrophenyl-amino)hexanoate (Pierce) according to the package instructions and then with 0.2 mg/ml type 1 collagen (Sigma-Aldrich) solution.
Atomic Force Microscopy
Atomic force microscopy was performed with a DAFM-2X Bioscope (Veeco, Woodbury, NY) mounted on an Axiovert 100 microscope (Zeiss, Thornwood, NY) using silicon nitride cantilevers (196×23×0.6 mm) with a bead tip (1-μm diameter) for indentation. The spring constant of the cantilever, calibrated by resonance measurements, was typically 0.06 N/m (Novascan, Ames, IA). A grid with 300-μm divisions was placed lengthwise beneath the gel, and approximately three to four cells per gel stiffness measurements were made within each division. Correlation between cell and gel stiffness was determined by indenting the cells at eight to ten distinct points and the gel at eight to ten points proximal to the attached cell.27
Three-Dimensional Collagen Matrix Contraction Assay
Collagen matrices (2×10⁵ cells per 200 μl gel) were polymerized for 1 hour at 37°C; then, the released floating matrices were incubated for 4 hours in RPMI 1640 medium with or without 10% FBS. Contracted matrices were fixed with 3.7% paraformaldehyde/PBS and imaged with an Epson photo scanner. Gel area was analyzed using ImageJ.28
Results
Renal Disease Progression in Tg26 Mice
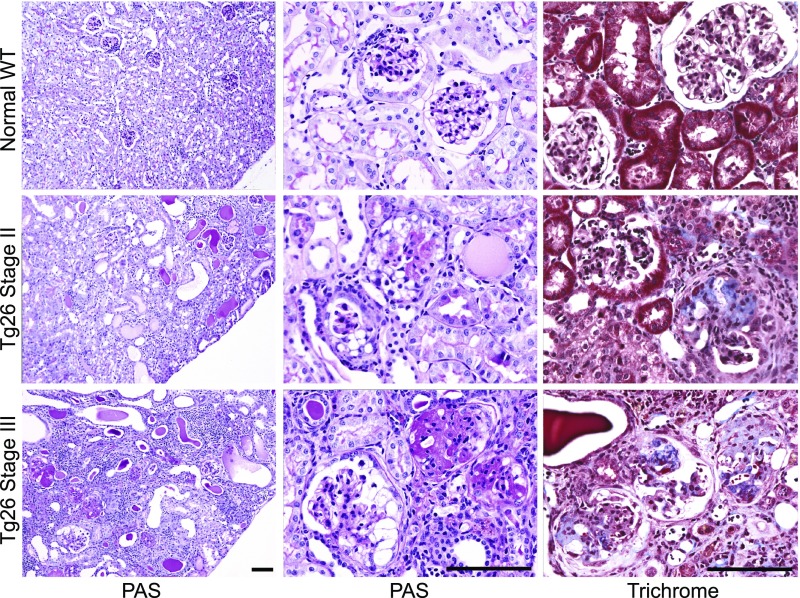
The progressive kidney disease in Tg26 mice was described in detail.10,11 We defined three stages of disease on the basis of the gross appearance of kidneys, proteinuria, and the condition of mice, with stage 1 mice indistinguishable from WT mice and with stage 3 mice having late-stage renal disease (Supplemental Figure 1). The pathologic characteristics of the Tg26 model at stages 2 and 3 were compared with age-matched WT mice (Figure 1). Periodic acid–Schiff staining of kidneys from each stage shows progressive interstitial microcystic disease and loss of viable tubules. Stage 2 glomeruli show focal and segmental collapsing lesions, and in stage 3 mice, many sclerotic glomeruli are also present. Trichrome staining shows a progressive increase of collagen in glomeruli from stage 2 to stage 3.
Figure 1.
Stages of progressive kidney disease pathology in Tg26 mice. Photomicrographs of representative kidney sections from normal mice (top row) and mice with stage 2 (middle row) and stage 3 (bottom row) disease with periodic acid–Schiff (PAS; left and middle columns) and trichrome stains (right column). Kidney cortex of normal mice is well preserved; glomeruli show open capillary loops, and no significant mesangial expansion, epithelial or inflammatory cell proliferation (PAS), or significant collagen is seen in the glomeruli (trichrome). Kidney cortex of stage 2 mice shows focal tubulointerstitial changes, including signs of focal tubular injury, luminal distension and epithelial flattening, and focal tubular microcystic change with prominent hyaline cast formation (PAS). Glomeruli of stage 2 mice show focal global or segmental collapsing lesions characterized by collapse of the tuft with associated epithelial changes, including proliferation within Bowman’s space, protein reabsorption, and vacuolization (PAS). Trichrome staining of stage 2 glomeruli shows focal segmental collagen deposition in the tuft largely confined to lesional glomeruli. Kidney cortex of stage 3 mice exhibits widespread chronic changes with extensive tubular microcystic change and few viable tubules noted. In stage 3 mice, many sclerosed glomeruli are present along with glomeruli showing changes similar to those seen in stage 2 mice, and trichrome stain shows segmental to global collagen deposition in the tuft of most glomeruli. Magnification, ×100 in the left column; ×400 in the middle and right columns. Scale bar, 100 μm.
Tg26 Mouse Glomeruli Exhibit Increasing Deformability
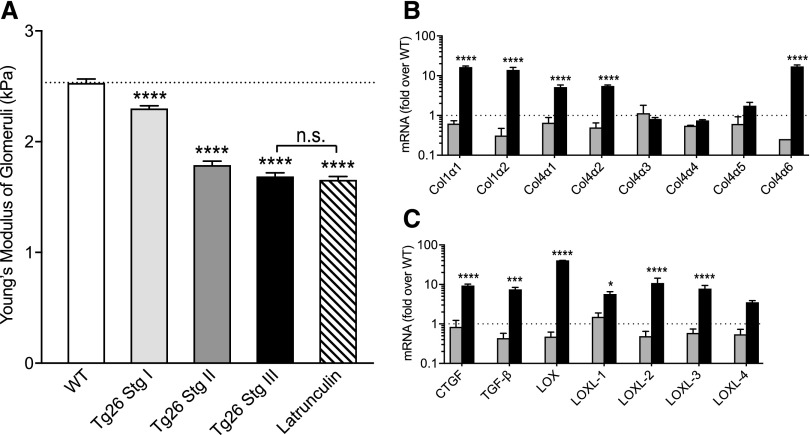
The E of glomeruli reflects the E of capillary walls (WT 2.3 kPa) (Figure 2A, Supplemental Material).5,26,29 With disease progression, Tg26 glomeruli become increasingly deformable. Although E decreased, extracellular matrix collagen staining increased with more advanced disease (Figure 1). Because of this discrepancy between progressive softening of glomeruli and increased matrix, we investigated the expression levels of genes associated with fibrosis. In stage 2 glomeruli, the levels of transcripts measured are similar to WT control. However, in stage 3 glomeruli, the levels of mRNAs coding for CTGF, TGF-β, the lysyl oxidases, and types 1, 4α1, and 4α2 collagens are markedly elevated from stage 2 (Figure 2, B and C). These mRNAs are not elevated in Tg26 podocytes (Supplemental Figure 2), indicating that podocytes are probably not the source of collagen. This progressive softening of stages 2 and 3 glomeruli (Figure 2A) was surprising with the increases in profibrotic cytokines, collagen, lysyl oxidase expression, and trichrome staining, and it suggests that, in addition to matrix, the state of cells in matrix may also be an important determinant of the elastic characteristics of tissues.
Figure 2.
Comparison of glomerular E and gene expression changes over the course of HIV nephropathy. (A) Comparison of the E values for the normal WT and stages 1–3 Tg26 glomeruli (mean±SEM; for the WT, 2.3±0.04 kPa [n=23]; for stage 1, 2.2±0.05 kPa [n=51]; for stage 2, 1.88±0.10 kPa [n=25]; for stage 3, 1.58±0.09 kPa [n=12]; and for latrunculin 0.5 μm, 1.5±0.15 kPa [n=5]). Comparable stiffness of stage 3 latrunculin-treated glomeruli shows the extent of loss of glomerular structural integrity in stage 3 Tg26. ****P<0.001 compared with the WT by ANOVA followed by Tukey multiple comparisons test. (B and C) Quantitative RT-PCR measurement of selected mRNAs relevant to fibrosis and scarring from stage 2 (dark gray) and stage 3 (black) glomeruli. Levels are fold differences over the WT normal glomeruli, and they are expressed as fold change from internal glyceraldehyde-3-phosphate dehydrogenase control. Values are mean±SEM (n=3 or 4 for each bar). *P<0.05 by two-way ANOVA followed by the Sidak multiple comparisons test; ***P<0.001 by two-way ANOVA followed by the Sidak multiple comparisons test; ****P<0.0001 by two-way ANOVA followed by the Sidak multiple comparisons test.
Tg26 Podocytes Have Abnormal Structure
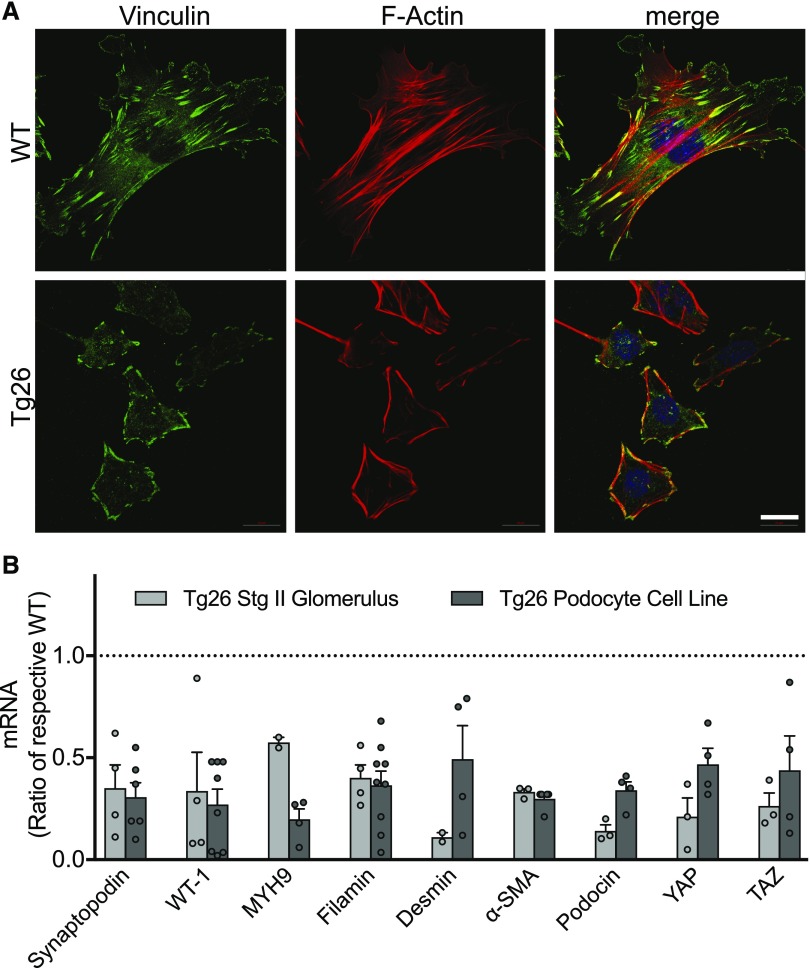
Normal podocytes cultured on collagen-coated glass are widely spread cells with prominent stress fibers and mature focal adhesions (Figure 3A). Tg26 podocytes are smaller and have irregular shapes; few developed actin stress fibers, and they rarely form normal focal adhesions. Vinculin aggregates linearly at the cell periphery with F actin in a similar pattern. Expressions of synaptopodin, podocin, and WT-1 are reduced in Tg26 podocytes and stage 2 glomeruli (Figure 3B) compared with the WT. These results are consistent with prior reports and loss of podocyte differentiation proteins and/or loss of podocytes in vivo in the Tg26 mouse model and humans with HIVAN.30,31 Additionally, mRNA for proteins associated with cells’ mechanical environment (filamin A and nonmuscle myosin IIa),14,32 genes that increase with fibrosis and are used as markers for myofibroblast development (desmin and α-smooth muscle actin), and proteins associated with mechanosensing and fibrosis (YAP and TAZ) are reduced in Tg26 podocytes and stage 2 glomeruli (Supplemental Figure 2).33–35 These results show that Tg26 podocytes have not only abnormal morphology but also, reduced expression of essential structural proteins and proteins involved in fibrosis, consistent with an extreme form of glomerular and podocyte injury.34,36,37
Figure 3.
Structure of normal and Tg26-cultured podocytes and expression of selected mRNAs. (A) Representative images of normal WT and Tg26 podocytes stained for F actin with rhodamine phalloidin (red) and vinculin (green) to identify focal adhesions and 4′,6-diamidino-2-phenylindole (blue) to identify nuclei. Scale bar, 20 μm. (B) Quantitative RT-PCR measurements of mRNA levels in stage 2 Tg 26 glomeruli (gray) or the Tg29 podocyte cell line (black). Levels are fold differences over normal WT glomeruli or the WT podocyte cell line, and they are expressed as fold change from internal glyceraldehyde-3-phosphate dehydrogenase control. Values shown are mean±SEM. All bars are significantly lower than respective WT controls; P<0.05 by ANOVA followed by the Dunnett multiple comparisons test.
Defective Mechanosensing in Tg26 Podocytes
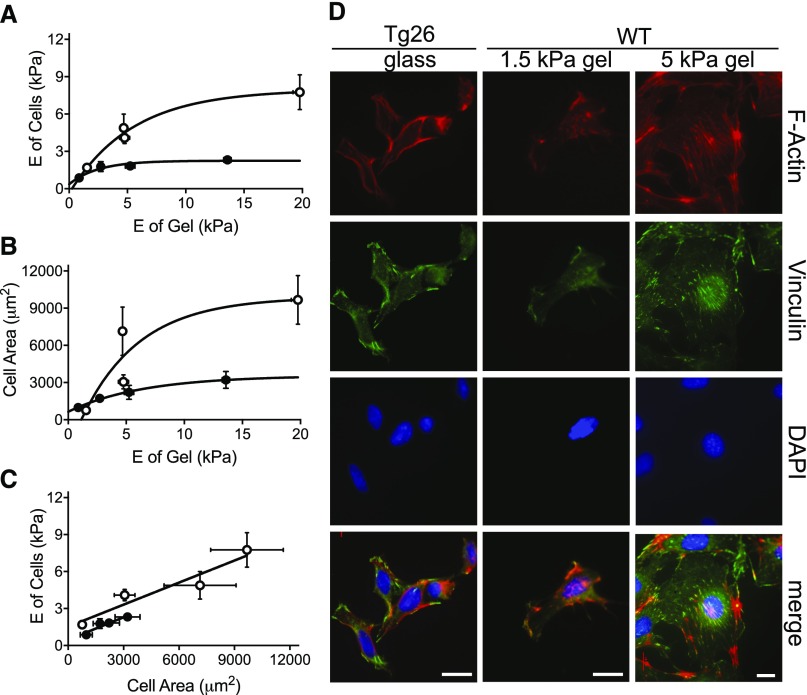
To determine if the increased deformability of Tg26 glomeruli is attributable to abnormal podocyte responses to their mechanical environment, we tested the ability of normal and Tg26 podocytes to respond to matrices of increasing stiffness (Figure 4, A–C).27 Normal podocytes stiffened dramatically in response to increased substrate E, whereas Tg26 podocytes achieve a much lower maximum (Figure 4A).14 Similarly, Tg26 podocytes failed to spread to the same degree as normal podocytes with increasing substrate elasticity (Figure 4B). Thus, the capacity of Tg26 podocytes to respond to substrate elasticity by remodeling their cytoskeletons is defective (Figure 4C).
Figure 4.
Defective mechanosensing and responsiveness of Tg26 podocytes grown on collagen-coated polyacrylamide gels of defined E value. (A) The stiffening response of normal (white circles) and Tg26 podocytes (black circles) as a function of matrix stiffness. Cells were grown on type 1 collagen–coated acrylamide gels ranging in E value from 0.3 to 20 kPa. The E of each cell was measured using atomic force microscopy (AFM; six to eight measurements), and the region of matrix around the cell was also measured (six to eight measurements). WT podocytes reach a maximum E of 7.7±1.4 kPa on 19.8-kPa gels, whereas Tg26 podocytes achieve a maximum E of 2.1±0.3 kPa on 13.6-kPa gels. Horizontal error bars represent mean values of matrix E ±SEM, and vertical error bars represent the mean E values of cells ±SEM. (B) The spreading response of normal (white circles) and Tg26 (black circles) podocytes as a function of matrix stiffness. Cells were grown on type 1 collagen–coated acrylamide gels as above. The area of each cell was measured using ImageJ (four to five measurements per cell), and the E of the region of matrix around the cell was measured with AFM (six to eight measurements). The area of WT podocytes was 9900±3500 μm2, whereas the area of Tg26 podocytes was 3500±700 μm2 at maximum gel stiffness values. Horizontal error bars represent mean values of matrix E ±SEM, and vertical error bars represent the area of multiple cells (n=30–50) in the region of gels, with E values shown on the y axis. (C) Comparison of WT and Tg26 podocyte cell stiffness as a function of area. Paired responses to matrix stiffness are compared to illustrate a broader dynamic range of cytoskeletal rearrangement in the WT. (D) Comparison of WT and Tg26 podocyte cell morphology changes in response to matrix stiffness. Tg26 podocytes plated on type 1 collagen–coated glass were compared with WT podocytes grown on collagen-coated polyacrylamide gels of 1.5 or 5 kPa. Cells were imaged by confocal microscopy for F actin (red), vinculin (green), and nuclei (4′,6-diamidino-2-phenylindole [DAPI]; blue). Representative images of WT cells grown on 5-kPa stiffness were reduced to fit extensively spread cells in comparatively sized panels. Scale bars, 18 μm.
Loss of responsiveness to substrate elasticity is evident from comparison of stress fiber formation and focal adhesion structure in normal podocytes grown on collagen-coated 1.5- and 5-kPa gels with Tg26 podocytes grown on collagen-coated glass. On 5-kPa gels, normal podocytes spread, and they develop stress fibers and normal-appearing focal adhesions (Figure 4D). On 1.5-kPa gels, they did not spread, focal adhesions and stress fibers were not evident, and vinculin and F actin colocalized most intensely at the cell periphery. On glass, Tg26 podocytes resembled normal podocytes grown on 1.5-kPa gels. These results show that Tg26 podocytes cannot recognize rigid matrices and exhibit abnormal responses to their mechanical environment and that growth on a soft matrix (1.5 kPa; similar to stage 3 glomeruli) is sufficient to cause abnormal podocyte structure.
Reduced Cytoskeletal Reorganization and Attenuated Paxillin Phosphorylation
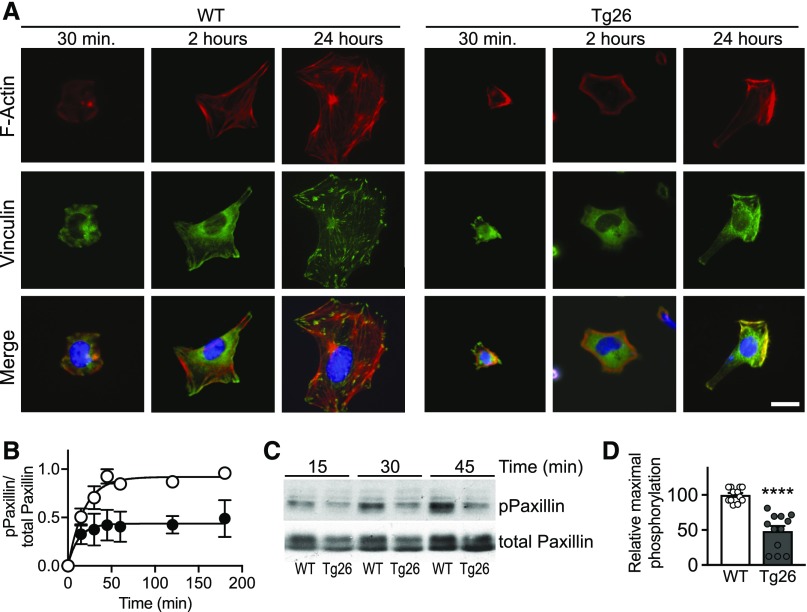
When normal cells are plated on collagen-coated surfaces, they attach, spread, and form focal adhesions and stress fibers. Conditionally immortalized Tg26 and WT podocytes were compared from 0.5 to 24 hours after plating for cell shape, stress fiber, and focal adhesion formation (Figure 5A). Tg26 podocytes exhibit minimal spreading between 0.5 and 2 hours, and they fail to spread further and develop stress fibers or normal focal adhesions by 24 hours. Differential response to cell plating was quantified as a function of paxillin phosphorylation over time after plating. The time for half-maximal phosphorylation is not significantly different between WT and Tg26 podocytes, but the maximal phosphorylation response is attenuated in the Tg26 model (Figure 5, B–D). We found similar results with primary Tg26 and WT podocytes (Supplemental Figure 3).
Figure 5.
Defective attachment and spreading of Tg26 podocytes after plating on collagen. (A) Representative confocal images of WT and Tg26 podocytes at indicated times after plating on glass coverslips coated with type 1 collagen. Cells were stained for F actin (red) and vinculin (green) for focal adhesions and 4′,6-diamidino-2-phenylindole (blue) for nuclei. Scale bar, 18 μm. (B) Time course of paxillin phosphorylation after plating on type 1 collagen–coated plastic. Cells were plated for the times indicated and processed for immunoblotting for total and phosphorylated paxillin. Each point in the graph represents the mean±SEM of three separate experiments, and they are ratios of the maximum phosphorylation of the WT at 180 minutes. (C) Representative immunoblot of phosphorylated paxillin and total paxillin in cell lysates collected at indicated time points. (D) Comparison of maximal paxillin phosphorylation in WT and Tg26 cells. The level of phosphorylated paxillin in Tg26 podocytes averaged 48%±7% of the WT response. Bars represent averaged values of 45–180 minutes relative to the mean WT ±SEM. ****P<0.0001 compared with the WT by t test.
Abnormal Integrin-Dependent Signaling and Adhesion in Tg26 Podocytes
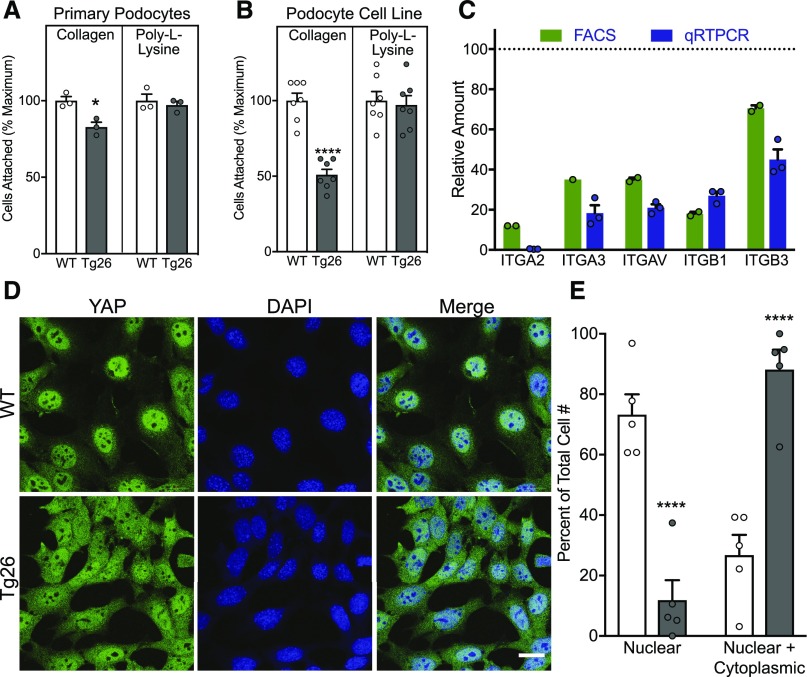
Comparison of the integrin-dependent (collagen) and -independent (poly-l-lysine) adhesive properties of primary WT and Tg26 (isolated from stage 2 kidneys) (Figure 6A) and conditionally immortalized WT and Tg26 podocytes (Figure 6B) showed that WT podocytes adhere better than Tg26 podocytes on collagen. The difference in adhesion to collagen is less in primary podocytes, possibly because the population is less uniform and represents less severe disease than the cell line. Consistent with reduced adhesion to collagen matrix, the mRNA and cell surface protein levels of integrins were reduced in Tg26 compared with WT podocytes (Figure 6C). Reduced expression of integrins and presumably, integrin-linked signals is consistent with persistent YAP localization in the cytoplasm in Tg26 podocytes38 (Figure 6, D and E).
Figure 6.
Defective integrin-mediated adhesion and traction of Tg26 podocytes. Adhesion of (A) normal WT and Tg26 primary podocytes and (B) WT and Tg26 podocytes on collagen (type 1) and poly-l-lysine quantified using crystal violet staining of attached cells. Each bar represents the mean of four experiments, with triplicate wells in each experiment. Values are expressed as a percentage of the maximum OD reading for an experiment (highest value for the WT). *P<0.05 versus control by paired t test; ****P<0.0001 versus control by paired t test. (C) Comparison of cell surface integrin expression by FACS analysis (green) or mRNA levels by quantitative RT-PCR (qRT-PCR; blue) for indicated integrins characteristic of Tg26 podocytes compared with the WT. FACS values represent the combined results from two separate experiments with duplicate samples. qRT-PCR values represent the mean relative expression values of four separate experiments ±SEM. All bars are significantly lower than WT values. (D) Localization of YAP in WT and Tg26 podocytes. Cells were plated on type 1 collagen–coated glass coverslips and stained for YAP (green) and 4′,6-diamidino-2-phenylindole (DAPI; blue) for nuclei; then, they were imaged using confocal microscopy. (E) Comparison of YAP distribution in WT and Tg26 cells. Ten fields of WT and Tg26 podocytes (approximately 100 cells in each group) were evaluated by four independent observers and assigned either a nuclear or a nuclear and cytoplasmic distribution. Results are percentage of WT or Tg26 cells with either a nuclear or a nuclear and cytoplasmic distribution ±SEM. ****P<0.0001 by two-way ANOVA followed by the Sidak comparison with the matched WT.
Tg26 Podocytes Lack Contractile Activity
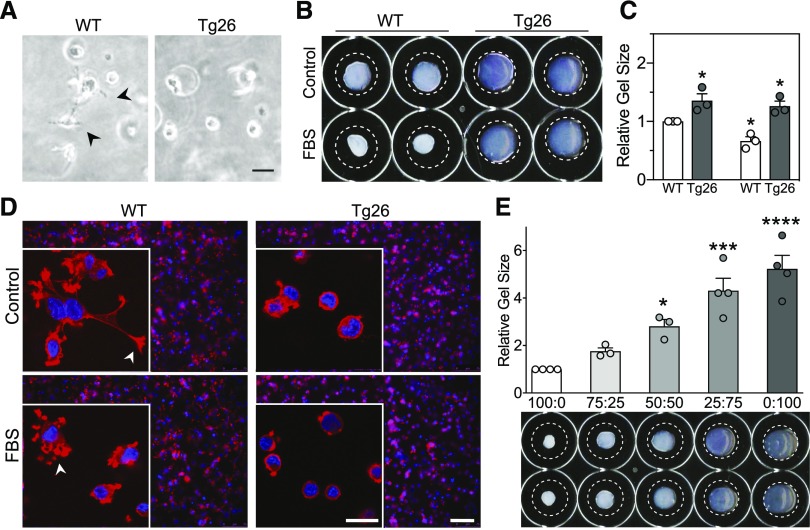
The ability of cells to contribute to the mechanical properties of tissues depends on matrix binding and exertion of traction force, and it is functionally important for podocytes and glomerular capillaries. To determine if the differences in glomerular E between WT and Tg26 mice translates to differences in the contractile responses of podocytes, cells were seeded in a three-dimensional collagen matrix, and their appearance and ability to contract the gel was assessed. WT podocytes extend processes, whereas Tg26 podocytes remain round (Figure 7A). Compared with WT cells, Tg26 cells contract the gel area less than control (Figure 7, B, upper row and C, left bars). With contractile stimuli (FBS), podocytes retract formed processes, shrinking gels in a floating gel contraction assay (Figure 7, B and C).28 Tg26 cell matrix contracted minimally in response to FBS (Figure 7, B, lower row and C, right bars). Distinct contractile responses of WT and Tg26 podocytes are evident by confocal microscopy of cells in three-dimensional matrix (Figure 7D). To test for interaction of WT and Tg26 podocytes in gel contraction, different proportions of the two cell types were mixed in three-dimensional gels (Figure 7E). Gel contraction was maximum at a WT-to-Tg26 ratio (range percentage) of 100:0, and it decreased linearly with the ratio to 0:100.
Figure 7.
Defective contractile function of Tg26 podocytes. (A) Representative images of cells in three-dimensional collagen matrices. Images were obtained after 1 hour of gel polymerization before matrix was released from the substrate and allowed to float. Arrowheads point to WT podocyte extensions that are not present in Tg26 cells in three-dimensional culture. Scale bar, 75 μm. (B) Representative images of collagen gels at the end point of the floating matrix assay. (C) Quantitation of WT (white bars) and Tg26 podocyte (black bars) collagen matrix contraction. Data are from three independent experiments (n=3) performed in duplicate. Relative gel area after 4 hours of control or FBS treatment. *P<0.05 by ANOVA (GraphPad Prism). (D) Confirmation of equivalent numbers of cells in three-dimensional matrices (2×10⁴ cells) by a low-magnification immunofluorescence image of merged actin (phalloidin) and nuclei staining. Images were taken after 2 hours of 20% FBS treatment. Insets show confocal images of representative cells from the same respective matrices for enhanced observation of F-actin extensions that are visible in the WT cells. Arrowheads point to extensions in WT cells in control condition, which were retracted toward the cell body in FBS condition. Tg26 podocytes have negligible extensions in control and FBS conditions. Scale bar, 75 μm; 20 μm in insets. (E) Reduced three-dimensional gel contraction with graded replacement of WT podocytes by Tg26 podocytes. The same total number of cells (total 4×10⁴) was mixed with collagen gels in WT-to-Tg26 ratios ranging from 100:0 to 0:100. Gel area after contraction as shown in the representative image below the bar graph was calculated relative to the WT alone. *P<0.05 by two-way ANOVA followed by the Sidak multiple comparisons test; ***P<0.001 by two-way ANOVA followed by the Sidak multiple comparisons test; ****P<0.0001 by two-way ANOVA followed by the Sidak multiple comparisons test.
Protamine Increases Glomerular Deformability and Leads to Loss of Podocyte Mechanical Integrity
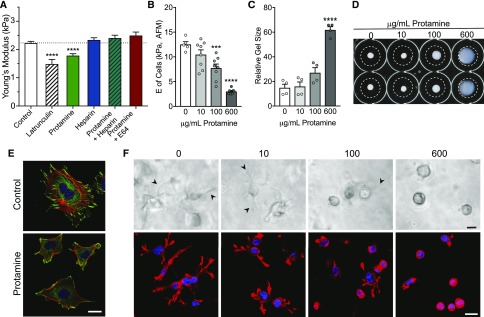
Protamine induces mild, reversible podocyte injury, and it is a model for minimal change disease. It activates the EGF-R pathway, increases Cai, and causes foot process effacement, proteinuria, and loss of stress fibers via degradation of synaptopodin.12,13,22 Both heparin and E64 (cathepsin-L inhibitor) block the effects of protamine on podocyte structure. Protamine1 (600 μg/ml) reduced glomerular E by 20% (Figure 8A), a smaller effect than latrunculin or Tg26 (Figure 2A). Consistent with work by others who measured proteinuria or podocyte structure,13,23 the effect of protamine is blocked by pretreatment with heparin or E64. Exhibiting behavior similar to Tg26 podocytes, protamine injury reduces adhesion of podocytes to collagen (Supplemental Figures 4–6) and reduces E of WT podocyte cell membranes14 (Figure 8B) and podocyte contraction (Figure 8, C and D) in a dose-dependent manner. Acute protamine treatment (600 μg/ml) disrupts the cytoskeletal structure and focal adhesions of WT podocytes (Figure 8E), causing reduced cell size, irregular shape, loss of stress fibers, reduced focal adhesion numbers, and an altered vinculin staining pattern resembling Tg26 podocytes (Figure 3). Podocyte spreading and process formation in three-dimensional gels are also reduced in a dose-dependent manner (Figure 8F). These results show that protamine has similar effects on the biophysical properties of glomeruli and podocytes as expression of the HIV genome, but unlike HIV genome expression, the effects of protamine are less severe and reversible.
Figure 8.
Protamine causes increased deformability of glomeruli and reduced podocyte adhesion, and it disrupts podocyte cytoskeletal structure and contractility. (A) E of isolated glomeruli was measured with microindentation. Glomeruli were treated as indicated with latrunculin (1 μM), protamine 600 μg/ml, or heparin sulfate (0.1 U/ml) for 2 hours before measurements. For studies with protamine and heparin or E64, heparin (0.1 U/ml) or E64 (10 μM) was added 10 minutes before addition of protamine (600 μg/ml). Latrunculin that depolymerizes F actin reduced E from 2.2±0.05 kPa (n=23; control) to 1.5±0.15 kPa (n=5) and protamine to 1.7±0.08 kPa (n=20), and heparin increased E to 2.3±0.07 kPa (n=13). Pretreatment of glomeruli for 10 minutes with heparin or E64 before addition of protamine prevented the protamine-induced reduction in E (2.4±0.09 kPa [n=14] and 2.5+0.1 kPa [n=7], respectively). ****P<0.0001 by ANOVA with the Dunnett multiple comparisons test.12,23 (B) Measurement of podocyte cell membrane E using atomic force microscopy (AFM). Podocytes grown on collagen type 1–coated glass were treated with 10, 100, or 600 μg/ml protamine for 2 hours. Eight to ten measurements were made on ten cells in each dose group using AFM. Each error bar represents the mean±SEM of measurements of ten cells. ***P<0.01, and ****P<0.0001 versus control by paired t test. (C) Equal numbers of podocytes (4×10⁴) were treated with protamine (0, 10, 100, or 600 μg/ml) for 30 minutes before mixing in gels. Gels were allowed to polymerize for 60 minutes, imaged, released from the dishes, and treated with FBS. Podocyte collagen matrix contraction was quantitated essentially as described above (Figure 7). Relative gel sizes shown are averages of three independent experiments (n=3) performed in duplicate. ****P<0.0001 by ANOVA (GraphPad Prism). (D) Representative images of collagen gels at the end point of floating matrix assay. (E) Confocal images of control and protamine-treated (600 μg/ml; 30 minutes before fixation) podocytes. Red indicates rhodamine-phalloidin (F actin), green indicates vinculin (focal adhesions), and blue indicates 4′,6-diamidino-2-phenylindole (DAPI; nuclei). Scale bar, 20 μm. (F) Representative images of cells in three-dimensional collagen matrices taken after 1 hour of gel polymerization before matrix was released from the substrate and allowed to float. Arrowheads point to podocyte extensions that are progressively less visible with increasing protamine dose and absent in cells with the 600-μg/ml dose in three-dimensional culture. Lower panels show F actin–stained (phalloidin) and nuclei-stained (DAPI) confocal images taken after 2 hours of 20% FBS treatment. Protamine treatment of podocytes reduces extensions in response to FBS in a dose-dependent manner. Scale bars, 20 μm in upper panels; 75 μm in lower panels.
Discussion
Podocytes have an important role in determining the elastic and structural characteristics of glomerular capillaries and glomeruli, although the contributions of podocytes and the GBM have not been resolved definitively.4,5,9,39 Although mechanisms of injury differ, podocytes are also the primary glomerular cell injured in many diseases and disease models, including the Tg26 mouse and protamine administration.13,17 In response to injury, podocytes rearrange their cytoskeletons with effacement of foot processes and loss of filtration barrier function, and this response to injury may correspond to increased deformability of podocytes and glomeruli. With progressive disease, they detach from the GBM, leading to glomerulosclerosis. In both the Tg26 and the protamine models, the biophysical abnormalities of glomeruli and podocytes are similar in nature but different in degree, duration, and primary cause. HIV proteins cause extensive irreversible disruption of the podocyte cytoskeleton with loss of functional podocytes, whereas protamine through the EGF-R pathway and increased Cai cause reversible foot process effacement and transient filtration barrier loss.11–13,16 In both models, reduced mechanical integrity of glomerular capillary walls is evident from reduced E values, and it is more severe in the stage 3 Tg26 model (1.58 kPa; similar to latrunculin and depolymerized F actin) versus 1.73 kPa in response to protamine (similar to ischemia and nonmuscle myosin inhibition).5
Tg26 podocytes that express the HIV genome have a dedifferentiated phenotype.14,30,32 Nef, via Diaphenous-Interacting Protein and p90RhoGap, reduces RhoA activity and increases Rac1 activity, causing loss of stress fibers with increased lamellipodia formation.16 We found that Tg26 podocytes are smaller than the WT with F actin at cell peripheries, have few stress fibers, are more deformable than normal, and have fragile plasma membranes.14 We now add that these cells have grossly abnormal focal adhesion formation and structure, reduced ability to spread and stiffen on a stiff matrix, reduced adhesion to collagen, and minimal ability to exert traction force, all features of disrupted sensation of or responses to mechanical cues. Although HIVAN, the human disease, its pathogenesis, and progression may be different from the Tg26 model, both conditions seem to represent severe, progressive podocyte injury.
Our observation that normal podocytes cultured on soft matrix resemble Tg26 podocytes shows that a pathologically soft physical environment is capable of disrupting the normal structure of podocytes (Figure 4). We and others found that the normal E of glomerular capillaries is 2–4 kPa and that culturing podocytes on soft matrix (<2 kPa) causes a reduction in mRNAs coding for filamin A, nonmuscle myosin IIa, WT-1 protein expression, and expression of other differentiation markers.5,6,26,29 Inhibition of integrin and cadherin function reduced glomerular E, indicating that cell matrix and cell-cell adhesion both contribute to a normal glomerular mechanical environment.5 The reduced E value of an individual injured podocyte would not only provide inadequate structural support to a capillary at that location but could also reduce the ability of normal neighboring podocytes to maintain the biophysical properties required to support capillary function (Figure 7). Loss of a biophysically normal neighbor could cause altered gene expression and dedifferentiation in normal podocytes, resulting in progressive capillary failure (possibly what is seen in podocyte reduction models).2 In this context, stiffening of glomeruli and capillaries (e.g., increased collagen expression) would serve as a protective mechanism to preserve the biophysical environment, the structure of capillaries, and the function of uninjured podocytes to permit preservation or recovery of the tissue after injury. Failure to stiffen, such as is the case in the Tg26 mice with nephropathy, could lead to the rapid progression seen in HIVAN. Tg26 mesangial cells do not appear to contribute to glomerular E in this model, because they behave normally and are not measured with microindentation (Supplemental Figures 4 and 5).
Tg26 glomeruli from stage 3 mice (most severe glomerular injury, softest glomeruli, and highest level of proteinuria) have increased collagen content and lysyl oxidase mRNA expression (Figures 1 and 2). The levels of mRNA coding for the profibrotic cytokines CTGF and TGF-β are also increased. These factors, presumably with increased collagen crosslinking due to increased lysyl oxidase expression, should lead to stiff matrix and glomeruli. However, Tg26 glomeruli soften progressively (to 1.58 from 2.3 kPa) (Figure 2A). This discrepancy may relate to the recently described importance of cells in determining the elastic properties of model gels and tissues.40–42
The increased stiffness of fibrotic tissue is equated with increased matrix deposition, primarily collagen, but this scenario may be an oversimplification of the relationship among cells, matrix, and tissue mechanics. Fibrin polymer gels are highly deformable with small forces, but with addition of activated platelets that bind fibrin strands and apply traction, they become markedly stiffer. Contractile fibroblasts stiffen collagen matrices in a similar manner.42 When fibrotic, stiff liver is treated with agents that disrupt integrin function or cell structure, it becomes more deformable, almost to the level of normal liver.40 The increased stiffness of fibrotic tissues may be caused by not only increased matrix and its structure but also, the adhesive and contractile characteristics of cells embedded in the matrix. Loss of the structural and mechanical integrity of podocytes (Tg26, protamine) is sufficient to prevent normal collagen gel contraction in response to serum (Figure 7). Stiffening of fibrotic tissue may permit maintenance of structural integrity at the cost of function but allow for future healing and recovery of function by remaining cells.
In podocyte reduction models, podocytes are lost in two phases: initial response to the agent (1–2 days) and subsequent loss of podocytes that were not targets of the insult (approximately 7 days).2,43 If a critical mass of podocytes is lost (20%–40%), renal failure progresses with loss of GFR and tubulointerstitial injury in a third phase. The reason for the second phase of podocyte loss is not clear, but a biophysical mechanism could contribute to it.2,3,43,44 When injured podocytes lose structural integrity, neighboring cells will not have an adjacent cell to pull against to generate tension. The altered biophysical environment causes reductions in stress fiber and focal adhesion formation, cell E values, cell adhesion, and potentially, altered gene expression patterns (dedifferentiation).5,6 We show that increasing numbers of biophysically defective podocytes (Tg26) causes progressive loss of three-dimensional collagen gel contraction, a simple model of the mechanical role of podocytes in a glomerulus (Figure 7). Defective structure and reduced adhesion of these cells would increase their susceptibility to detachment and loss in response to shear force.3,4
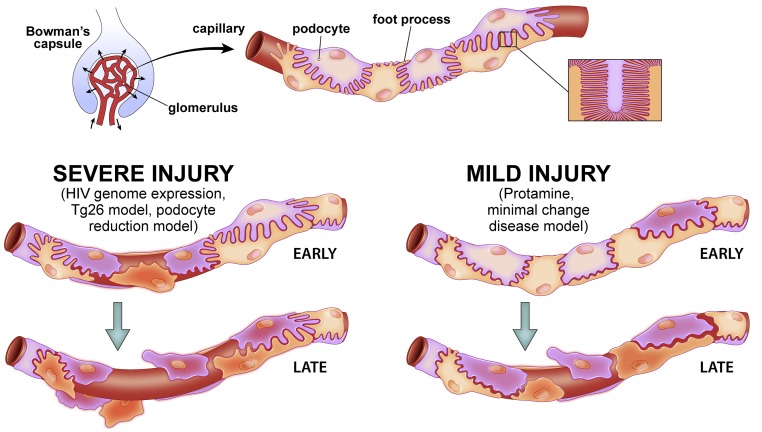
In human disease, sporadic nonsynchronous softening or injury of podocytes caused by mutations, ApoL1 variants, diabetes, HIV infection, hypertrophy, or idiopathic FSGS could cause loss of primarily injured as well as normal adjacent podocytes in a manner similar to that described above.15,45–47 Reduced structural integrity of capillaries could lead to hemodynamic injury, even in the absence of hypertension. Diffuse injury, such as minimal change disease (modeled as protamine or puromycin aminonucleoside administration), could either resolve if the injury is not severe or progress if a large enough subpopulation of podocytes develops biophysical incompetence and detaches from capillary walls. These scenarios are illustrated in Figure 9. These diseases also may be progressive in part on the basis of a biophysical mechanism.3 Progressive glomerular disease has numerous components, including inflammation, autophagy, metabolic derangement, and fibrosis. Biophysical factors may contribute to progressive injury through reduced structural integrity of podocytes, altered physical signals to normal glomerular cells resulting in reduced expression of structural proteins and differentiation markers, reduced podocyte adhesion, and reduced structural integrity of capillaries.
Figure 9.
Representation of the effects of focal severe injury (e.g., HIV genome expression, Tg26 model, and podocyte reduction model) and mild diffuse injury (protamine and minimal change disease model) on podocyte behavior on glomerular capillary walls. Normal podocytes on a capillary (top center) have foot process interdigitations that provide full coverage of the GBM. In focal severe injury (left path), an injured podocyte, such as could occur with HIV infection or in a podocyte reduction model, becomes structurally disordered. Podocyte injury corresponds to increased deformability, reduced adhesion, and reduced ability to generate traction force. Thus, with sufficiently severe injury, the injured podocyte loses its connections to neighboring podocytes (early). Loss of contact and ability to generate traction force against the primarily injured cell, which ultimately detaches from the GBM (red) and is lost, induces changes in cytoskeletal structure and gene expression patterns in neighboring cells, propagating a cycle of secondary cell injury due to abnormal mechanical environment. This cycle of injury can result in progressive podocyte loss from glomerular capillaries (late). In diffuse, mild injury (right path), which could occur with repeated puromycin aminonucleoside administration or minimal change disease, the injured cells are better preserved than the severely injured red cell in the left path. However, injured cells have increased deformability, adhere less well to the matrix and each other, and have reduced ability to generate traction force. With exposure to shear and distending forces, some podocytes detach from capillary walls, leading to a progressive process similar to that described above but slower than the severe injury scenario. In both severe and mild injury, if enough podocytes are affected and lost, the resultant abnormal biophysical environment could be sufficient to promote progressive loss of glomerular function. Rapid loss of podocytes in the absence of a fibrotic response could result in short-term capillary failure, whereas the basic structure would be preserved in a state that progressed more slowly and allowed fibrosis to develop.
Disclosures
None.
Supplementary Material
Acknowledgments
We thank Angel Diehl (Scientific Art Texas; dielang@gmail.com) for her work on Figure 9.
This work was funded by National Institutes of Health grants R01 DK083592 (to P.A.J., L.A.B., and R.T.M.) and R01 EBO17753 (to P.A.J.), the Charles and Jane Pak Center for Mineral Metabolism and Clinical Research (R.T.M.), the Veterans Affairs Administration (R.T.M.), the University of Texas Southwestern O’Brien Center for Kidney Disease (R.T.M.), and the generosity and encouragement of Scott M. Grundy.
Footnotes
Published online ahead of print. Publication date available at www.jasn.org.
This article contains supplemental material online at http://jasn.asnjournals.org/lookup/suppl/doi:10.1681/ASN.2017050475/-/DCSupplemental.
References
- 1.Fogo AB: Causes and pathogenesis of focal segmental glomerulosclerosis. Nat Rev Nephrol 11: 76–87, 2015 [DOI] [PMC free article] [PubMed] [Google Scholar]
- 2.Matsusaka T, Sandgren E, Shintani A, Kon V, Pastan I, Fogo AB, et al.: Podocyte injury damages other podocytes. J Am Soc Nephrol 22: 1275–1285, 2011 [DOI] [PMC free article] [PubMed] [Google Scholar]
- 3.Lemley KV: Mechanical challenges to the glomerulus and podocyte loss: Evolution of a paradigm. Pflugers Arch 469: 959–963, 2017 [DOI] [PubMed] [Google Scholar]
- 4.Kriz W, Lemley KV: A potential role for mechanical forces in the detachment of podocytes and the progression of CKD. J Am Soc Nephrol 26: 258–269, 2015 [DOI] [PMC free article] [PubMed] [Google Scholar]
- 5.Embry AE, Mohammadi H, Niu X, Liu L, Moe B, Miller-Little WA, et al.: Biochemical and cellular determinants of renal glomerular elasticity. PLoS One 11: e0167924, 2016 [DOI] [PMC free article] [PubMed] [Google Scholar]
- 6.Hu M, Azeloglu EU, Ron A, Tran-Ba KH, Calizo RC, Tavassoly I, et al.: A biomimetic gelatin-based platform elicits a pro-differentiation effect on podocytes through mechanotransduction. Sci Rep 7: 43934, 2017 [DOI] [PMC free article] [PubMed] [Google Scholar]
- 7.Engler AJ, Sen S, Sweeney HL, Discher DE: Matrix elasticity directs stem cell lineage specification. Cell 126: 677–689, 2006 [DOI] [PubMed] [Google Scholar]
- 8.Endlich N, Endlich K: The challenge and response of podocytes to glomerular hypertension. Semin Nephrol 32: 327–341, 2012 [DOI] [PubMed] [Google Scholar]
- 9.Kriz W, Hackenthal E, Nobiling R, Sakai T, Elger M, Hähnel B: A role for podocytes to counteract capillary wall distension. Kidney Int 45: 369–376, 1994 [DOI] [PubMed] [Google Scholar]
- 10.Kopp JB, Klotman ME, Adler SH, Bruggeman LA, Dickie P, Marinos NJ, et al.: Progressive glomerulosclerosis and enhanced renal accumulation of basement membrane components in mice transgenic for human immunodeficiency virus type 1 genes. Proc Natl Acad Sci U S A 89: 1577–1581, 1992 [DOI] [PMC free article] [PubMed] [Google Scholar]
- 11.Bruggeman LA, Dikman S, Meng C, Quaggin SE, Coffman TM, Klotman PE: Nephropathy in human immunodeficiency virus-1 transgenic mice is due to renal transgene expression. J Clin Invest 100: 84–92, 1997 [DOI] [PMC free article] [PubMed] [Google Scholar]
- 12.Rüdiger F, Greger R, Nitschke R, Henger A, Mundel P, Pavenstädt H: Polycations induce calcium signaling in glomerular podocytes. Kidney Int 56: 1700–1709, 1999 [DOI] [PubMed] [Google Scholar]
- 13.Buvall L, Wallentin H, Sieber J, Andreeva S, Choi HY, Mundel P, et al.: Synaptopodin is a coincidence detector of tyrosine versus serine/threonine phosphorylation for the modulation of rho protein crosstalk in podocytes. J Am Soc Nephrol 28: 837–851, 2017 [DOI] [PMC free article] [PubMed] [Google Scholar]
- 14.Tandon R, Levental I, Huang C, Byfield FJ, Ziembicki J, Schelling JR, et al.: HIV infection changes glomerular podocyte cytoskeletal composition and results in distinct cellular mechanical properties. Am J Physiol Renal Physiol 292: F701–F710, 2007 [DOI] [PubMed] [Google Scholar]
- 15.Bruggeman LA, Ross MD, Tanji N, Cara A, Dikman S, Gordon RE, et al.: Renal epithelium is a previously unrecognized site of HIV-1 infection. J Am Soc Nephrol 11: 2079–2087, 2000 [DOI] [PubMed] [Google Scholar]
- 16.Lu TC, He JC, Wang ZH, Feng X, Fukumi-Tominaga T, Chen N, et al.: HIV-1 Nef disrupts the podocyte actin cytoskeleton by interacting with diaphanous interacting protein. J Biol Chem 283: 8173–8182, 2008 [DOI] [PMC free article] [PubMed] [Google Scholar]
- 17.Zhong J, Zuo Y, Ma J, Fogo AB, Jolicoeur P, Ichikawa I, et al.: Expression of HIV-1 genes in podocytes alone can lead to the full spectrum of HIV-1-associated nephropathy. Kidney Int 68: 1048–1060, 2005 [DOI] [PubMed] [Google Scholar]
- 18.Barisoni L, Schnaper HW, Kopp JB: Advances in the biology and genetics of the podocytopathies: Implications for diagnosis and therapy. Arch Pathol Lab Med 133: 201–216, 2009 [DOI] [PMC free article] [PubMed] [Google Scholar]
- 19.Bruggeman LA, Nelson PJ: Controversies in the pathogenesis of HIV-associated renal diseases. Nat Rev Nephrol 5: 574–581, 2009 [DOI] [PMC free article] [PubMed] [Google Scholar]
- 20.Rosenberg AZ, Naicker S, Winkler CA, Kopp JB: HIV-associated nephropathies: Epidemiology, pathology, mechanisms and treatment. Nat Rev Nephrol 11: 150–160, 2015 [DOI] [PubMed] [Google Scholar]
- 21.Kurihara H, Anderson JM, Kerjaschki D, Farquhar MG: The altered glomerular filtration slits seen in puromycin aminonucleoside nephrosis and protamine sulfate-treated rats contain the tight junction protein ZO-1. Am J Pathol 141: 805–816, 1992 [PMC free article] [PubMed] [Google Scholar]
- 22.Pippin JW, Brinkkoetter PT, Cormack-Aboud FC, Durvasula RV, Hauser PV, Kowalewska J, et al.: Inducible rodent models of acquired podocyte diseases. Am J Physiol Renal Physiol 296: F213–F229, 2009 [DOI] [PubMed] [Google Scholar]
- 23.Vassiliadis J, Bracken C, Matthews D, O’Brien S, Schiavi S, Wawersik S: Calcium mediates glomerular filtration through calcineurin and mTORC2/Akt signaling. J Am Soc Nephrol 22: 1453–1461, 2011 [DOI] [PMC free article] [PubMed] [Google Scholar]
- 24.Schwartz EJ, Cara A, Snoeck H, Ross MD, Sunamoto M, Reiser J, et al.: Human immunodeficiency virus-1 induces loss of contact inhibition in podocytes. J Am Soc Nephrol 12: 1677–1684, 2001 [DOI] [PubMed] [Google Scholar]
- 25.Mundel P, Reiser J, Zúñiga Mejía Borja A, Pavenstädt H, Davidson GR, Kriz W, et al.: Rearrangements of the cytoskeleton and cell contacts induce process formation during differentiation of conditionally immortalized mouse podocyte cell lines. Exp Cell Res 236: 248–258, 1997 [DOI] [PubMed] [Google Scholar]
- 26.Levental I, Levental KR, Klein EA, Assoian R, Miller RT, Wells RG, et al.: A simple indentation device for measuring micrometer-scale tissue stiffness. J Phys Condens Matter 22: 194120, 2010 [DOI] [PMC free article] [PubMed] [Google Scholar]
- 27.Byfield FJ, Wen Q, Levental I, Nordstrom K, Arratia PE, Miller RT, et al.: Absence of filamin A prevents cells from responding to stiffness gradients on gels coated with collagen but not fibronectin. Biophys J 96: 5095–5102, 2009 [DOI] [PMC free article] [PubMed] [Google Scholar]
- 28.Liu Z, Ho CH, Grinnell F: The different roles of myosin IIA and myosin IIB in contraction of 3D collagen matrices by human fibroblasts. Exp Cell Res 326: 295–306, 2014 [DOI] [PMC free article] [PubMed] [Google Scholar]
- 29.Wyss HM, Henderson JM, Byfield FJ, Bruggeman LA, Ding Y, Huang C, et al.: Biophysical properties of normal and diseased renal glomeruli. Am J Physiol Cell Physiol 300: C397–C405, 2011 [DOI] [PMC free article] [PubMed] [Google Scholar]
- 30.Barisoni L, Bruggeman LA, Mundel P, D’Agati VD, Klotman PE: HIV-1 induces renal epithelial dedifferentiation in a transgenic model of HIV-associated nephropathy. Kidney Int 58: 173–181, 2000 [DOI] [PubMed] [Google Scholar]
- 31.Barisoni L, Kriz W, Mundel P, D’Agati V: The dysregulated podocyte phenotype: A novel concept in the pathogenesis of collapsing idiopathic focal segmental glomerulosclerosis and HIV-associated nephropathy. J Am Soc Nephrol 10: 51–61, 1999 [DOI] [PubMed] [Google Scholar]
- 32.Hays T, D’Agati VD, Garellek JA, Warren T, Trubin ME, Hyink DP, et al.: Glomerular MYH9 expression is reduced by HIV-1. AIDS 26: 797–803, 2012 [DOI] [PMC free article] [PubMed] [Google Scholar]
- 33.Meliambro K, Wong JS, Ray J, Calizo RC, Towne S, Cole B, et al.: The Hippo pathway regulator KIBRA promotes podocyte injury by inhibiting YAP signaling and disrupting actin cytoskeletal dynamics. J Biol Chem 292: 21137–21148, 2017 [DOI] [PMC free article] [PubMed] [Google Scholar]
- 34.Rinschen MM, Grahammer F, Hoppe AK, Kohli P, Hagman H, Kretz O, et al.: YAP-mediated mechanotransduction determines the podocyte’s response to damage. Sci Signal 10: eaaf8165, 1–15, 2017 [DOI] [PubMed]
- 35.Schwartzman M, Reginensi A, Wong JS, Basgen JM, Meliambro K, Nicholas SB, et al.: Podocyte-specific deletion of yes-associated protein causes FSGS and progressive renal failure. J Am Soc Nephrol 27: 216–226, 2016 [DOI] [PMC free article] [PubMed] [Google Scholar]
- 36.Huang Z, Zhang L, Chen Y, Zhang H, Yu C, Zhou F, et al.: RhoA deficiency disrupts podocyte cytoskeleton and induces podocyte apoptosis by inhibiting YAP/dendrin signal. BMC Nephrol 17: 66, 2016 [DOI] [PMC free article] [PubMed] [Google Scholar]
- 37.Szeto SG, Narimatsu M, Lu M, He X, Sidiqi AM, Tolosa MF, et al.: YAP/TAZ are mechanoregulators of TGF-·-Smad signaling and renal fibrogenesis. J Am Soc Nephrol 27: 3117–3128, 2016 [DOI] [PMC free article] [PubMed] [Google Scholar]
- 38.Serrano I, McDonald PC, Lock F, Muller WJ, Dedhar S: Inactivation of the Hippo tumour suppressor pathway by integrin-linked kinase. Nat Commun 4: 2976, 2013 [DOI] [PMC free article] [PubMed] [Google Scholar]
- 39.Kriz W, Elger M, Mundel P, Lemley KV: Structure-stabilizing forces in the glomerular tuft. J Am Soc Nephrol 5: 1731–1739, 1995 [DOI] [PubMed] [Google Scholar]
- 40.Perepelyuk M, Chin L, Cao X, van Oosten A, Shenoy VB, Janmey PA, et al.: Normal and fibrotic rat livers demonstrate shear strain softening and compression stiffening: A model for soft tissue mechanics. PLoS One 11: e0146588, 2016 [DOI] [PMC free article] [PubMed] [Google Scholar]
- 41.Shah JV, Janmey PA: Strain hardening of fibrin gels and plasma clots. Rheol Acta 36: 262–268, 1997 [Google Scholar]
- 42.van Oosten ASG, Vahabi M, Licup AJ, Sharma A, Galie PA, MacKintosh FC, et al.: Uncoupling shear and uniaxial elastic moduli of semiflexible biopolymer networks: Compression-softening and stretch-stiffening. Sci Rep 6: 19270, 2016 [DOI] [PMC free article] [PubMed] [Google Scholar]
- 43.Rutkowski JM, Wang ZV, Park ASD, Zhang J, Zhang D, Hu MC, et al.: Adiponectin promotes functional recovery after podocyte ablation. J Am Soc Nephrol 24: 268–282, 2013 [DOI] [PMC free article] [PubMed] [Google Scholar]
- 44.D’Agati V: Podocyte injury can be catching. J Am Soc Nephrol 22: 1181–1183, 2011 [DOI] [PubMed] [Google Scholar]
- 45.Hodgin JB, Bitzer M, Wickman L, Afshinnia F, Wang SQ, O’Connor C, et al.: Glomerular aging and focal global sclerosis: A podometric perspective. J Am Soc Nephrol 26: 3162–3178, 2015 [DOI] [PMC free article] [PubMed] [Google Scholar]
- 46.Pagtalunan ME, Miller PL, Jumping-Eagle S, Nelson RG, Myers BD, Rennke HG, et al.: Podocyte loss and progressive glomerular injury in type II diabetes. J Clin Invest 99: 342–348, 1997 [DOI] [PMC free article] [PubMed] [Google Scholar]
- 47.Wiggins JE, Goyal M, Sanden SK, Wharram BL, Shedden KA, Misek DE, et al.: Podocyte hypertrophy, “adaptation,” and “decompensation” associated with glomerular enlargement and glomerulosclerosis in the aging rat: Prevention by calorie restriction. J Am Soc Nephrol 16: 2953–2966, 2005 [DOI] [PubMed] [Google Scholar]
Associated Data
This section collects any data citations, data availability statements, or supplementary materials included in this article.


