

Abstract
Background The failure of spontaneous resolution underlies chronic inflammatory conditions, including microvascular complications of diabetes such as diabetic kidney disease. The identification of endogenously generated molecules that promote the physiologic resolution of inflammation suggests that these bioactions may have therapeutic potential in the context of chronic inflammation. Lipoxins (LXs) are lipid mediators that promote the resolution of inflammation.
Methods We investigated the potential of LXA4 and a synthetic LX analog (Benzo-LXA4) as therapeutics in a murine model of diabetic kidney disease, ApoE−/− mice treated with streptozotocin.
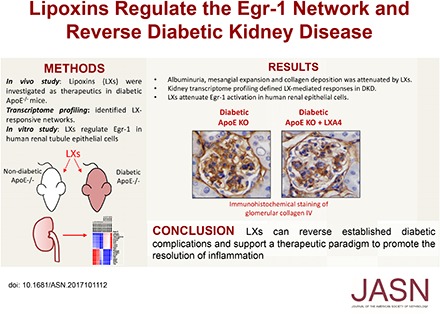
Results Intraperitoneal injection of LXs attenuated the development of diabetes-induced albuminuria, mesangial expansion, and collagen deposition. Notably, LXs administered 10 weeks after disease onset also attenuated established kidney disease, with evidence of preserved kidney function. Kidney transcriptome profiling defined a diabetic signature (725 genes; false discovery rate P≤0.05). Comparison of this murine gene signature with that of human diabetic kidney disease identified shared renal proinflammatory/profibrotic signals (TNF-α, IL-1β, NF-κB). In diabetic mice, we identified 20 and 51 transcripts regulated by LXA4 and Benzo-LXA4, respectively, and pathway analysis identified established (TGF-β1, PDGF, TNF-α, NF-κB) and novel (early growth response–1 [EGR-1]) networks activated in diabetes and regulated by LXs. In cultured human renal epithelial cells, treatment with LXs attenuated TNF-α–driven Egr-1 activation, and Egr-1 depletion prevented cellular responses to TGF-β1 and TNF-α.
Conclusions These data demonstrate that LXs can reverse established diabetic complications and support a therapeutic paradigm to promote the resolution of inflammation.
Keywords: Chronic inflammation, diabetic nephropathy, kidney dysfunction, transcriptional profiling, transgenic mouse
Diabetes is recognized as a major epidemic, which has increased in incidence by 50% over the past 15 years.1,2 Diabetic microvascular complications include kidney disease (nephropathy) as well as neuropathy and retinopathy.3 Diabetic kidney disease (DKD) is the leading cause of ESRD, affecting approximately 30% of patients with long-standing type 1 and type 2 diabetes, and is characterized by proteinuria and gradual loss of kidney function.4,5 There is now a growing appreciation for the role of chronic low-grade inflammation as a common pathogenic mechanism. Evidence from clinical studies suggests that inflammatory markers including TNF-α, IL-1, IL-6, and monocyte chemoattractant protein 1 (MCP-1) are elevated in patients with diabetes (type 1 and type 2), and that their levels may predict the onset and progression of diabetic complications.6–11
The failed resolution of inflammation may be a major contributor to the pathogenesis of diabetes, CVD, and associated complications.12–15 The identification of endogenous mediators that promote resolution, including lipids and cytokines, provides a template for potential mimicry and avoiding the complications associated with chronic anti-inflammatory approaches.12,16–25 Lipoxin A4 (LXA4) is an eicosanoid generated during acute inflammatory responses that promotes the resolution of inflammation via the G-protein coupled receptor formyl peptide receptor 2 (ALX/FPR2).19,26,27 Here, we have explored the potential of LXA4 and a synthetic analog, Benzo-LXA4, to modulate DKD in a murine model (streptozotocin [STZ]-treated ApoE−/− mice). This model combines the genetic deletion of apo E, leading to hyperlipidemia, with STZ-mediated pancreatic islet β cell ablation, leading to diabetes, ultimately driving a more severe and accelerated renal injury.28–36 We report that LXs attenuate the development of proteinuria and glomerular injury in diabetic mice. Most noteworthy are our data that show that LXs reverse established renal damage. We have investigated the underlying mechanisms for these responses via high-throughput sequencing of renal tissue and have identified specific networks of gene expression induced by diabetes and susceptible to regulation by LXs including Egr-1.
Methods
In Vivo Preclinical Studies
Six-week-old ApoE−/− male mice (C57BL/6 background) were rendered diabetic by five daily intraperitoneal (ip) injections of STZ (Sigma-Aldrich, St Louis, MO) at a dose of 55 mg/kg. ApoE−/− mice were administered either ethanol (0.1%), LXA4 (5 μg/kg; Merck, Calbiochem), or Benzo-LXA4 (1.7 μg/kg; synthesized at University College Dublin, Ireland37) twice weekly by ip injection. For the prevention study design, mice were followed for 10 or 20 weeks, and were administered ethanol, LXA4, or Benzo-LXA4 between weeks 1 and 10 or weeks 1 and 20, respectively. For the intervention study design, mice were followed for 16 weeks, and were administered ethanol, LXA4, or Benzo-LXA4 between weeks 10 and 16. Blood glucose levels were monitored weekly after STZ injections for the duration of the studies to confirm the diabetic status of these mice. Detailed methods are available in the Supplemental Material.
In Vitro Studies
Immortalized human kidney epithelial cells (HK-2; ECACC, Porton Down, UK) were cultured at 37°C in a humidified atmosphere of 95% air/5% CO2, and maintained in DMEM-F12 (Sigma-Aldrich, Steinheim, Germany) supplemented with 2 mM L-glutamine, 100 U/ml penicillin, 100 mg/ml streptomycin, 10 ng/ml epidermal growth factor, 36 ng/ml hydrocortisone, and 3 pg/ml triiodothyronine; and 5 mg/ml insulin, 5 mg/ml transferrin, and 5 ng/ml selenium solution (Sigma-Aldrich). After serum restriction for 24 hours, cells were stimulated with vehicle (0.1% ethanol), LXA4 (0.1 nM), or Benzo-LXA4 (1 nM) for 30 minutes and media was removed and replaced with media with or without TGF-β1 (10 ng/ml; PromoCell GmbH).
Renal RNA-Seq Profiling
Detailed methods are available on RNA-seq and bioinformatic analysis in the Supplemental Material. Briefly, RNA was isolated from kidney Trizol homogenates using the Direct-zol RNA MiniPrep Kit (Zymo Research; n=6 kidneys per treatment group). Normalized read counts for all genes in all samples are detailed in Supplemental Table 9. Transcripts with a false discovery rate (FDR) P value <0.05 were deemed statistically significant. Upstream regulator analysis of differentially expressed gene sets was performed using the Ingenuity Pathway Analysis Z-score algorithm (Qiagen). Analysis of promoters for enriched TFBSs was performed using Genomatix Matbase (Genomatix). RNA-seq data are deposited at the Gene Expression Omnibus (GSE107942).
Statistical Analyses
All statistical analyses were performed utilizing GraphPad Prism software. Experiments with only one treatment were assessed by t test. Experiments with multiple treatment groups were analyzed by one-way ANOVA with post hoc comparisons of group means performed by Fisher’s least significant difference method. A P value ≤0.05 was considered statistically significant. Significance between groups is indicated for each figure. Unless otherwise specified, data are shown as mean±SEM.
Results
LXs Prevent the Development of Diabetes-Associated Kidney Disease
We induced diabetes mellitus using low-dose STZ in ApoE−/− mice, which were followed for 10–20 weeks to allow development of moderate (10 weeks) and severe (20 weeks) kidney disease. In keeping with our previous investigations using LXA4 or Benzo-LXA4, we observed no evidence of toxicity or increased mortality in animals administered LXs. All diabetic animals had elevated blood glucose and glycated hemoglobin levels in comparison with their nondiabetic controls. Diabetic ApoE−/− mice exhibit renal hyperfiltration, as evidenced by increased creatinine clearance (Table 1). LXA4 and Benzo-LXA4 attenuated diabetes-induced increases in creatinine clearance at 10 weeks (Table 1). This protection was also evident at 20 weeks, with no significant increase in creatinine clearance between control and diabetic ApoE−/− mice that received LXA4. There was also increased urinary albumin in diabetic ApoE−/− mice at 10 weeks and 20 weeks, and we provide evidence of reduced albuminuria in diabetic ApoE−/− mice that received LXA4 at 10 weeks (Table 1) and Benzo-LXA4 at 20 weeks (Table 1). Furthermore, renal hypertrophy (kidney/body weight ratio) in diabetic ApoE−/− mice was elevated in comparison with nondiabetic control ApoE−/− mice, and this effect was attenuated in 10-week diabetic ApoE−/− mice treated with LXs (Table 1).
Table 1.
Metabolic data for ApoE−/− mice with and without diabetes treated with LXA4 or Benzo-LXA4
| ApoE KO+Vehicle | ApoE KO+LXA4 | ApoE KO+Benzo-LXA4 | ||||
|---|---|---|---|---|---|---|
| Nondiabetic | Diabetic | Nondiabetic | Diabetic | Nondiabetic | Diabetic | |
| 10 wk progression study: LXA4 or Benzo-LXA4 treatment, weeks 1–10 | ||||||
| Plasma glucose, mmol/L | 10.7±0.4 | 28.2±1.2a | 10.5±0.3 | 27.5±1.2a | 11.1±1.3 | 29.2±0.8a |
| Glycated Hb, % | 4.8±0.1 | 10.0±0.9a | 4.7±0.1 | 10.1±0.8a | 4.4±0.1 | 9.7±0.8a |
| Systolic BP, mm Hg | 108.0±0.31 | 109.0±0.73 | 108.0±0.21 | 108.0±0.69 | 109.0±0.76 | 109.0±0.27 |
| Body weight, g | 30.2±0.5 | 24.2±0.6a | 29.7±0.6 | 23.8±0.6a | 29.9±0.3 | 24.9±0.7a |
| Kidney weight, g | 0.19±0.003 | 0.21±0.006a | 0.19±0.006 | 0.20±0.006 | 0.20±0.006 | 0.20±0.006 |
| Kidney/body weight, % | 0.6±0.01 | 0.9±0.02a | 0.6±0.02 | 0.8±0.03a,b | 0.7±0.02 | 0.8±0.02a,b |
| Urinary albumin, µg/24 h | 11.3±1.5 | 33.8±4.1a | 12.3±3.3 | 21.3±3.7a,b | 9.1±2.2 | 27.1±6.7a |
| Creatinine clearance, ml/min | 0.21±0.06 | 0.26±0.02 | 0.15±0.04c | 0.19±0.04b | 0.12±0.02c | 0.14±0.02b |
| Creatinine clearance, ml/min per m2 | 14.1±2.3 | 31.2±2.6a | 16.5±4.4 | 19.1±2.5b | 12.6±1.9 | 15.7±2.3b |
| 20 wk progression study: LXA4 or Benzo-LXA4 treatment, weeks 1–20 | ||||||
| Plasma glucose, mmol/L | 10.1±0.2 | 28.7±0.7a | 10.1±0.2 | 30.0±0.6a | 10.0±0.1 | 29.4±0.7a |
| Glycated Hb, % | 4.3±0.1 | 11.0±0.7a | 4.6±0.1 | 11.9±0.7a | 4.7±0.1 | 10.3±0.9a |
| Systolic BP, mm Hg | 108.0±0.38 | 109.0±0.55 | 108.0±0.21 | 107.0±0.66 | 108.0±73 | 109.0±0.27 |
| Body weight, g | 29.9±0.5 | 25.8±0.8a | 30.6±0.7 | 23.8±0.9a | 31.0±0.6 | 24.7±0.8a |
| Kidney weight, g | 0.19±0.005 | 0.21±0.006a | 0.20±0.006 | 0.23±0.008a | 0.20±0.005 | 0.22±0.005a |
| Kidney/body weight, % | 0.6±0.01 | 0.8±0.03a | 0.6±0.01 | 0.9±0.03a | 0.6±0.01 | 0.8±0.03a |
| Urinary albumin, µg/24 h | 17.6±2.8 | 84.0±20.9a | 14.0±2.8 | 58.5±11.0a | 18.1±2.8 | 33.7±4.8a,b |
| Creatinine clearance, ml/min | 0.15±0.02 | 0.20±0.02a | 0.16±0.03 | 0.19±0.02 | 0.18±0.02 | 0.33±0.07a,b |
| Creatinine clearance, ml/min per m2 | 15.8±2.3 | 24.9±1.9a | 16.5±3.1 | 21.0±2.7 | 19.7±1.9 | 38.4±7.4a |
| 16 wk intervention study: LXA4 or Benzo-LXA4 treatment, weeks 10–16 | ||||||
| Plasma glucose, mmol/L | 10.1±0.2 | 31.4±0.7a | 9.8±0.1 | 29.4±0.9a | 9.7±0.2 | 31.8±0.4a |
| Glycated Hb, % | 4.6±0.13 | 11.8±0.5a | 4.4±0.1 | 11.5±0.7a | 4.7±0.2 | 10.7±1.0a |
| Systolic BP, mm Hg | 109.0±0.61 | 109.0±0.71 | 110.0±0.83 | 109.0±0.44 | 109.0±0.72 | 108.0±0.71 |
| Body weight, g | 32.9±1.0 | 23.4±0.9a | 31.5±0.6 | 23.7±0.6a | 31.9±0.3 | 24.3±0.9a |
| Kidney weight, g | 0.21±0.008 | 0.20±0.008 | 0.21±0.007 | 0.21±0.006 | 0.21±0.006 | 0.20±0.007 |
| Kidney/body weight, % | 0.6±0.03 | 0.9±0.02a | 0.7±0.02 | 0.9±0.04a | 0.6±0.01 | 0.8±0.03a |
| Urinary albumin, µg/24 h | 13.9±1.4 | 25.1±2.1a | 15.2±1.9 | 17.3±2.4b | 15.1±1.6 | 21.3±2.9a |
Data are shown as mean±SEM. n=8–12 per group. KO, knockout; Hb, haemoglobin.
ANOVA P<0.05 versus nondiabetic.
ANOVA P<0.05 versus diabetic ApoE KO+Vehicle.
ANOVA P<0.05 versus nondiabetic ApoE KO+Vehicle.
At 20 weeks, diabetes-induced glomerular expansion and mesangial matrix expansion were significantly attenuated by LXs, as assessed by periodic acid–Schiff staining (Figure 1, A and B). Similarly, Masson’s trichrome staining indicated an increase in extracellular matrix accumulation in diabetic ApoE−/− mice at 20 weeks. Interestingly, LXA4, but not Benzo-LXA4, attenuated extracellular matrix accumulation in diabetic ApoE−/− mice (Supplemental Figure 1). Diabetic ApoE−/− mice at 10 weeks showed evidence of enhanced fibrotic responses: increased expression of genes encoding collagen (col1, col3, col4), α–smooth muscle actin (α-sma), connective tissue growth factor (ctgf), tgfβ1, icam-1, vcam-1, mcp1, il-6, il-1β, and tnf-α, in comparison with nondiabetic ApoE−/− control mice (Figure 1C).
Figure 1.

LXs attenuate DKD. (A) Structure of endogenous LXA4 and Benzo-LXA4 and study design overview. ApoE−/− mice were rendered diabetic by STZ, and a subgroup of diabetic and nondiabetic ApoE−/− mice were administered ethanol (0.1%), LXA4 (5 μg/kg), or Benzo-LXA4 (1.7 μg/kg) twice weekly ip from weeks 1 to 10 (10-week prevention study) or weeks 1 to 20 (20-week prevention study). (B and C) Paraffin-embedded kidney sections of 20-week diabetic and control ApoE−/− mice administered ethanol (0.1%), LXA4, or Benzo-LXA4 from weeks 1 to 20 were stained by periodic acid–Schiff stain. Quantification of the glomerulosclerosis injury index is shown in the bar graph as mean±SEM (n=8–10/group; *P<0.05;**P<0.01). (D) Gene expression analysis of markers of kidney damage in kidney cortex tissue isolated from 10-week diabetic and nondiabetic ApoE−/− mice administered vehicle, LXA4, or Benzo-LXA4. Expression was normalized to 18S for gene expression analysis (n=8–10, ±SEM; *P≤0.05 versus ApoE−/−+vehicle; φP≤0.05 versus Diabetic ApoE−/−+Vehicle). KO, knockout; qPCR, quantitative polymerase chain reaction.
LXs Reverse Established Diabetes-Associated Kidney Disease
Given the observations that LXs could attenuate the development of kidney disease we then investigated whether LXs could affect established disease. Diabetes was induced by STZ, and treatment with LXs introduced at 10 weeks for an additional 6 weeks (16-week intervention study). At 16 weeks, diabetic ApoE−/− mice presented with significantly elevated urinary albumin, and LXA4 treatment attenuated albuminuria (Table 1). Diabetes-induced glomerular expansion and mesangial matrix expansion were significantly attenuated by LXs, as assessed by periodic acid–Schiff staining (Figure 2, A and B). Immunohistochemical staining of collagen IV in glomeruli indicated that LXA4 treatment significantly reduced collagen IV expression (Figure 2, C and D). LX treatment significantly attenuated gene expression of markers of fibrosis in diabetic mice, including col1a1, Fibronectin (fn1), α-sma, ctgf, tgf-β, and vegf (Figure 2, E and F). Similarly, the gene expression levels of known inflammatory mediators (vcam-1, mcp-1, tnf-α, nf-κb, il-1β, il-6, il-10, cd204, arg1, inos) were significantly reduced after LX treatment.
Figure 2.

LXs reverse established DKD. (A) Study design overview. ApoE−/− mice were rendered diabetic by STZ and diabetes was allowed to progress for 10 weeks, after which a subgroup of diabetic and nondiabetic ApoE−/− mice were administered ethanol (0.1%), LXA4 (5 μg/kg), or Benzo-LXA4 (1.7 μg/kg) twice weekly ip from weeks 10 to 16. (B and C) Paraffin-embedded kidney sections of 16-week intervention study diabetic and control ApoE−/− mice administered ethanol (0.1%), LXA4, or Benzo-LXA4 from weeks 10 to 16 were stained by periodic acid–Schiff stain. Quantification of the glomerulosclerosis injury index is shown in the bar graph as mean±SEM (n=8–10/group; *P<0.05; **P<0.01; ***P<0.001). (D and E) Immunohistochemical staining of collagen IV in glomeruli of paraffin-embedded kidney sections of 16-week intervention study diabetic and control ApoE−/− mice administered ethanol (0.1%), LXA4, or Benzo-LXA4 from weeks 10 to 16. Quantification of staining is shown in the bar graph as mean±SEM (n=8–10/group; *P<0.05). Gene expression analysis of markers of (F) kidney fibrosis and (G) inflammation in kidney cortex tissue isolated from 16-week diabetic and nondiabetic ApoE−/− mice administered vehicle, LXA4, or Benzo-LXA4 from weeks 10 to 16. Expression was normalized to 18S for gene expression analysis (n=8–10, ±SEM; *P≤0.05 versus ApoE−/−+vehicle; φP≤0.05 versus Diabetic ApoE−/−+Vehicle). KO, knockout; qPCR, quantitative polymerase chain reaction.
Renal Transcriptome Profiling Identifies LX-Regulated Transcriptional Networks
To further understand the molecular mechanisms underlying renal complications of diabetes and the effects of LXs, we investigated global gene expression in kidneys from control and diabetic ApoE−/− mice administered vehicle (ethanol (0.1%), LXA4, or Benzo-LXA4 from weeks 1 to 10 (n=6 per treatment group). After data filtering and normalization, 725 genes were differentially expressed between control and diabetic ApoE−/− mice (FDR P≤0.05) (Figure 3A, Supplemental Figure 2, Supplemental Table 1). Here, there was notably greater expression of fn1, col4a1, vcam1, gremlin (grem1), sulf2, trp53inp1, mgmt, cdkn1a, and eda2r, and a corresponding decrease in cyp2d12 expression in diabetic kidneys (Figure 3B). The observed increase in expression of the bone morphogenetic antagonist grem1 in diabetic kidneys is consistent with our previous studies identifying Gremlin as an important mediator of DKD.38,39 Comparison of transcriptome profiles in control and diabetic ApoE−/− mice identified several enriched upstream regulators predicted to be activated or repressed in diabetic kidneys. Among these, the activity of TNF-α, IL-6, NF-κB, TGF-β, VEGF, and PDGF is enhanced in the diabetic kidney (Z-score ≥2 or ≤−2; Figure 3C, Supplemental Table 2).
Figure 3.

Transcriptome profiling identifies the networks associated with kidney disease in the diabetic ApoE−/− mouse model. (A) Venn diagram indicating number of significant differentially expressed transcripts (FDR P value <0.05) between diabetic and control ApoE−/− mice administered ethanol (0.1%), LXA4, or Benzo-LXA4 from weeks 1 to 10. (B) Renal expression levels of fn1, col4a1, grem1, vcam1, cyp2d12, trp53inp1, sulf2, mgmt, cdkn1a, and eda2r genes in control and diabetic mice administered ethanol (0.1%) (n=5–6 per group; FDR P value <0.05 for all transcripts). (C) Upstream regulators expected to be increased or decreased between control and diabetic ApoE−/− mice administered ethanol. Regulators were identified using the IPA regulation Z-score algorithm according to gene expression changes. A positive or negative Z-score value indicates that a function is predicted to be increased (red color) or decreased (blue color), respectively. Corresponding −Log2 P values indicate whether there is a statistically significant overlap between the dataset genes and genes that are known to be regulated by the upstream regulator. All regulators represented on the graph are significantly enriched (Z-score ≥2 or ≤−2; P<0.05). GPCRs, G-protein coupled receptors; vs, versus.
Because these transcriptomic data are derived from whole kidney cortex, we performed an analysis of cell type–specific expression profiles within the cluster of 725 genes identified as differentially expressed between control and diabetic ApoE−/− mice. We first performed a basic glomerular versus tubule compartment analysis using published microarray data from healthy human kidneys,40 with no bias seen toward a specific compartment (Supplemental Figure 3). Using gene profiles from each of 14 renal tubule segments along the proximal tubule,41 we identified segment-specific profiles (Supplemental Figure 4).
The overlap of the molecular signature of the diabetic ApoE−/− kidney with publicly available human DKD glomerular and tubular transcriptome profiles was investigated (Supplemental Figure 5).42 Upstream regulator enrichment analysis identified a cohort of regulators predicted to be activated or repressed in human diabetic kidneys (Z-score ≥2 or ≤−2), and the activation of these regulators was next determined in the diabetic ApoE−/− kidney. Hierarchic clustering analysis of enriched regulators in human and murine DKD tissue identified coregulated networks (Supplemental Figure 6). Noteworthy among the coregulated activators, there was evidence of increased activity of TNF-α, NF-κB, IL-1β, and EGR-1 in diabetic tissues. Hierarchic clustering analysis of 268 known NF-κB targets expressed in ApoE−/− kidneys indicates that there is clustering of nondiabetic and diabetic kidneys on the basis of the expression of these genes (Supplemental Figure 6). We also note evidence of reduced activation of the let-7 micro-RNA family in human and mouse diabetic tissues, which is in keeping with our previous studies implicating loss of the let-7 miRNA family in renal fibrosis and also diabetes-associated atherosclerosis.43–45
Comparison of transcriptome profiles of diabetic ApoE−/− mice administered vehicle versus LXs identified several master regulators and transcripts modulated by LXs. Here, upstream regulator analysis predicts repression of NF-κB, TNF-α, PDGF, and IL-6 activity in diabetic ApoE−/− mice administered LXA4 (Figure 4A, Supplemental Table 3). Similarly, in diabetic ApoE−/− mice administered Benzo-LXA4, there is reduced activation of PDGF, TNF-α, and TGF-β signaling networks (Figure 4B). Differential expression analysis between treatment groups in diabetic ApoE−/− mice identified 20 and 51 transcripts regulated by LXA4 and Benzo-LXA4, respectively (FDR P≤0.05; Figure 4, C and D, Supplemental Tables 4 and 5).
Figure 4.

Analysis of renal transcriptome responses identifies LX-regulated transcriptional networks. (A and B) Upstream regulator analysis of transcriptome data identifies regulators predicted to be changed between diabetic ApoE−/− mice administered ethanol versus (A) LXA4 or (B) Benzo-LXA4 treatment from weeks 1 to 10. Regulators were identified using the IPA regulation Z-score algorithm according to gene expression changes. A positive or negative Z-score value indicates that a function is predicted to be increased (red color) or decreased (blue color), respectively. Corresponding −Log2 P values indicate whether there is a statistically significant overlap between the dataset genes and genes that are known to be regulated by the upstream regulator. All regulators represented on the graph are significantly enriched (Z-score ≥2 or ≤−2; P<0.05). (C and D) Heatmaps of normalized gene expression indicating transcripts displaying significant differential expression (FDR P value <0.05) between diabetic mice administered ethanol (0.1%) versus LXA4 or Benzo-LXA4 from weeks 1 to 10. Expression levels range from blue (low expression) to red (high expression). (E) Box plots indicating expression of genes regulated by both LXA4 and Benzo-LXA4 (egr1, adamtsl3, ngef, lamb3, grem1, and nr4a1). Transcript abundance across all treatment group is shown (*FDR P value <0.05). ID, identifier.
LXs Regulate the Egr-1 Transcriptional Network in Diabetic Kidneys
Transcriptome data indicates that the expression of the transcription factor early growth response–1 (egr-1) is increased in the diabetic ApoE−/− kidney, and this is prevented by LX treatment (Figure 4E). Recent studies suggest that Egr-1−/− mice are protected from kidney disease in a model of tubulointerstitial nephritis, with attenuated renal proximal tubule injury and NF-κB activity evident.46 To expand on these data, we determined whether there was an enrichment for specific transcription factor binding sites within the promoters of the 725 differentially expressed genes in the diabetic ApoE−/− mouse kidney. Here, we noted a significant enrichment of binding sites for several transcription factors, including Egr-1 (Z-score=12.74) (Figure 5A, Supplemental Table 6). Interestingly, an analysis of the promoters of genes that were modulated by LXA4 (n=20) and Benzo-LXA4 (n=51) also identified a significant over-representation of Egr-1 binding sites within these genes, suggesting that LXs may act via targeting the Egr-1 downstream network (Figure 5A, Supplemental Table 6).
Figure 5.

LXA4 regulates the Egr-1 transcriptional network in renal epithelial cells. (A) Heatmap of over-represented transcription factor binding sites (TFBSs) in promoters of genes identified to be differentially expressed between nondiabetic and diabetic ApoE−/− mice administered ethanol, and also between diabetic mice ApoE−/− mice administered ethanol versus LXA4 or Benzo-LXA4. Enriched TFBSs were identified using the Genomatix Z-score algorithm, with a positive Z-score (red color) indicative of TFBS enrichment. All regulators represented on the graph are significantly enriched in at least one comparison (Z-score ≥2; P<0.05). (B) Egr-1 gene expression levels in human renal proximal tubule epithelial cells (HK-2) after TNF-α (1 ng/ml), TGFβ (5 ng/ml), and LXA4 treatment (0.1 nM; 30 minutes). (C) Gene expression of Egr-1 after siRNA treatment targeting Egr-1 in HK-2 cells. (D) Gene expression of markers of TNF-α signaling activation in HK-2 cells after TNF-α treatment (1 ng/ml; 24 hours) in the presence/absence of nontargeting scrambled siRNA or Egr-1 siRNA. (E) TNF-α gene expression levels in HK-2 cells after TNF-α (1 ng/ml) and LXA4 (0.1 nM) treatment. (F) Gene expression of markers of TGFβ signaling activation in HK-2 cells after TGFβ treatment (5 ng/ml; 24 hours) in the presence/absence of nontargeting scrambled siRNA or Egr-1 siRNA. (G) Representative western blot and corresponding densitometry analysis of protein expression levels of markers of TGFβ signaling activation in HK-2 cells after TGFβ treatment (5 ng/ml; 24 hours) in the presence/absence of nontargeting scrambled siRNA or Egr-1 siRNA. Expression was normalized to Gapdh for gene expression analysis and β-actin for protein expression (n=3–4, ±SEM). *P≤0.05. qPCR, quantitative polymerase chain reaction; siRNA, short-interfering RNA; vs, versus.
Analysis of the expression of predicted Egr-1–regulated genes was performed in publicly available expression data from human DKD tissue,42 identifying 155 Egr-1 target genes differentially expressed between patients with DKD and healthy controls (P≤0.05; Supplemental Figure 8). The expression of the Egr-1–regulated subset was then determined in the ApoE−/− kidneys RNA-seq dataset, and also compared against published transcriptomics data from renal tissue of three additional mouse models of diabetes (STZ DBA/2, C57BLKS db/db, and eNOS-deficient C57BLKS db/db mice).47 Interestingly, unsupervised hierarchic clustering analysis of the Egr-1–regulated subset on the basis of expression data from human and murine DKD tissues identifies a group of genes coregulated in human and mouse model diabetic tissues, including alox5, dclk1, col4a1, col4a2, vim, and relb. After LX treatment in diabetic ApoE−/− mice the expression of these genes was suppressed. These data indicate that Egr-1 targets are dysregulated in human and murine DKD, and LXs may regulate this transcriptional network.
We next sought to further investigate a mechanistic link between LXA4 and Egr-1 in human renal cells. Previous studies have indicated that primary induction of Egr-1 is observed within the proximal tubule,46,48,49 and we have previously characterized the transcriptome of immortalized human renal proximal tubule (HK-2) cells, with evidence of Egr-1 expression in these cells.50 Comparison of the HK-2 transcriptome with microdissected renal tubule RNA-seq data indicates that the profile of this cell line largely represents what is observed in the renal tubule, with evidence of expression of genes encoding key junctional proteins, indicating an epithelioid phenotype (Supplemental Figure 8, Supplemental Table 7). Metabolically, HK-2 cells express genes encoding the enzymes responsible for arginine synthesis and fructose conversion to glucose, all important metabolic functions of the proximal tubule. They express some but not all gene-encoding enzymes involved in the ammoniagenic pathway, and they also express a different set of lactate transporters than native proximal tubule cells. Interestingly, on the basis of our transcriptome data, these cells do not robustly express Megalin (lrp2), hnf4a, and Aquaporin-1 (aqp1), and they express a set of claudins that are more characteristic of downstream segments. Finally, whereas HK-2 cells express transcripts for major apical transporters sglt1 and napi-2, transcripts for several transporters involved in sulfate transport or organic ion transport are not detectable. Therefore, as is the case with many immortalized cell lines, these cells do not express all genes associated with the healthy native tubule, and it is important to recognize this limitation when designing experiments and interpreting data.
We performed time-course experiments using HK-2 cells pretreated with LXA4 (30 minutes; 1 nM) followed by TGF-β (5 ng/ml) or TNF-α (1 ng/ml) treatment for up to 24 hours. Enhanced Egr-1 expression was observed 30 minutes post–TNF-α treatment, with maximal induction observed 1 hour after TNF-α treatment (Figure 5B). This TNF-α–mediated induction of Egr-1 was significantly attenuated by LXA4 (Figure 5B). Egr-1 levels were unchanged in response to TGF-β. To determine the consequences of depleted Egr-1 levels in renal epithelial cells we performed siRNA experiments targeting Egr-1 (Figure 5C). After Egr-1 depletion, we observed a significant attenuation of Tnf-α gene expression in response to TNF-α treatment (Figure 5D), and confirmed that LXA4 can modulate Tnf-α gene expression in renal epithelial cells (Figure 5E). Despite the fact that TGF-β treatment of renal epithelial cells did not lead to any direct upregulation of Egr-1 expression (Figure 5B), after Egr-1 depletion there was an attenuated induction of collagen type 1 (Col1a1) and fibronectin (Fn1) by TGF-β (Figure 5, F–H), implicating Egr-1 as a downstream effector in the TGF-β pathway. This is in keeping with previous studies implicating Egr-1 in the regulation of Col1a1 and Fn151,52 and evidence that LX modulates expression of Col1a1 and Fn1 in renal epithelia.43 Taken together, these results suggest that LXs act to suppress the Egr–1 network in DKD.
Discussion
Pharmacologic strategies promoting the resolution of inflammation represent a novel therapeutic paradigm that could significantly reduce the global health burden associated with diabetes and related complications. We have shown for the first time the protective effects of LXs on kidney disease in a murine model of STZ‐induced diabetes. In addition to endogenous LXA4, we evaluated the therapeutic potential of a synthetic (1R)-stereoisomer analog (Benzo-LXA4), generated through modification of the LXA4 triene unit. Although our previous in vivo studies demonstrated a degree of protective effect for LXs in other experimental models of renal disease including unilateral ureteric obstruction,37,53 it is critical to examine its role in the most common cause of ESRD, diabetes, which now comprises more than 50% of individuals on renal replacement programs worldwide. In this study, the Benzo-LXA4 analog exerted similar actions to LXA4, and in some, but not all, contexts proved more effective than the native compound.
We have previously reported that, in this model, after 10 weeks of diabetes there is increased expression of genes related to fibrosis and inflammation as well as increased albuminuria and podocyte effacement, reflecting all markers of early DKD. After 16–20 weeks of diabetes, there is evidence of structural changes, including mesangial expansion, thickening of the glomerular basement membrane, and tubulointerstitial fibrosis, reflecting a more advanced stage of DKD.28–34,36,54–56 However, it is important to acknowledge that no model recapitulates all functional, structural, and molecular pathologic features of human DKD.57–60 In this study, diabetes was associated with kidney injury, as evidenced by increased kidney/body weight ratio, hyperfiltration, and albuminuria, typifying DKD. Importantly, LXs suppressed diabetes-induced kidney injury, as evidenced by reduced albuminuria. LXs attenuated the increase in kidney/body weight ratio observed in diabetic animals. LXs also attenuated glomerular expansion and mesangial matrix deposition. These data are consistent with our previous studies demonstrating that LXs can attenuate high-fat diet–induced kidney disease, and experimental tubulointerstitial fibrosis induced by unilateral ureteric obstruction.37,53 Furthermore, our data also highlight the potential of LXs to reverse established CKD in diabetic ApoE−/− mice, with renoprotective effects observed in those mice administered LXs for 6 weeks, commencing after 10 weeks of diabetes. This is relevant to the clinical context where diabetic subjects often present with evidence of renal disease, as reflected by albuminuria.
To expand on our understanding of the renoprotective effects of LXs, global transcriptome profiling was performed. Using this approach, a large cohort of transcripts were identified as differentially expressed between control and diabetic mouse tissue. Importantly, analysis of these transcripts provides evidence of activation of key regulatory networks implicated in the pathogenesis of human DKD, including TNF-α, IL-6, NF-κB, TGF-β, VEGF, and PDGF. This is an important observation because it clearly demonstrates the strength of this mouse model to mimic key facets of human disease. Analyses of transcriptional responses to LXs in the diabetic kidney suggest a repression of TNF-α, IL-1B, PDGF, NF-κB, and TGF-β regulatory networks. These confirm our previous findings in renal mesangial and epithelial cells demonstrating that LXs attenuate responses of these cells to growth factors such as PDGF via ALX/FPR2-mediated receptor tyrosine kinase activation and TGF-β via let-7 miRNA targeting of TGFβ-receptor, type 1.43,61 Considering the limitation of bulk tissue RNA-seq, future studies will be required to determine individual cell type responses to the setting of diabetes and also the LXs. Expression of the Egr zinc finger transcription factor Egr-1 was upregulated in the diabetic kidney, and reduced by both LXA4 and Benzo-LXA4. Egr-1 is part of the immediate-early gene (IEG) network, which are rapidly activated via extracellular signal regulated kinases, and mitogen-activated protein kinases.62 We, and others, have previously reported that LXA4 exerts its actions via both of these pathways.49,63 Egr-1 is induced in various cell types in response to a variety of stimuli, and functional studies in vascular endothelium have identified a number of targets that are induced by Egr-1 (TNF-α, ICAM-1, CD44, PDGF A/B chain, TGFβ, M-CSF).64 More recently, Egr-1 has been found to play a key role in regulating inflammation in kidney disease, with primary induction of Egr-1 observed in the proximal tubule in response to hyperglycemia and hypoxic stimuli.48,49 Interestingly, Egr-1 is implicated downstream of the AGE/RAGE axis in diabetic complications.65,66 Egr-1−/− mice are protected from kidney disease via impaired renal proximal tubule injury and reduced NF-κB activity.46 Here, our in silico analysis of promoter regions of genes changed in diabetic kidneys in response to LXs identified a strong enrichment of binding sites for Egr-1, indicating that this factor may be a downstream target for LXs. Our mechanistic studies in human renal tubule epithelial cells confirm the interaction between LXs and Egr-1, demonstrating an important role for Egr-1 in TNF-α and TGFβ signaling.
Collectively, this study emphasizes LXs as protective against DKD. These observations are particularly timely given the growing appreciation that mimicking endogenous resolution of inflammation may be a tractable and effective therapeutic paradigm.67
Disclosures
None.
Supplementary Material
Acknowledgments
E.P.B. was supported by an ELEVATE Irish Research Council Marie Curie Fellowship. This study was also supported by the National Health and Medical Research Council (NHMRC), the joint Juvenile Diabetes Research Foundation (JDRF)/National Health and Medical Research Foundation (NHMRC) Centres of Research Excellence (CRE) program, and in part by the Victorian Government’s Operational Infrastructure Support Program and by Science Foundation Ireland and the Health Research Board awards (15/IA/3152; 15/US/B3130 and 11/PI/1206).
E.P.B., K.J.-D., M.E.C., C.G., and P.K. designed the research and wrote the manuscript. E.P.B., M.M., A.M, C.T., M.Z., A.K., S.P.G., R.P., and A.E.-O. performed the experimental work and acquired and analyzed the data. S.T.A.-S. and P.G. designed and synthesized the Benzo-LXA4 analogue. All authors reviewed and approved the manuscript.
Footnotes
M.E.C., C.G., and P.K. co–senior-authors.
Published online ahead of print. Publication date available at www.jasn.org.
This article contains supplemental material online at http://jasn.asnjournals.org/lookup/suppl/doi:10.1681/ASN.2017101112/-/DCSupplemental.
References
- 1.Shaw JE, Sicree RA, Zimmet PZ: Global estimates of the prevalence of diabetes for 2010 and 2030. Diabetes Res Clin Pract 87: 4–14, 2010 [DOI] [PubMed] [Google Scholar]
- 2.Danaei G, Finucane MM, Lu Y, Singh GM, Cowan MJ, Paciorek CJ, et al.; Global Burden of Metabolic Risk Factors of Chronic Diseases Collaborating Group (Blood Glucose) : National, regional, and global trends in fasting plasma glucose and diabetes prevalence since 1980: Systematic analysis of health examination surveys and epidemiological studies with 370 country-years and 2·7 million participants. Lancet 378: 31–40, 2011 [DOI] [PubMed] [Google Scholar]
- 3.Forbes JM, Cooper ME: Mechanisms of diabetic complications. Physiol Rev 93: 137–188, 2013 [DOI] [PubMed] [Google Scholar]
- 4.Thomas MC, Brownlee M, Susztak K, Sharma K, Jandeleit-Dahm KA, Zoungas S, et al.: Diabetic kidney disease. Nat Rev Dis Primers 1: 15018, 2015 [DOI] [PMC free article] [PubMed] [Google Scholar]
- 5.Reidy K, Kang HM, Hostetter T, Susztak K: Molecular mechanisms of diabetic kidney disease. J Clin Invest 124: 2333–2340, 2014 [DOI] [PMC free article] [PubMed] [Google Scholar]
- 6.Pradhan AD, Manson JE, Rifai N, Buring JE, Ridker PM: C-reactive protein, interleukin 6, and risk of developing type 2 diabetes mellitus. JAMA 286: 327–334, 2001 [DOI] [PubMed] [Google Scholar]
- 7.Hu FB, Meigs JB, Li TY, Rifai N, Manson JE: Inflammatory markers and risk of developing type 2 diabetes in women. Diabetes 53: 693–700, 2004 [DOI] [PubMed] [Google Scholar]
- 8.Vozarova B, Weyer C, Lindsay RS, Pratley RE, Bogardus C, Tataranni PA: High white blood cell count is associated with a worsening of insulin sensitivity and predicts the development of type 2 diabetes. Diabetes 51: 455–461, 2002 [DOI] [PubMed] [Google Scholar]
- 9.Spranger J, Kroke A, Möhlig M, Hoffmann K, Bergmann MM, Ristow M, et al.: Inflammatory cytokines and the risk to develop type 2 diabetes: Results of the prospective population-based European Prospective Investigation into Cancer and Nutrition (EPIC)-Potsdam Study. Diabetes 52: 812–817, 2003 [DOI] [PubMed] [Google Scholar]
- 10.Alexandraki KI, Piperi C, Ziakas PD, Apostolopoulos NV, Makrilakis K, Syriou V, et al.: Cytokine secretion in long-standing diabetes mellitus type 1 and 2: Associations with low-grade systemic inflammation. J Clin Immunol 28: 314–321, 2008 [DOI] [PubMed] [Google Scholar]
- 11.Kolb H, Mandrup-Poulsen T: The global diabetes epidemic as a consequence of lifestyle-induced low-grade inflammation. Diabetologia 53: 10–20, 2010 [DOI] [PubMed] [Google Scholar]
- 12.Serhan CN, Yacoubian S, Yang R: Anti-inflammatory and proresolving lipid mediators. Annu Rev Pathol 3: 279–312, 2008 [DOI] [PMC free article] [PubMed] [Google Scholar]
- 13.Maderna P, Godson C: Lipoxins: Resolutionary road. Br J Pharmacol 158: 947–959, 2009 [DOI] [PMC free article] [PubMed] [Google Scholar]
- 14.Neuhofer A, Zeyda M, Mascher D, Itariu BK, Murano I, Leitner L, et al.: Impaired local production of proresolving lipid mediators in obesity and 17-HDHA as a potential treatment for obesity-associated inflammation. Diabetes 62: 1945–1956, 2013 [DOI] [PMC free article] [PubMed] [Google Scholar]
- 15.Fredman G, Hellmann J, Proto JD, Kuriakose G, Colas RA, Dorweiler B, et al.: An imbalance between specialized pro-resolving lipid mediators and pro-inflammatory leukotrienes promotes instability of atherosclerotic plaques. Nat Commun 7: 12859, 2016 [DOI] [PMC free article] [PubMed] [Google Scholar]
- 16.Serhan CN: Pro-resolving lipid mediators are leads for resolution physiology. Nature 510: 92–101, 2014 [DOI] [PMC free article] [PubMed] [Google Scholar]
- 17.Serhan CN, Chiang N, Dalli J, Levy BD: Lipid mediators in the resolution of inflammation. Cold Spring Harb Perspect Biol 7: a016311, 2014 [DOI] [PMC free article] [PubMed] [Google Scholar]
- 18.Serhan CN, Chiang N, Van Dyke TE: Resolving inflammation: Dual anti-inflammatory and pro-resolution lipid mediators. Nat Rev Immunol 8: 349–361, 2008 [DOI] [PMC free article] [PubMed] [Google Scholar]
- 19.Serhan CN, Hamberg M, Samuelsson B: Lipoxins: Novel series of biologically active compounds formed from arachidonic acid in human leukocytes. Proc Natl Acad Sci U S A 81: 5335–5339, 1984 [DOI] [PMC free article] [PubMed] [Google Scholar]
- 20.Spite M, Clària J, Serhan CN: Resolvins, specialized proresolving lipid mediators, and their potential roles in metabolic diseases. Cell Metab 19: 21–36, 2014 [DOI] [PMC free article] [PubMed] [Google Scholar]
- 21.Dalli J, Zhu M, Vlasenko NA, Deng B, Haeggström JZ, Petasis NA, et al.: The novel 13S,14S-epoxy-maresin is converted by human macrophages to maresin 1 (MaR1), inhibits leukotriene A4 hydrolase (LTA4H), and shifts macrophage phenotype. FASEB J 27: 2573–2583, 2013 [DOI] [PMC free article] [PubMed] [Google Scholar]
- 22.Basil MC, Levy BD: Specialized pro-resolving mediators: Endogenous regulators of infection and inflammation. Nat Rev Immunol 16: 51–67, 2016 [DOI] [PMC free article] [PubMed] [Google Scholar]
- 23.Serhan CN: Treating inflammation and infection in the 21st century: New hints from decoding resolution mediators and mechanisms. FASEB J 31: 1273–1288, 2017 [DOI] [PMC free article] [PubMed] [Google Scholar]
- 24.Tabas I, García-Cardeña G, Owens GK: Recent insights into the cellular biology of atherosclerosis. J Cell Biol 209: 13–22, 2015 [DOI] [PMC free article] [PubMed] [Google Scholar]
- 25.Tabas I, Glass CK: Anti-inflammatory therapy in chronic disease: Challenges and opportunities. Science 339: 166–172, 2013 [DOI] [PMC free article] [PubMed] [Google Scholar]
- 26.Brennan EP, Cacace A, Godson C: Specialized pro-resolving mediators in renal fibrosis. Mol Aspects Med 58: 102–113, 2017 [DOI] [PubMed] [Google Scholar]
- 27.Fiore S, Maddox JF, Perez HD, Serhan CN: Identification of a human cDNA encoding a functional high affinity lipoxin A4 receptor. J Exp Med 180: 253–260, 1994 [DOI] [PMC free article] [PubMed] [Google Scholar]
- 28.Lassila M, Jandeleit-Dahm K, Seah KK, Smith CM, Calkin AC, Allen TJ, et al.: Imatinib attenuates diabetic nephropathy in apolipoprotein E-knockout mice. J Am Soc Nephrol 16: 363–373, 2005 [DOI] [PubMed] [Google Scholar]
- 29.Lassila M, Seah KK, Allen TJ, Thallas V, Thomas MC, Candido R, et al.: Accelerated nephropathy in diabetic apolipoprotein e-knockout mouse: Role of advanced glycation end products. J Am Soc Nephrol 15: 2125–2138, 2004 [DOI] [PubMed] [Google Scholar]
- 30.Chew P, Yuen DY, Stefanovic N, Pete J, Coughlan MT, Jandeleit-Dahm KA, et al.: Antiatherosclerotic and renoprotective effects of ebselen in the diabetic apolipoprotein E/GPx1-double knockout mouse. Diabetes 59: 3198–3207, 2010 [DOI] [PMC free article] [PubMed] [Google Scholar]
- 31.Jha JC, Gray SP, Barit D, Okabe J, El-Osta A, Namikoshi T, et al.: Genetic targeting or pharmacologic inhibition of NADPH oxidase nox4 provides renoprotection in long-term diabetic nephropathy. J Am Soc Nephrol 25: 1237–1254, 2014 [DOI] [PMC free article] [PubMed] [Google Scholar]
- 32.Jha JC, Thallas-Bonke V, Banal C, Gray SP, Chow BS, Ramm G, et al.: Podocyte-specific Nox4 deletion affords renoprotection in a mouse model of diabetic nephropathy. Diabetologia 59: 379–389, 2016 [DOI] [PMC free article] [PubMed] [Google Scholar]
- 33.Koulis C, Chow BS, McKelvey M, Steckelings UM, Unger T, Thallas-Bonke V, et al.: AT2R agonist, compound 21, is reno-protective against type 1 diabetic nephropathy. Hypertension 65: 1073–1081, 2015 [DOI] [PubMed] [Google Scholar]
- 34.Thallas-Bonke V, Jha JC, Gray SP, Barit D, Haller H, Schmidt HH, et al.: Nox-4 deletion reduces oxidative stress and injury by PKC-α-associated mechanisms in diabetic nephropathy. Physiol Rep 2, e12192, 2014 [DOI] [PMC free article] [PubMed] [Google Scholar]
- 35.Watson AM, Gray SP, Jiaze L, Soro-Paavonen A, Wong B, Cooper ME, et al.: Alagebrium reduces glomerular fibrogenesis and inflammation beyond preventing RAGE activation in diabetic apolipoprotein E knockout mice. Diabetes 61: 2105–2113, 2012 [DOI] [PMC free article] [PubMed] [Google Scholar]
- 36.Watson AM, Li J, Schumacher C, de Gasparo M, Feng B, Thomas MC, et al.: The endothelin receptor antagonist avosentan ameliorates nephropathy and atherosclerosis in diabetic apolipoprotein E knockout mice. Diabetologia 53: 192–203, 2010 [DOI] [PubMed] [Google Scholar]
- 37.Börgeson E, Docherty NG, Murphy M, Rodgers K, Ryan A, O’Sullivan TP, et al.: Lipoxin A4 and benzo-lipoxin A4 attenuate experimental renal fibrosis. FASEB J 25: 2967–2979, 2011 [DOI] [PubMed] [Google Scholar]
- 38.Dolan V, Murphy M, Sadlier D, Lappin D, Doran P, Godson C, et al.: Expression of gremlin, a bone morphogenetic protein antagonist, in human diabetic nephropathy. Am J Kidney Dis 45: 1034–1039, 2005 [DOI] [PubMed] [Google Scholar]
- 39.McMahon R, Murphy M, Clarkson M, Taal M, Mackenzie HS, Godson C, et al.: IHG-2, a mesangial cell gene induced by high glucose, is human gremlin. Regulation by extracellular glucose concentration, cyclic mechanical strain, and transforming growth factor-beta1. J Biol Chem 275: 9901–9904, 2000 [DOI] [PubMed] [Google Scholar]
- 40.Lindenmeyer MT, Eichinger F, Sen K, Anders HJ, Edenhofer I, Mattinzoli D, et al.: Systematic analysis of a novel human renal glomerulus-enriched gene expression dataset. PLoS One 5: e11545, 2010 [DOI] [PMC free article] [PubMed] [Google Scholar]
- 41.Lee JW, Chou CL, Knepper MA: Deep sequencing in microdissected renal tubules identifies nephron segment-specific transcriptomes. J Am Soc Nephrol 26: 2669–2677, 2015 [DOI] [PMC free article] [PubMed] [Google Scholar]
- 42.Ju W, Nair V, Smith S, Zhu L, Shedden K, Song PXK, et al.; ERCB, C-PROBE, NEPTUNE, and PKU-IgAN Consortium : Tissue transcriptome-driven identification of epidermal growth factor as a chronic kidney disease biomarker. Sci Transl Med 7: 316ra193, 2015 [DOI] [PMC free article] [PubMed] [Google Scholar]
- 43.Brennan EP, Nolan KA, Börgeson E, Gough OS, McEvoy CM, Docherty NG, et al.; GENIE Consortium : Lipoxins attenuate renal fibrosis by inducing let-7c and suppressing TGFβR1. J Am Soc Nephrol 24: 627–637, 2013 [DOI] [PMC free article] [PubMed] [Google Scholar]
- 44.Wang B, Jha JC, Hagiwara S, McClelland AD, Jandeleit-Dahm K, Thomas MC, et al.: Transforming growth factor-β1-mediated renal fibrosis is dependent on the regulation of transforming growth factor receptor 1 expression by let-7b. Kidney Int 85: 352–361, 2014 [DOI] [PubMed] [Google Scholar]
- 45.Brennan E, Wang B, McClelland A, Mohan M, Marai M, Beuscart O, et al.: Protective effect of let-7 miRNA family in regulating inflammation in diabetes-associated atherosclerosis. Diabetes 66: 2266–2277, 2017 [DOI] [PubMed] [Google Scholar]
- 46.Ho LC, Sung JM, Shen YT, Jheng HF, Chen SH, Tsai PJ, et al.: Egr-1 deficiency protects from renal inflammation and fibrosis. J Mol Med (Berl) 94: 933–942, 2016 [DOI] [PubMed] [Google Scholar]
- 47.Hodgin JB, Nair V, Zhang H, Randolph A, Harris RC, Nelson RG, et al.: Identification of cross-species shared transcriptional networks of diabetic nephropathy in human and mouse glomeruli. Diabetes 62: 299–308, 2013 [DOI] [PMC free article] [PubMed] [Google Scholar]
- 48.Lin CY, Lin TY, Lee MC, Chen SC, Chang JS: Hyperglycemia: GDNF-EGR1 pathway target renal epithelial cell migration and apoptosis in diabetic renal embryopathy. PLoS One 8: e56731, 2013 [DOI] [PMC free article] [PubMed] [Google Scholar]
- 49.Sun S, Ning X, Zhai Y, Du R, Lu Y, He L, et al.: Egr-1 mediates chronic hypoxia-induced renal interstitial fibrosis via the PKC/ERK pathway. Am J Nephrol 39: 436–448, 2014 [DOI] [PubMed] [Google Scholar]
- 50.Brennan EP, Morine MJ, Walsh DW, Roxburgh SA, Lindenmeyer MT, Brazil DP, et al.; GENIE Consortium : Next-generation sequencing identifies TGF-β1-associated gene expression profiles in renal epithelial cells reiterated in human diabetic nephropathy. Biochim Biophys Acta 1822: 589–599, 2012 [DOI] [PMC free article] [PubMed] [Google Scholar]
- 51.Baron V, Adamson ED, Calogero A, Ragona G, Mercola D: The transcription factor Egr1 is a direct regulator of multiple tumor suppressors including TGFbeta1, PTEN, p53, and fibronectin. Cancer Gene Ther 13: 115–124, 2006 [DOI] [PMC free article] [PubMed] [Google Scholar]
- 52.Chen SJ, Ning H, Ishida W, Sodin-Semrl S, Takagawa S, Mori Y, et al.: The early-immediate gene EGR-1 is induced by transforming growth factor-beta and mediates stimulation of collagen gene expression. J Biol Chem 281: 21183–21197, 2006 [DOI] [PubMed] [Google Scholar]
- 53.Börgeson E, Johnson AM, Lee YS, Till A, Syed GH, Ali-Shah ST, et al.: Lipoxin A4 attenuates obesity-induced adipose inflammation and associated liver and kidney disease. Cell Metab 22: 125–137, 2015 [DOI] [PMC free article] [PubMed] [Google Scholar]
- 54.Giunti S, Calkin AC, Forbes JM, Allen TJ, Thomas MC, Cooper ME, et al.: The pleiotropic actions of rosuvastatin confer renal benefits in the diabetic Apo-E knockout mouse. Am J Physiol Renal Physiol 299: F528–F535, 2010 [DOI] [PubMed] [Google Scholar]
- 55.Gray SP, Di Marco E, Kennedy K, Chew P, Okabe J, El-Osta A, et al.: Reactive oxygen species can provide atheroprotection via NOX4-dependent inhibition of inflammation and vascular remodeling. Arterioscler Thromb Vasc Biol 36: 295–307, 2016 [DOI] [PubMed] [Google Scholar]
- 56.Watson AM, Olukman M, Koulis C, Tu Y, Samijono D, Yuen D, et al.: Urotensin II receptor antagonism confers vasoprotective effects in diabetes associated atherosclerosis: Studies in humans and in a mouse model of diabetes. Diabetologia 56: 1155–1165, 2013 [DOI] [PubMed] [Google Scholar]
- 57.Betz B, Conway BR: An update on the use of animal models in diabetic nephropathy research. Curr Diab Rep 16: 18, 2016 [DOI] [PMC free article] [PubMed] [Google Scholar]
- 58.Azushima K, Gurley SB, Coffman TM: Modelling diabetic nephropathy in mice. Nat Rev Nephrol 14: 48–56, 2018 [DOI] [PubMed] [Google Scholar]
- 59.Alpers CE, Hudkins KL: Mouse models of diabetic nephropathy. Curr Opin Nephrol Hypertens 20: 278–284, 2011 [DOI] [PMC free article] [PubMed] [Google Scholar]
- 60.Brosius FC 3rd, Alpers CE, Bottinger EP, Breyer MD, Coffman TM, Gurley SB, et al.; Animal Models of Diabetic Complications Consortium : Mouse models of diabetic nephropathy. J Am Soc Nephrol 20: 2503–2512, 2009 [DOI] [PMC free article] [PubMed] [Google Scholar]
- 61.McMahon B, Mitchell D, Shattock R, Martin F, Brady HR, Godson C: Lipoxin, leukotriene, and PDGF receptors cross-talk to regulate mesangial cell proliferation. FASEB J 16: 1817–1819, 2002 [DOI] [PubMed] [Google Scholar]
- 62.Bahrami S, Drabløs F: Gene regulation in the immediate-early response process. Adv Biol Regul 62: 37–49, 2016 [DOI] [PubMed] [Google Scholar]
- 63.McMahon B, Stenson C, McPhillips F, Fanning A, Brady HR, Godson C: Lipoxin A4 antagonizes the mitogenic effects of leukotriene D4 in human renal mesangial cells. Differential activation of MAP kinases through distinct receptors. J Biol Chem 275: 27566–27575, 2000 [DOI] [PubMed] [Google Scholar]
- 64.Khachigian LM, Collins T: Inducible expression of Egr-1-dependent genes. A paradigm of transcriptional activation in vascular endothelium. Circ Res 81: 457–461, 1997 [DOI] [PubMed] [Google Scholar]
- 65.Ramasamy R, Yan SF, Schmidt AM: Receptor for AGE (RAGE): Signaling mechanisms in the pathogenesis of diabetes and its complications. Ann N Y Acad Sci 1243: 88–102, 2011 [DOI] [PMC free article] [PubMed] [Google Scholar]
- 66.Xu Y, Toure F, Qu W, Lin L, Song F, Shen X, et al.: Advanced glycation end product (AGE)-receptor for AGE (RAGE) signaling and up-regulation of Egr-1 in hypoxic macrophages. J Biol Chem 285: 23233–23240, 2010 [DOI] [PMC free article] [PubMed] [Google Scholar]
- 67.Rauber S, Luber M, Weber S, Maul L, Soare A, Wohlfahrt T, et al.: Resolution of inflammation by interleukin-9-producing type 2 innate lymphoid cells. Nat Med 23: 938–944, 2017 [DOI] [PMC free article] [PubMed] [Google Scholar]
Associated Data
This section collects any data citations, data availability statements, or supplementary materials included in this article.