Abstract
Background Hyperkalemia in association with metabolic acidosis that are out of proportion to changes in glomerular filtration rate defines type 4 renal tubular acidosis (RTA), the most common RTA observed, but the molecular mechanisms underlying the associated metabolic acidosis are incompletely understood. We sought to determine whether hyperkalemia directly causes metabolic acidosis and, if so, the mechanisms through which this occurs.
Methods We studied a genetic model of hyperkalemia that results from early distal convoluted tubule (DCT)–specific overexpression of constitutively active Ste20/SPS1-related proline-alanine–rich kinase (DCT-CA-SPAK).
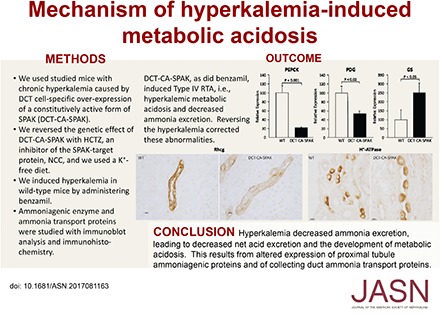
Results DCT-CA-SPAK mice developed hyperkalemia in association with metabolic acidosis and suppressed ammonia excretion; however, titratable acid excretion and urine pH were unchanged compared with those in wild-type mice. Abnormal ammonia excretion in DCT-CA-SPAK mice associated with decreased proximal tubule expression of the ammonia-generating enzymes phosphate-dependent glutaminase and phosphoenolpyruvate carboxykinase and overexpression of the ammonia-recycling enzyme glutamine synthetase. These mice also had decreased expression of the ammonia transporter family member Rhcg and decreased apical polarization of H+-ATPase in the inner stripe of the outer medullary collecting duct. Correcting the hyperkalemia by treatment with hydrochlorothiazide corrected the metabolic acidosis, increased ammonia excretion, and normalized ammoniagenic enzyme and Rhcg expression in DCT-CA-SPAK mice. In wild-type mice, induction of hyperkalemia by administration of the epithelial sodium channel blocker benzamil caused hyperkalemia and suppressed ammonia excretion.
Conclusions Hyperkalemia decreases proximal tubule ammonia generation and collecting duct ammonia transport, leading to impaired ammonia excretion that causes metabolic acidosis.
Keywords: renal tubular acidosis, chronic metabolic acidosis, proximal tubule, collecting ducts
Maintenance of acid-base homeostasis is critical for almost all aspects of normal health. Abnormal acid-base homeostasis, whether metabolic acidosis or metabolic alkalosis, is associated strongly with increased mortality.1–3 Metabolic acidosis is associated specifically with worsened control of hyperglycemia, increased risk of osteoporosis and skeletal bone disease, thyroid hormone dysfunction, skeletal muscle atrophy, increased risk of cardiac arrhythmia, decreased sensitivity to circulating catecholamines, and increased risk of progressive CKD leading to ESRD.4–6
When failure of the appropriate renal contribution to acid-base homeostasis causes metabolic acidosis, and cannot be attributed either to an adaptive response to a systemic disease or to decreased total renal function, this is termed renal tubular acidosis (RTA). Three major forms of RTA are known, type 1, also termed distal, RTA; type 2, or proximal, RTA; and type 4. Type 1 RTA results from failure of normal collecting duct–mediated urine acidification–bicarbonate reabsorption and type 2 RTA results from impaired proximal tubule (PT) reabsorption of filtered bicarbonate.7–9 In contrast, type 4 RTA, defined as the combination of hyperkalemia with hyperchloremic, nonanion gap metabolic acidosis that is not due to reduced glomerular filtration,10,11 is not due to a failure of bicarbonate transport, but instead is thought to primarily arise from abnormal ammonia excretion,10,12 although “aldosterone-resistance” and alterations in distal proton secretion have also been postulated.
At present, the cellular and molecular mechanisms underlying type 4 RTA are unclear. In part, this is because in vivo models of chronic hyperkalemia have involved either significant dietary KCl loads, with unclear effects due to the associated anion administration; disruption of normal adrenal hormone signaling; or the use of pharmacologic agents to block renal K+ excretion that may have secondary effects that alter collecting duct H+ and ammonia secretion. Kidneys possess potent potassium excretory mechanisms, such that oral potassium loading generally does not result in chronic hyperkalemia in the absence of reduced renal function, inhibition of normal adrenal function, or inhibition of potassium excretory mechanism.13–15
This study’s purpose was to determine the effects of chronic hyperkalemia on renal acid-base and ammonia metabolism. We used mice with early DCT-specific overexpression of a constitutively active form of the signaling protein, STE20/SPS1-related, proline alanine–rich kinase (SPAK), which we term DCT-CA-SPAK mice, which were shown by Grimm, Welling, and colleagues16 to have chronic hyperkalemia. SPAK is a terminal component of a signaling cascade that phosphorylates the thiazide-sensitive NaCl cotransporter, NCC.17,18 Constitutive activation of SPAK in early DCT cells causes chronic hyperkalemia through NCC activation, which decreases distal Na+ delivery and, through currently unknown mechanisms, decreases cortical collecting duct (CCD) epithelial sodium channel (ENaC) and ROMK expression.16 Thus, these mice enable study of the effects of chronic hyperkalemia. Our results show that hyperkalemia causes metabolic acidosis by impairing normal ammonia metabolism through effects involving both the PT and the collecting duct.
Methods
Animal Model
We used previously described DCT-CA-SPAK mice.16 All mice used were the result of mating heterozygous DCT-CA-SPAK sires with heterozygous dams. Mice were genotyped using tail clip DNA as detailed previously.16 All studies used either WT or homozygous KO littermates.
Study Approval
Animal studies were performed at the University of Maryland School of Medicine in adherence to the National Institutes of Health (NIH) Guide for the Care and Use of Laboratory Animals and were approved by the University of Maryland School of Medicine Institutional Animal Care and Use Committee.
Antibodies
All antibodies used have been described previously. Details as to their source are available in the Supplemental Material.
Dietary Manipulation
At approximately 7–8 weeks of age, all mice were switched from the house diet to a K-control diet (TD.88238 from Envigo Teklad Diets; Envigo, Inc.). The animals were acclimated to the control diet for at least 10 days before the beginning of the study. Mice were studied at 10–12 weeks of age.
The K-restricted diet contained no added K+, and had an estimated background K+ of 15–30 ppm (TD.88239, Envigo Teklad Diets; Envigo, Inc.). The K-restricted diet is matched in composition to the K-control diet except for K+ content.
Diuretic Administration
Pharmaceutic grade hydrochlorothiazide (HCTZ), bumetanide, and benzamil were purchased from Sigma. HCTZ and benzamil were dissolved in DMSO (Sigma) and bumetanide was dissolved in ethanol. When used, we administered daily intraperitoneal (ip) injections of dissolved HCTZ, bumetanide, or benzamil or a comparable volume of vehicle. Doses administered were: HCTZ, 12.5 mg/kg; bumetanide, 1.0 mg/kg; and benzamil, 4.3 mg/kg. Injections were given beginning at 4 pm to correspond with their active period.
Sample Collection, Preparation, and Analysis
After collecting blood on the final day, animals were anesthetized by ip injection with ketamine/xylazine (90 mg/kg of ketamine, 10 mg/kg of xylazine). Once an animal was unconscious, the left renal artery was ligated and the left kidney was removed, but the right kidney remained in place for subsequent fixation (see below). The cortex and medulla of the removed kidney were separated by free-hand dissection and flash frozen in liquid nitrogen. Before fixation, an additional blood sample was collected from the left artery. This fraction of blood was immediately spun down to separate formed elements and plasma; the latter was subsequently isolated and frozen for later analysis.
Sample Analysis
Blood chemistry (Na+, K+, Cl−, and HCO3−) was measured using a 100-µl aliquot of whole blood using an i-STAT EC8+ cartridge and an i-STAT1 Handheld Analyzer (Abaxis). Daily blood samples were collected from the facial vein using a Goldenrod 3 mm lancet to puncture the facial vein, alternating cheeks every day. After blood draws were performed, the animals were injected (ip) with 100 µl of sterile saline to prevent dehydration.
All urine studies used 24-hour collections obtained using metabolic cages. Urine pH was measured using an Orion PerpHecT Ross microelectrode (Thermo Scientific). Urine ammonia was measured using an Ammonia Assay Kit (A7553) from Pointe Scientific using modified methods described previously.19 Urinary titratable acid was measured using methods described previously.19 Urine creatinine levels were measured using the Mouse Creatinine Enzymatic Assay Kit (80350; Crystal Chem) following the manufacturer’s protocol. Urine aldosterone levels were assayed using the Aldosterone EIA Kit manufactured by Cayman Chemical.
Immunoblot analysis was performed using standard procedures we have detailed previously.20–22 Immunohistochemistry and quantitative immunohistochemistry also used standard procedures in our laboratory; complete methodologic details are available in the Supplemental Material. Each immunohistochemistry experiment included a section that was exposed to the immunolabeling procedure without the primary antibody to assure that the label was due to the primary antibody binding only.
Quantitative Immunohistochemistry
Phosphate-dependent glutaminase (PDG) immunoreactivity in the PT was quantified using previously described techniques.23 The specific PT segments measured were: the proximal convoluted tubule in the cortex and the proximal straight tubule in the outer stripe of the outer medulla. High-resolution digital micrographs were taken of randomly selected fields of the renal cortex and the outer stripe of the outer medulla using a Nikon E600 microscope equipped with a DXM1200F digital camera using ACT-1 software (Nikon) and no image enhancement techniques. With the use of Image J software (version 1.34j; NIH) individual PT segments expressing PDG immunolabel were identified and circumscribed. Immunolabel intensity within the PT segment was assessed as the integrated pixel intensity, after subtraction of background intensity, within the outlined area using custom-written software executed in Microsoft Excel 2010. A minimum of 15 individual PT segments from at least four micrographs were analyzed. Data from all PT segments examined of a given segment type were averaged to yield a single data point per animal for statistical analysis. The net pixel intensity was normalized such that the mean intensity in the same region (cortex or outer medulla) in WT tissue was 100.
Apical polarization of H+-ATPase immunolabel was determined using techniques described previously.24 Briefly, high-resolution, 36-megapixel, digital micrographs were taken of defined tubular segments using a Nikon E600 microscope equipped with a DXM1200F digital camera and ACT-1 software. Differential interference contrast optics and other image enhancement techniques were not used to avoid changes in pixel intensity other than due to H+-ATPase immunolabel. Freely available software (NIH ImageJ) quantified pixel intensity across a line drawn from the tubule lumen through the center of an individual cell. These data were then analyzed using custom-written software. Pixel intensity at each point of the line was displayed graphically. The apical and basolateral edges were identified as the point at which intensity diverged from baseline. Background pixel intensity was calculated as mean pixel intensity outside the cell regions and was subtracted from absolute pixel intensity at each point to yield net intensity. Total cellular expression was determined by integrating net pixel intensity through the entire cell. Immunolabel expression in the apical 1.5 µm of the cell was determined by integrating pixel intensity in this region. All imaging was done in the same session, using the same microscope settings, by a blinded observer, using fields selected in a random manner, and all comparisons were done on sections from the same IHC experiment. We have shown previously <5% variability in these measurements during repetitive analysis of a single cell.24
Statistical Analyses
Results are presented as mean±SEM. Statistical analysis of samples measured over several days was performed using ANOVA with SPSS (version 24; IBM SPSS Statistics) general linear model for repeated measures; statistical assessment of change of individual points from baseline used Bonferroni correction. Comparisons of specific day measurements between WT and KO samples used unpaired t test. We performed ANOVA of urine ammonia with plasma K+ and genotype using SPSS General Linear Model. Box plots were generated using IBM SPSS Statistics, version 24. In all analyses P<0.05 was considered statistically significant. N refers to the number of animals studied.
Results
Physiologic Data
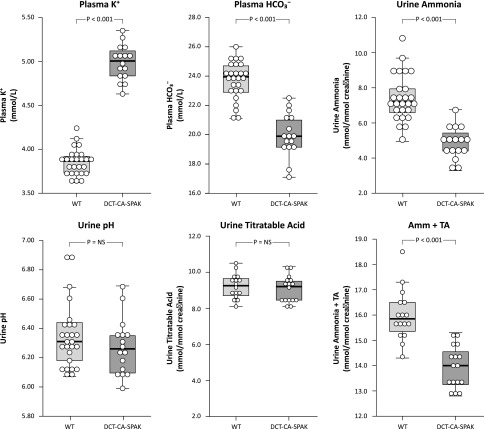
We first determined the effect of DCT-CA-SPAK on basal acid-base homeostasis and renal ammonia metabolism. Under basal conditions DCT-CA-SPAK mice exhibited a significantly higher plasma potassium than did WT mice (Figure 1, Table 1). Plasma bicarbonate was significantly lower, and Cl− was higher. Neither plasma Na+ nor anion gap were altered significantly. Thus, these mice exhibit the electrolyte findings characteristic of type 4 RTA.
Figure 1.
DCT-CA-SPAK mice exhibit characteristics of Type 4 RTA, i.e., hyperkalemia with metabolic acidosis and suppressed urinary ammonia excretion. Plasma electrolytes and urine studies were obtained in DCT-CA-SPAK and WT mice before any experimental therapy. n=16 for DCT-CA-SPAK mice and 26 for WT mice for measurements of plasma K+ and bicarbonate and urine ammonia and pH, and 16 for each genotype for measurement of urine titratable acid and sum of urine ammonia and titratable acid. Amm + TA, urine ammonia plus titratable acid; DCT-CA-SPAK, mice with early DCT-specific over-expression of constitutively active SPAK; WT, wild-type mice.
Table 1.
Plasma electrolytes in WT and DCT-CA-SPAK mice
| Plasma Electrolyte | WT (N) | DCT-CA-SPAK (N) | P Value |
|---|---|---|---|
| Na+ | 144.0±0.7 (12) | 145.8±0.5 (12) | NS |
| K+ | 3.85±0.03 (26) | 4.99±0.05 (16) | <0.001 |
| HCO3− | 23.7±0.2 (26) | 20.0±0.4 (16) | <0.001 |
| Cl− | 109.0±0.3 (22) | 115.3±0.5 (12) | <0.001 |
| Anion gap, mEq/L | 11.7±0.6 (22) | 10.6±0.8 (12) | NS |
Results are shown as mean±SEM. All results in millimoles per liter unless otherwise specified. WT, wild-type mice; DCT-CA-SPAK, mice with early DCT-specific over-expression of constitutively active SPAK.
The appropriate renal response to metabolic acidosis is increased ammonia excretion.25–27 In contrast, DCT-CA-SPAK mice excreted significantly less ammonia than did WT mice (Figure 1). Impaired ammonia excretion was not due to impaired urine acidification, because urine pH did not differ significantly. Titratable acid excretion, a second component of net acid excretion, did not differ significantly. The sum of urinary ammonia and titratable acid excretion was significantly less in DCT-CA-SPAK mice. Thus, hyperkalemic DCT-CA-SPAK mice have metabolic acidosis, as evidenced by hyperchloremia in association with decreased plasma bicarbonate, with suppressed ammonia excretion.
Urinary Aldosterone Excretion
Type 4 RTA in people is often associated with suppressed aldosterone production, which has been proposed to be a causative factor. In DCT-CA-SPAK mice, urinary aldosterone was greater than in WT mice (DCT-CA-SPAK, 20.2±0.8 pmol/d; WT, 16.5±0.4 pmol/d; P<0.002, n=6 in each group). Thus, at least in DCT-CA-SPAK mice, hyperkalemia, metabolic acidosis, and suppressed ammonia excretion cannot be ascribed to aldosterone deficiency.
Response of Proteins Involved in PT Ammonia Generation
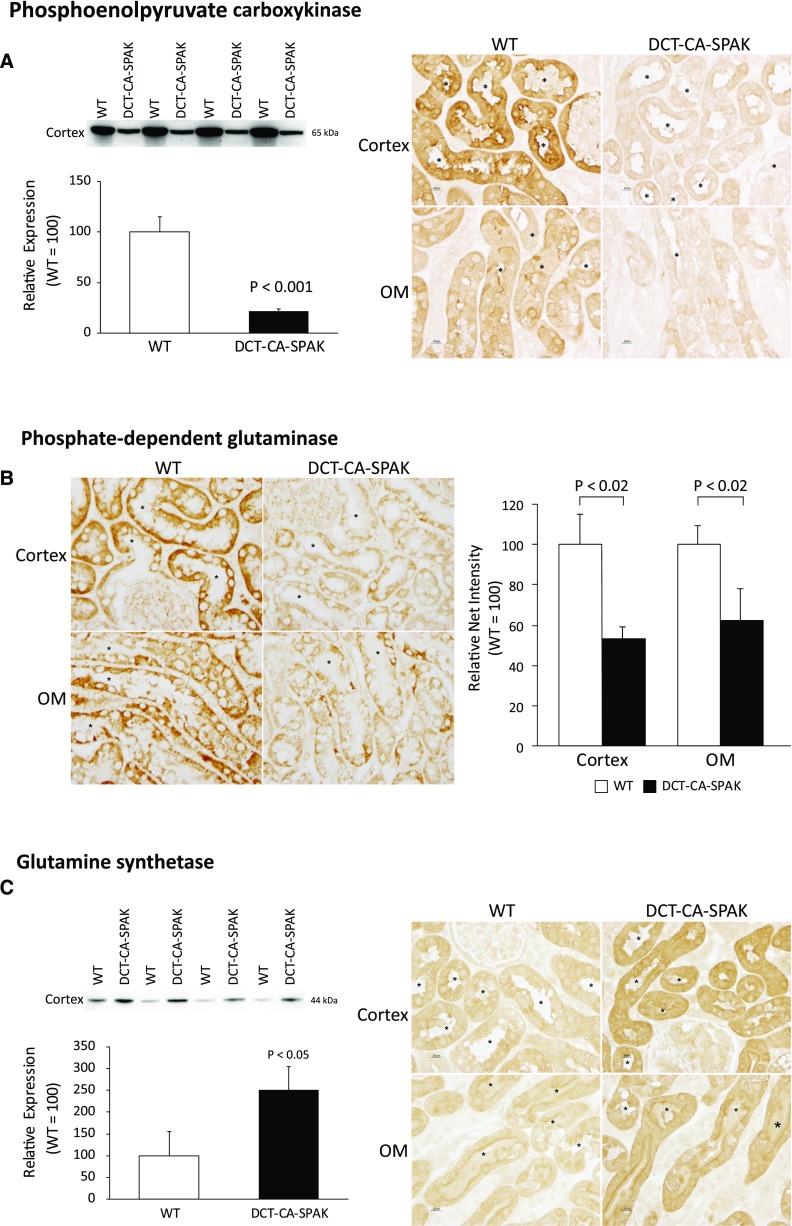
Decreased ammonia excretion in DCT-CA-SPAK mice could result from changes in ammonia generation or transport. Our initial studies evaluating these mechanisms determined DCT-CA-SPAK’s effects on expression of proteins involved in ammoniagenesis. Ammoniagenesis involves a number of proteins, with two having a central role—PDG and phosphoenolpyruvate carboxykinase (PEPCK). Both are normally induced by metabolic acidosis.25,26,28,29
We first examined PEPCK expression. Immunoblot analysis showed DCT-CA-SPAK significantly decreased expression (Figure 2A). Immunohistochemistry showed that immunolabel intensity was substantially less in DCT-CA-SPAK than in WT mice. Thus, PT PEPCK expression is decreased by DCT-CA-SPAK.
Figure 2.
DCT-CA-SPAK results in decreased expression of the ammoniageneic enzymes, PEPCK and PDG, and increased expression of the ammonia recycling protein, glutamine synthetase. Subfigure (A) shows effects on PEPCK. The left panel shows immunoblot analysis of PEPCK expression, with quantification, and the right panel shows immunohistochemistry findings. Subfigure (B) shows PDG expression. Left panel shows high-power micrographs of PDG immunolabel in the proximal convoluted tubule (top row), and proximal straight tubule in the outer stripe of outer medulla (bottom row) of WT (left column) and DCT-CA-SPAK (right column) kidney. Right panel shows quantitative immunohistochemistry findings. Subfigure (C) shows effects on GS expression. In all immunohistochemistry images * is used to label PT lumen and n=4 for each group. DCT-CA-SPAK, mice with early DCT-specific over-expression of constitutively active SPAK; OM, outer medulla; WT, wild-type mice.
Next, we examined PDG expression. Because PDG is widely expressed in renal epithelial cells (HW Lee, JW Verlander, and ID Weiner, unpublished observations) we used immunohistochemistry to assess its PT expression. Immunohistochemistry demonstrated that DCT-CA-SPAK decreased PDG immunolabel intensity throughout the PT (Figure 2B). Quantitative immunohistochemistry showed significantly less PT PDG immunolabel in DCT-CA-SPAK mice than in WT mice (Figure 2B). Thus, hyperkalemic DCT-CA-SPAK mice have decreased expression of key ammonia generation enzymes.
Effect of DCT-CA-SPAK on PT Ammonia Recycling
In addition to generating ammonia, the PT also has an ammonia-recycling process, mediated by glutamine synthetase (GS), which decreases net ammoniagenesis.21,30 In contrast to the expected effect of metabolic acidosis to decrease GS expression, GS expression was greater in DCT-CA-SPAK mice than in WT mice (Figure 2C). Immunohistochemistry demonstrated increased GS immunolabel throughout the PT of the DCT-CA-SPAK mouse. This increased GS expression contributes to increased ammonia recycling, which in turn decreases net ammonia generation.
Effect of DCT-CA-SPAK on NBCe1
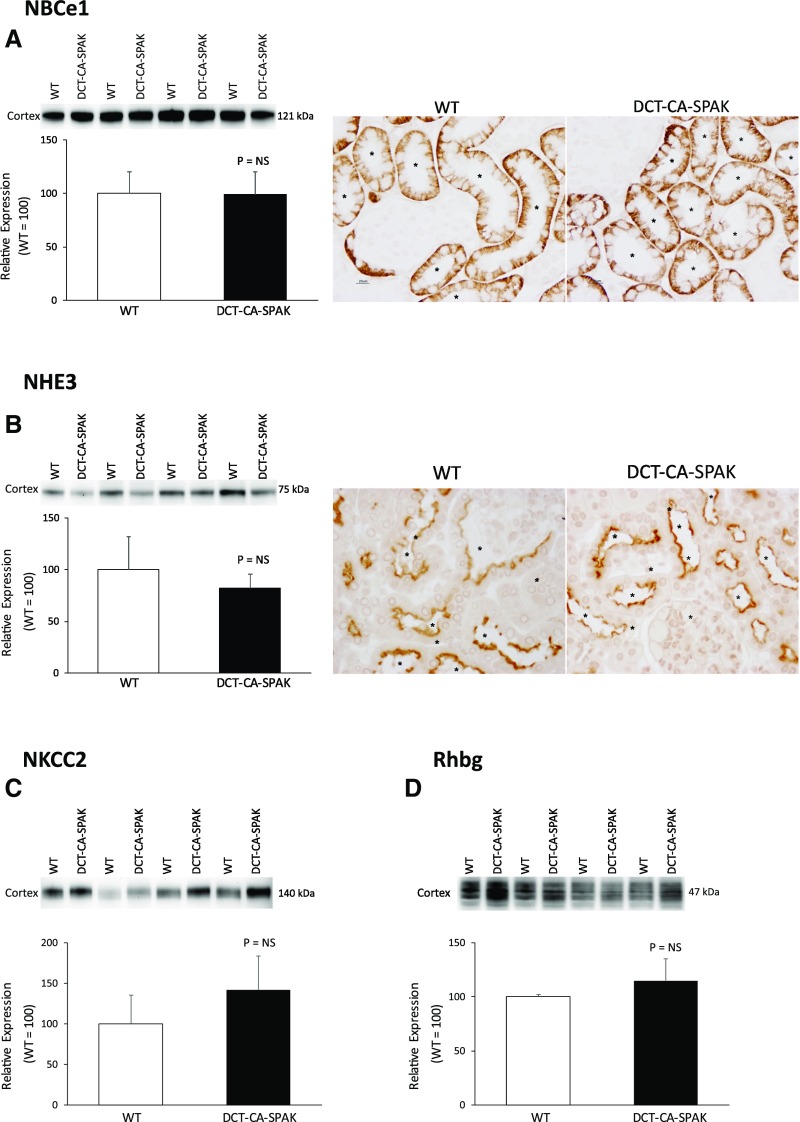
The finding of abnormal PT ammoniagenic enzyme expression raises the question as to whether signaling proteins that regulate PT function are abnormally expressed. We recently identified that NBCe1 (SLC4A4) regulates PT ammonia metabolism.31 DCT-CA-SPAK did not significantly alter NBCe1 expression compared with WT mice (Figure 3A). Thus, suppressed PT ammonia generation does not result from suppressed NBCe1 expression.
Figure 3.
DCT-CA-SPAK does not alter expression of the ammonia signaling protein, NBCe1, or the ammonia transport proteins, NHE3, NKCC2 or Rhbg. Subfigure (A) shows effects on NBCe1 expression. Subfigure (B) shows effects on NHE3 expression. Left panel shows immunoblot analysis showing no significant difference in NHE3 expression and right panel shows immunolabel expression. Subfigure (C) shows NKCC2 expression by immunoblot analysis. Subfigure (D) shows Rhbg expression by immunoblot analysis. n=4 for each group in all subfigures. *PT segments. DCT-CA-SPAK, mice with early DCT-specific over-expression of constitutively active SPAK; WT, wild-type mice.
Effect of DCT-CA-SPAK on Proteins Involved in Ammonia Transport
Ammonia excretion requires coordinated NH3 and NH4+ transport by specific membrane proteins in specific cells.28,32,33 Therefore, we next examined expression of the primary ammonia transporters in the PT, thick ascending limb of the loop of Henle (TAL), and the collecting duct.
Ammonia generated in the PT undergoes preferential secretion into the luminal fluid involving NHE3 and then is reabsorbed by the TAL, leading to medullary accumulation.28,29,34 NHE3 expression, examined using both immunoblot analysis and immunohistochemistry, did not differ significantly between DCT-CA-SPAK and WT mice (Figure 3B). Similarly, the expression of NKCC2, which mediates TAL ammonia reabsorption, did not differ between DCT-CA-SPAK and WT mice (Figure 3C). Thus, impaired ammonia excretion in hyperkalemic DCT-CA-SPAK mice is not associated with abnormal NHE3 or NKCC2 expression.
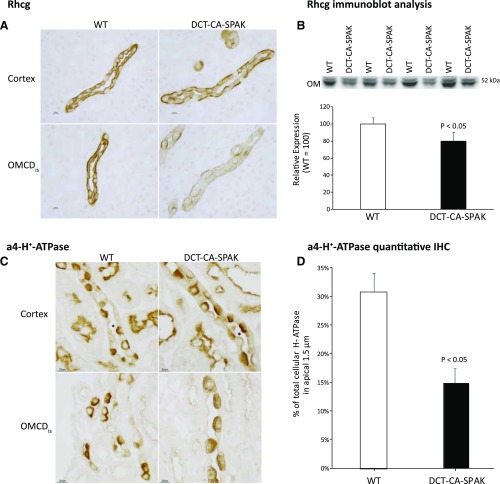
The collecting duct secretes 60%–80% of urinary ammonia32,35,36 and the Rhesus glycoproteins Rhbg and Rhcg are the primary proteins that mediate this secretion.28,33,37 Rhbg protein expression did not differ significantly between DCT-CA-SPAK and WT mice (Figure 3D). However, Rhcg expression was significantly decreased. DCT-CA-SPAK mice exhibited decreased apical and basolateral Rhcg immunolabel in both intercalated and principal cells in the inner stripe of the outer medullary collecting duct (OMCDis) (Figure 4A). Immunoblot analysis also showed decreased Rhcg expression in the inner stripe in the outer medulla (Figure 4B). There was no detectable change in Rhcg expression in the connecting segment, CCD, or inner medullary collecting duct. Impaired Rhcg-mediated OMCDis ammonia transport may contribute to the decreased ammonia excretion in hyperkalemic DCT-CA-SPAK mice.
Figure 4.
DCT-CA-SPAK decreases Rhcg expression and H-ATPase apical polarization in the inner stripe of the outer medulla. Subfigure (A) shows high-power micrographs of Rhcg immunolabel in the CCD (top row), and OMCDis (bottom row) of WT (left column) and DCT-CA-SPAK (right column) kidney. Subfigure (B) shows Rhcg expression by immunoblot analysis. Subfigure (C) shows high-power micrographs of a4-H+-ATPase immunolabel in the CCD (top row), and OMCDis (bottom row) of WT (left column) and DCT-CA-SPAK (right column) kidney. Subfigure (D) shows quantification of the percent of total cellular a4-H+-ATPase in the apical 1.5 µm of intercalated cells in the OMCDis of WT and DCT-CA-SPAK mice. n=4 in each group in all subfigures. *CCD segments. DCT-CA-SPAK, mice with early DCT-specific over-expression of constitutively active SPAK; IHC, immunohistochemistry; WT, wild-type mice.
Effect of DCT-CA-SPAK on a4 Subunit of H+-ATPase Expression
Collecting duct ammonia secretion involves parallel H+ and NH3 secretion. Immunohistochemistry showed that apical H+-ATPase polarization in OMCDis intercalated cells was less in DCT-CA-SPAK mice than in WT mice (Figure 4C). Quantitative immunohistochemistry, a technique we have validated previously,24 showed a significant decrease in apical H+-ATPase polarization (Figure 4D). H+-ATPase expression is generally not regulated by changes in protein abundance,38,39 and immunoblot analysis showed no change in protein expression between WT and DCT-CA-SPAK mice (data not shown). In the CCD there was no detectable change in H+-ATPase immunolabel. Thus, there is a parallel change in Rhcg and H+-ATPase immunolabel in the OMCDis in hyperkalemic DCT-CA-SPAK mice.
Effect of Thiazide Diuretic Administration
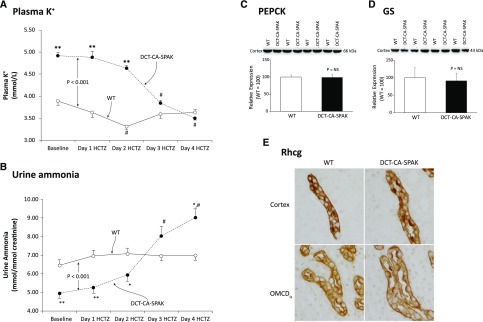
These effects of DCT-CA-SPAK on the PT and the OMCDis could reflect either their response to hyperkalemia or unexpected genetic changes in these cells. To differentiate between these possibilities, we administered HCTZ to DCT-CA-SPAK and WT mice. HCTZ inhibits NCC, which is expressed only in the DCT and is the target protein of SPAK.16 HCTZ rapidly corrected the hyperkalemia in DCT-CA-SPAK mice, and had only a minimal effect on plasma potassium in WT mice (Figure 5A). In parallel with these changes in plasma potassium, HCTZ did not alter ammonia excretion significantly in WT mice (Figure 5B), consistent with NCC not having a direct role in ammonia metabolism. In contrast, in DCT-CA-SPAK mice HCTZ significantly increased ammonia excretion (P<0.001 by ANOVA). Thus, abnormal ammonia excretion in DCT-CA-SPAK mice is correctable when the hyperkalemia is corrected with NCC inhibition.
Figure 5.
HCTZ administration reverses the effects of DCT-CA-SPAK on plasma K, urine ammonia, and expression of PEPCK, GS and Rhcg. Subfigure (A) shows effects of HCTZ on plasma K+. Subfigure (B) shows urinary ammonia excretion on each of 4 days of HCTZ administration. #P<0.01 versus baseline; *P<0.05 versus WT; **P<0.01 versus WT. n=6 in each genotype. Subfigure (C) shows there was no significant difference in PEPCK expression between HCTZ-treated WT and DCT-CA-SPAK mice. Subfigure (D) shows there was no significant difference in GS expression between HCTZ-treated WT and DCT-CA-SPAK mice. Subfigure (E) shows the absence of detectable differences in Rhcg immunolabel in the CCD (top row) and collecting duct in the inner stripe of the outer medulla (bottom row) of HCTZ-treated WT (left column) and DCT-CA-SPAK (right column) kidney. n=4 for each group. DCT-CA-SPAK, mice with early DCT-specific over-expression of constitutively active SPAK; WT, wild-type mice.
Effect of HCTZ on Ammoniagenic Enzyme Expression
We next determined whether correcting the hyperkalemia with HCTZ would correct the abnormal expression of PEPCK, as a representative of PT ammonia generation, and GS, as a representative of ammonia recycling. In HCTZ-treated mice, neither PEPCK nor GS expression differed significantly between WT and DCT-CA-SPAK mice (Figure 5, C and D). Rhcg immunolabel expression in the OMCDis was also normalized (Figure 5E). Thus, correcting the hyperkalemia present in DCT-CA-SPAK mice with HCTZ corrects the abnormal expression of key proteins in ammonia metabolism.
Effect of Low K+ Diet
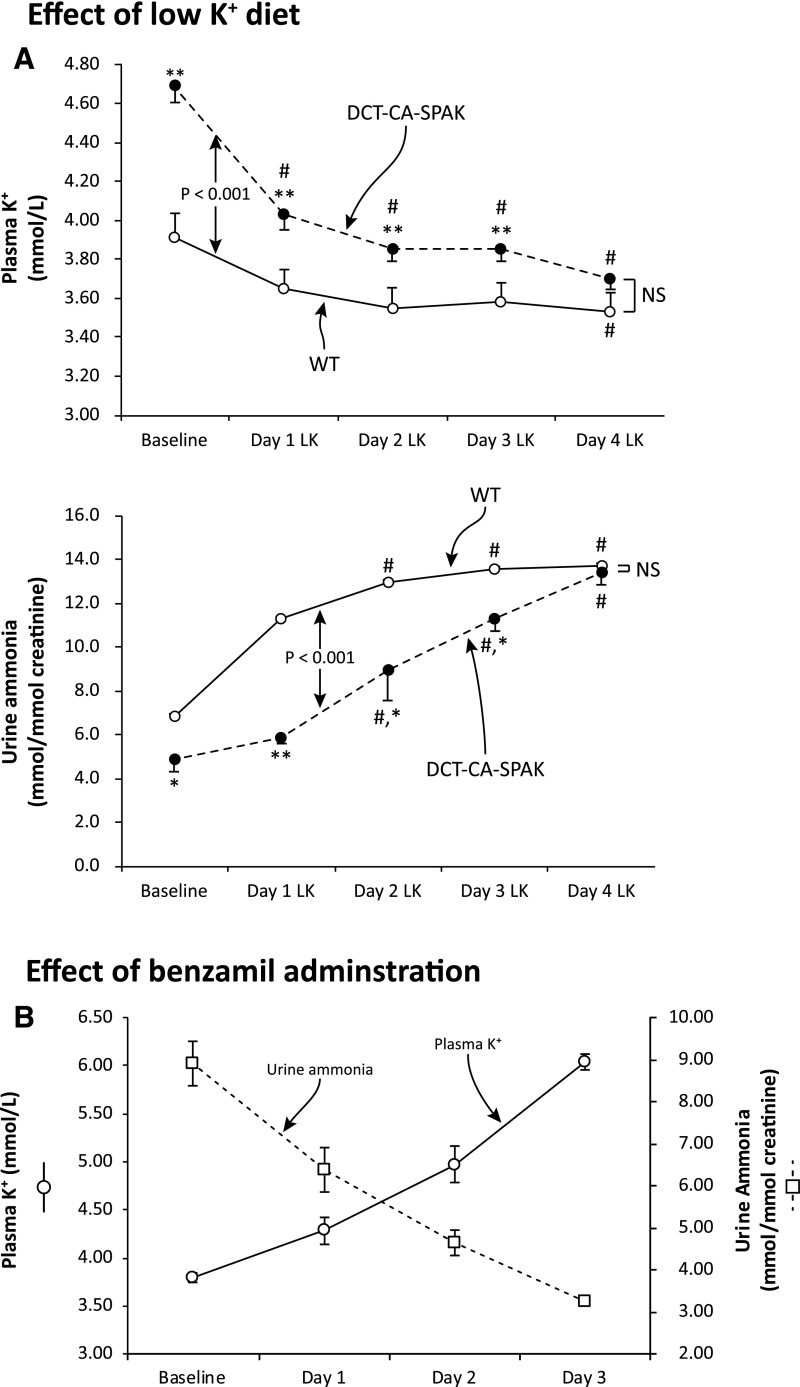
We then determined the effect of a second approach to correct the hyperkalemia in DCT-CA-SPAK mice, administering a low potassium diet. This decreased plasma potassium in both genotypes, and corrected the hyperkalemia present in DCT-CA-SPAK mice (Figure 6A). Urinary ammonia excretion increased in both genotypes, but the increase was significantly larger in DCT-CA-SPAK mice. After 4 days, when plasma potassium did not differ, ammonia excretion did not differ significantly between the two genotypes. Thus, correcting the hyperkalemia in DCT-CA-SPAK mice with either HCTZ or potassium restriction corrects the abnormal ammonia excretion.
Figure 6.
Correcting hyperkalemia in DCT-CA-SPAK mice with a low K diet corrects differences in ammonia excretion and inducing hyperkalemia in WT mice, with the ENaC inhibitor, benzamil, decreases urine ammonia excretion. Subfigure (A) shows the effect of K+-restricted diet on plasma K+ and on urinary ammonia excretion. #P<0.01 versus baseline; *P<0.05 versus WT; **P<0.01 versus WT. n=6 in each genotype. Subfigure (B) shows that benzamil administration to wild-type mice progressively increased plasma K+ and decreased urinary ammonia excretion. n=5. DCT-CA-SPAK, mice with early DCT-specific over-expression of constitutively active SPAK; LK, low K diet; WT, wild-type mice.
Effect of Altered K+ Homeostasis in WT Mice
Lastly, we determined whether altered K+ homeostasis in wild-type mice, either hypokalemia or hyperkalemia, would alter ammonia excretion. We administered bumetanide to induce hypokalemia and we administered benzamil to generate hyperkalemia. Benzamil administration increased plasma K+ significantly (Figure 6B). Bumetanide administration, used to induce hypokalemia, had the opposite effect. Plasma K+ decreased significantly (pre, 3.75±0.04 mmol/L; after 4 days, 2.77±0.04; P<0.001) and ammonia excretion increased significantly (pre, 7.91±0.58 mmol/mmol creatinine; after 4 days, 21.28±1.01 mmol/mmol creatinine; P<0.001, n=5). Thus, in WT mice changes in plasma K+ induced changes in ammonia excretion.
Correlation of Plasma K+ with Urinary Ammonia
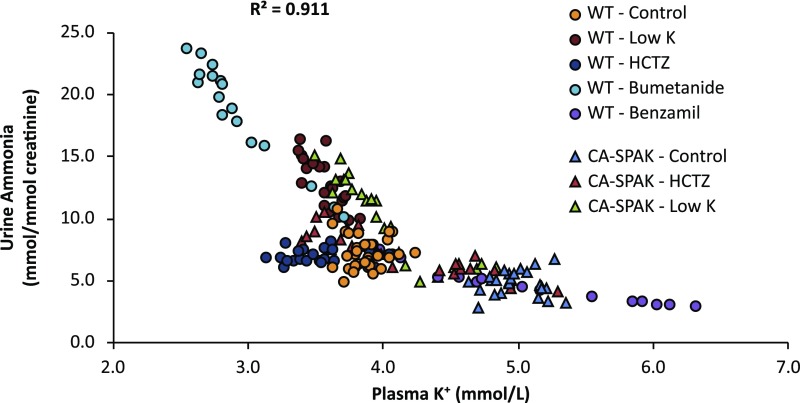
Finally, we examined the correlation between plasma K+ and urine ammonia for all mice included in this report (Figure 7). To analyze this correlation, we performed ANOVA using plasma K+ and genotype as covariates. The overall correlation was high (R2=0.91, P<0.001 by ANOVA). Plasma K+ was significantly correlated with urine ammonia (P<0.001) and there was no significant correlation with genotype (P=NS by ANOVA).
Figure 7.
Urine ammonia is highly correlated with plasma K. Correlation of plasma K+ with urine ammonia on each treatment day for each mouse in this study is shown. Plasma K+ was strongly associated with urine ammonia (P<0.001 by ANOVA) but not with genotype (P=NS by ANOVA). Overall correlation (R2) between urine ammonia and plasma K+ was 0.91. CA-SPAK, mice with early DCT-specific over-expression of constitutively active SPAK; WT, wild-type mice.
Discussion
These studies provide important new information regarding the mechanism by which hyperkalemia can cause metabolic acidosis in the presence of normal kidney function, i.e., type 4 RTA. Our results show hyperkalemia decreases ammonia excretion, and that this involves abnormal expression of multiple proteins involved in PT ammonia generation and in collecting duct ammonia transport. Thus, these results identify that hyperkalemia can be the direct cause of metabolic acidosis from its effects on multiple components of renal ammonia metabolism.
The first major finding in these studies is that hyperkalemia itself causes reversible metabolic acidosis by inhibiting ammonia excretion. Two separate models, DCT-CA-SPAK and benzamil-induced ENaC inhibition, gave essentially identical results, and correcting the hyperkalemia in DCT-CA-SPAK mice by two separate methods, HCTZ administration or a K+-restricted diet, corrected the impaired ammonia excretion. Moreover, hyperkalemia caused metabolic acidosis in the absence of decreased nephron number, in the presence of intact adrenal function, and without pharmacologic inhibition of collecting duct H+ secretion. Thus, hyperkalemia caused metabolic acidosis without altering other known mechanisms that can cause the metabolic acidosis.
Impaired ammonia metabolism during hyperkalemia partially involves decreased PT ammonia generation. Urinary ammonia derives almost completely from ammonia generated through PT glutamine metabolism.26,28,29,34 A previous in vitro study showed that hyperkalemia acutely inhibited PT ammonia generation.40 This study expands on this observation by showing this effect is persistent and in vivo is associated with altered expression of multiple proteins involved in ammonia generation. Thus, hyperkalemia appears to inhibit PT ammonia generation, both acutely and chronically, and chronic hyperkalemia is associated with altered expression of multiple ammoniagenic proteins.
Hyperkalemia may inhibit ammoniagenesis through an intracellular pH-dependent mechanism. Changes in extracellular K+ alter basolateral plasma membrane voltage through effects mediated by basolateral K+ channels.41 Hyperkalemia-induced depolarization causes intracellular alkalinization through an Na+-dependent, disulfonic stilbene–sensitive mechanism,42 likely NBCe1, and we observed recently that NBCe1 regulates ammoniagenesis.31 Another possibility is that hyperkalemia induces intracellular alkalinization via an as yet unidentified K+/H+ exchanger.
A second mechanism through which hyperkalemia inhibits ammonia excretion appears to involve collecting duct ammonia secretion. The majority of urinary ammonia derives from parallel H+ and NH3 secretion in the collecting duct.32,35,36 The ammonia transporter family member, Rhcg, contributes to both basolateral and apical NH3 transport,43–46 and its expression is necessary for normal ammonia excretion.19,44,47–49 In DCT-CA-SPAK mice, Rhcg expression is decreased in the OMCDis. In addition, apical H+-ATPase polarization is decreased. These parallel changes may be mechanistically intertwined in view of recent findings that changes in Rhcg expression can alter H+-ATPase expression and activity.50 These parallel decreases in Rhcg and H+-ATPase suggest concurrent decreased NH3 and H+ secretion and can explain decreased ammonia excretion without a change in urine pH.
Another mechanism by which hyperkalemia may contribute to the metabolic acidosis observed may involve direct effects on TAL ammonia reabsorption that do not require altered NKCC2 expression. Luminal potassium directly inhibits TAL ammonia reabsorption.51,52 Because hyperkalemia increases luminal potassium delivery to the TAL, there is likely to be decreased TAL ammonia reabsorption, which may decrease medullary interstitial ammonia.53 The decreased medullary interstitial ammonia likely decreases collecting duct ammonia secretion and contributes to the decreased ammonia excretion.
Another possible, but less likely, mechanism for hyperkalemia’s effects on ammonia excretion involves altered NHE3-mediated PT ammonia secretion. Acutely, hyperkalemia does not alter PT ammonia secretion,40 and this is consistent with DCT-CA-SPAK mice having unaltered NHE3 expression. However, a number of mechanisms, including subcellular redistribution, phosphorylation-dephosphorylation, and protein-protein interactions,54,55 regulate NHE3 activity and we cannot exclude regulation through any of these in response to chronic hyperkalemia.
An important strength of these studies is the ability to examine hyperkalemia without dietary K+ loading. First, robust excretory mechanisms make chronic hyperkalemia difficult to induce solely with dietary maneuvers. Second, K+ loading requires concomitant anion administration and the associated anion load can alter renal acid-base transport. For example, dietary Cl− alters pendrin-mediated bicarbonate secretion,56,57 and administration of nonreabsorbable anions increases urine acidification.58,59 Thus, studying hyperkalemia in DCT-CA-SPAK mice is a significant advantage of these studies, because the genetic changes are limited to early DCT cells, which do not have a major role in ammonia metabolism.
Another finding is that the thiazide diuretic, HCTZ, did not alter ammonia excretion in WT mice. This contrasts with findings that loop diuretics increase ammonia excretion through a plasma K+–independent mechanism.60,61 This loop diuretic effect has been ascribed to increased collecting duct Na+ delivery that indirectly stimulates electrogenic H+ secretion. However, our findings that HCTZ, which also increases collecting duct Na+ delivery, did not increase urinary ammonia excretion suggest an alternative mechanism. We suggest that loop diuretics acutely increase urinary ammonia excretion by inhibiting TAL ammonia reabsorption. Supporting this hypothesis is that loop diuretics decrease medullary interstitial ammonia, as expected from blocking TAL ammonia reabsorption.62,63
The effect of HCTZ on serum K+ was greater in DCT-CA-SPAK mice than in WT mice. This is similar to that reported previously and results from greater increases in urinary K+ excretion in DCT-CA-SPAK mice than in WT mice.16 This greater response correlates with HCTZ increasing ROMK expression in DCT-CA-SPAK mice but not in WT mice.16
Hyperkalemia’s effects on ammonia metabolism are the opposite of those seen with hypokalemia. Hypokalemia increases ammonia excretion,47,64,65 which leads to metabolic alkalosis, and affects key proteins involved in PT and collecting duct ammonia metabolism47,64 exactly opposite to the effects of hyperkalemia. Thus, potassium appears to exhibit a continuous, albeit inversely correlated, effect on PT and collecting duct ammonia metabolism.
DCT-CA-SPAK mice had two different conditions that alter ammonia metabolism, metabolic acidosis, and hyperkalemia. When evaluating either ammonia excretion or the effects on expression of key proteins in ammonia metabolism, the hyperkalemic-inhibitory effect was greater than the acidosis-stimulatory effect. In view of evidence that ammonia can alter CCD K+ secretion,66,67 we suggest that ammonia has a role in K+ homeostasis in addition to its role in acid-base homeostasis and that the biologic importance of the former may be greater under certain circumstances.
An important consideration when using animal models is whether they accurately reflect human physiology/pathophysiology. The experimental model used in these studies replicates the human disease familial hyperkalemic hypertension (FHHt). Patients with FHHt exhibit hyperkalemia and metabolic acidosis68–70 and have decreased ammonia excretion, and correcting the hyperkalemia increases ammonia excretion71,72 and corrects the metabolic acidosis.71–76 Thus, the findings in this study replicate those seen in patients with FHHt. Patients with isolated hypoaldosteronism have hyperkalemia, metabolic acidosis, and impaired ammonia excretion, and correcting the hyperkalemia corrects the acidosis and normalizes ammonia excretion.77 Moreover, their relationship between plasma K+ and urinary ammonia excretion77 is nearly identical to that observed in these studies. Thus, the model in this study replicates the clinical findings in patients with chronic hyperkalemia and thereby enables a mechanistic evaluation of type 4 RTA.
In summary, these studies provide important information regarding the genesis of the metabolic acidosis that accompanies hyperkalemia. Hyperkalemia, whether the result of a genetic model that did not itself alter ammonia metabolism or of pharmacologic therapy, decreased ammonia excretion. This was associated with reversible changes in key proteins involved in PT ammonia generation and in OMCDis ammonia transport. Thus, hyperkalemic RTA, i.e., type 4 RTA, can occur because hyperkalemia inhibits PT ammonia generation and collecting duct ammonia secretion, leading to abnormal ammonia excretion and thereby causing the metabolic acidosis.
Disclosures
None.
Supplementary Material
Acknowledgments
We thank Sharon W. Matthews and Chao Chen of the University of Florida, College of Medicine Electron Microscopy Core Laboratory for excellent tissue processing for the immunohistochemical studies.
These studies were supported by funding from the National Institute of Diabetes and Digestive and Kidney Diseases Grant R01-DK-045788 (I.D.W.), R01-DK-107798 (I.D.W. and J.W.V.), R01-DK093501 (P.A.W. and E.D.), R01-DK054231 (P.A.W.), and 5T32DK104721.
A.N.H. designed research studies, conducted experiments, analyzed data, and assisted in writing the manuscript. P.R.G. designed research studies, conducted experiments, analyzed data, and assisted in writing the manuscript. H.-W.L. conducted experiments, analyzed data, and assisted in writing the manuscript. E.D. provided reagents. L.F. conducted experiments and analyzed data. J.W.V. designed research studies, conducted experiments, analyzed data, and assisted in writing the manuscript. P.A.W. designed research studies, conducted experiments, analyzed data, and assisted in writing the manuscript. I.D.W. designed research studies, analyzed data, and assisted in writing the manuscript.
Footnotes
Published online ahead of print. Publication date available at www.jasn.org.
This article contains supplemental material online at http://jasn.asnjournals.org/lookup/suppl/doi:10.1681/ASN.2017111163/-/DCSupplemental.
References
- 1.Kovesdy CP, Anderson JE, Kalantar-Zadeh K: Association of serum bicarbonate levels with mortality in patients with non-dialysis-dependent CKD. Nephrol Dial Transplant 24: 1232–1237, 2009 [DOI] [PMC free article] [PubMed] [Google Scholar]
- 2.Navaneethan SD, Schold JD, Arrigain S, Jolly SE, Wehbe E, Raina R, et al.: Serum bicarbonate and mortality in stage 3 and stage 4 chronic kidney disease. Clin J Am Soc Nephrol 6: 2395–2402, 2011 [DOI] [PMC free article] [PubMed] [Google Scholar]
- 3.Raphael KL, Murphy RA, Shlipak MG, Satterfield S, Huston HK, Sebastian A, et al.; Health ABC Study : Bicarbonate concentration, acid-base status, and mortality in the health, aging, and body composition study. Clin J Am Soc Nephrol 11: 308–316, 2016 [DOI] [PMC free article] [PubMed] [Google Scholar]
- 4.Mitch WE: Metabolic and clinical consequences of metabolic acidosis. J Nephrol 19[Suppl 9]: S70–S75, 2006 [PubMed] [Google Scholar]
- 5.Goraya N, Simoni J, Jo CH, Wesson DE: Treatment of metabolic acidosis in patients with stage 3 chronic kidney disease with fruits and vegetables or oral bicarbonate reduces urine angiotensinogen and preserves glomerular filtration rate. Kidney Int 86: 1031–1038, 2014 [DOI] [PubMed] [Google Scholar]
- 6.de Brito-Ashurst I, Varagunam M, Raftery MJ, Yaqoob MM: Bicarbonate supplementation slows progression of CKD and improves nutritional status. J Am Soc Nephrol 20: 2075–2084, 2009 [DOI] [PMC free article] [PubMed] [Google Scholar]
- 7.Santos F, Gil-Peña H, Alvarez-Alvarez S: Renal tubular acidosis. Curr Opin Pediatr 29: 206–210, 2017 [DOI] [PubMed] [Google Scholar]
- 8.Gil-Peña H, Mejía N, Santos F: Renal tubular acidosis. J Pediatr 164: 691–698.e1, 2014 [DOI] [PubMed] [Google Scholar]
- 9.Alper SL: Familial renal tubular acidosis. J Nephrol 23[Suppl 16]: S57–S76, 2010 [PubMed] [Google Scholar]
- 10.Karet FE: Mechanisms in hyperkalemic renal tubular acidosis. J Am Soc Nephrol 20: 251–254, 2009 [DOI] [PubMed] [Google Scholar]
- 11.Rodríguez Soriano J: Renal tubular acidosis: The clinical entity. J Am Soc Nephrol 13: 2160–2170, 2002 [DOI] [PubMed] [Google Scholar]
- 12.DuBose TD, Jr: Hyperkalemic hyperchloremic metabolic acidosis: Pathophysiologic insights. Kidney Int 51: 591–602, 1997 [DOI] [PubMed] [Google Scholar]
- 13.Weiner ID, Wingo CS: Hyperkalemia: A potential silent killer. J Am Soc Nephrol 9: 1535–1543, 1998 [DOI] [PubMed] [Google Scholar]
- 14.Rabelink TJ, Koomans HA, Hené RJ, Dorhout Mees EJ: Early and late adjustment to potassium loading in humans. Kidney Int 38: 942–947, 1990 [DOI] [PubMed] [Google Scholar]
- 15.Bauer JH, Gauntner WC: Effect of potassium chloride on plasma renin activity and plasma aldosterone during sodium restriction in normal man. Kidney Int 15: 286–293, 1979 [DOI] [PubMed] [Google Scholar]
- 16.Grimm PR, Coleman R, Delpire E, Welling PA: Constitutively active SPAK causes hyperkalemia by activating NCC and remodeling distal tubules. J Am Soc Nephrol 28: 2597–2606, 2017 [DOI] [PMC free article] [PubMed] [Google Scholar]
- 17.Hadchouel J, Ellison DH, Gamba G: Regulation of renal electrolyte transport by WNK and SPAK-OSR1 kinases. Annu Rev Physiol 78: 367–389, 2016 [DOI] [PubMed] [Google Scholar]
- 18.Huang CL, Yang SS, Lin SH: Mechanism of regulation of renal ion transport by WNK kinases. Curr Opin Nephrol Hypertens 17: 519–525, 2008 [DOI] [PubMed] [Google Scholar]
- 19.Lee HW, Verlander JW, Bishop JM, Igarashi P, Handlogten ME, Weiner ID: Collecting duct-specific Rh C glycoprotein deletion alters basal and acidosis-stimulated renal ammonia excretion. Am J Physiol Renal Physiol 296: F1364–F1375, 2009 [DOI] [PMC free article] [PubMed] [Google Scholar]
- 20.Lee HW, Osis G, Handlogten ME, Verlander JW, Weiner ID: Proximal tubule glutamine synthetase expression is necessary for the normal response to dietary protein restriction. Am J Physiol Renal Physiol 313: F116–F125, 2017 [DOI] [PMC free article] [PubMed] [Google Scholar]
- 21.Lee HW, Osis G, Handlogten ME, Lamers WH, Chaudhry FA, Verlander JW, et al.: Proximal tubule-specific glutamine synthetase deletion alters basal and acidosis-stimulated ammonia metabolism. Am J Physiol Renal Physiol 310: F1229–F1242, 2016 [DOI] [PMC free article] [PubMed] [Google Scholar]
- 22.Lee HW, Osis G, Handlogten ME, Guo H, Verlander JW, Weiner ID: Effect of dietary protein restriction on renal ammonia metabolism. Am J Physiol Renal Physiol 308: F1463–F1473, 2015 [DOI] [PMC free article] [PubMed] [Google Scholar]
- 23.Verlander JW, Chu D, Lee HW, Handlogten ME, Weiner ID: Expression of glutamine synthetase in the mouse kidney: Localization in multiple epithelial cell types and differential regulation by hypokalemia. Am J Physiol Renal Physiol 305: F701–F713, 2013 [DOI] [PMC free article] [PubMed] [Google Scholar]
- 24.Kim HY, Baylis C, Verlander JW, Han KH, Reungjui S, Handlogten ME, et al.: Effect of reduced renal mass on renal ammonia transporter family, Rh C glycoprotein and Rh B glycoprotein, expression. Am J Physiol Renal Physiol 293: F1238–F1247, 2007 [DOI] [PubMed] [Google Scholar]
- 25.Weiner ID, Verlander JW: Recent advances in understanding renal ammonia metabolism and transport. Curr Opin Nephrol Hypertens 25: 436–443, 2016 [DOI] [PMC free article] [PubMed] [Google Scholar]
- 26.Curthoys NP, Moe OW: Proximal tubule function and response to acidosis. Clin J Am Soc Nephrol 9: 1627–1638, 2014 [DOI] [PMC free article] [PubMed] [Google Scholar]
- 27.Wagner CA: Metabolic acidosis: New insights from mouse models. Curr Opin Nephrol Hypertens 16: 471–476, 2007 [DOI] [PubMed] [Google Scholar]
- 28.Weiner ID, Verlander JW: Ammonia transporters and their role in acid-base balance. Physiol Rev 97: 465–494, 2017 [DOI] [PMC free article] [PubMed] [Google Scholar]
- 29.Weiner ID, Mitch WE, Sands JM: Urea and ammonia metabolism and the control of renal nitrogen excretion. Clin J Am Soc Nephrol 10: 1444–1458, 2015 [DOI] [PMC free article] [PubMed] [Google Scholar]
- 30.Conjard A, Komaty O, Delage H, Boghossian M, Martin M, Ferrier B, et al.: Inhibition of glutamine synthetase in the mouse kidney: A novel mechanism of adaptation to metabolic acidosis. J Biol Chem 278: 38159–38166, 2003 [DOI] [PubMed] [Google Scholar]
- 31.Handlogten ME, Osis G, Lee HW, Romero MF, Verlander JW, Weiner ID: NBCe1 expression is required for normal renal ammonia metabolism. Am J Physiol Renal Physiol 309: F658–F666, 2015 [DOI] [PMC free article] [PubMed] [Google Scholar]
- 32.Weiner ID, Hamm LL: Molecular mechanisms of renal ammonia transport. Annu Rev Physiol 69: 317–340, 2007 [DOI] [PMC free article] [PubMed] [Google Scholar]
- 33.Weiner ID, Verlander JW: Ammonia transport in the kidney by Rhesus glycoproteins. Am J Physiol Renal Physiol 306: F1107–F1120, 2014 [DOI] [PMC free article] [PubMed] [Google Scholar]
- 34.Weiner ID, Verlander JW: Renal ammonia metabolism and transport. Compr Physiol 3: 201–220, 2013 [DOI] [PMC free article] [PubMed] [Google Scholar]
- 35.Hamm LL, Nakhoul N, Hering-Smith KS: Acid-base homeostasis. Clin J Am Soc Nephrol 10: 2232–2242, 2015 [DOI] [PMC free article] [PubMed] [Google Scholar]
- 36.Hamm LL, Simon EE: Roles and mechanisms of urinary buffer excretion. Am J Physiol 253: F595–F605, 1987 [DOI] [PubMed] [Google Scholar]
- 37.Weiner ID, Verlander JW: Role of NH3 and NH4+ transporters in renal acid-base transport. Am J Physiol Renal Physiol 300: F11–F23, 2011 [DOI] [PMC free article] [PubMed] [Google Scholar]
- 38.Gluck SL, Underhill DM, Iyori M, Holliday LS, Kostrominova TY, Lee BS: Physiology and biochemistry of the kidney vacuolar H+-ATPase. Annu Rev Physiol 58: 427–445, 1996 [DOI] [PubMed] [Google Scholar]
- 39.Bastani B, Purcell H, Hemken P, Trigg D, Gluck S: Expression and distribution of renal vacuolar proton-translocating adenosine triphosphatase in response to chronic acid and alkali loads in the rat. J Clin Invest 88: 126–136, 1991 [DOI] [PMC free article] [PubMed] [Google Scholar]
- 40.Nagami GT: Effect of bath and luminal potassium concentration on ammonia production and secretion by mouse proximal tubules perfused in vitro. J Clin Invest 86: 32–39, 1990 [DOI] [PMC free article] [PubMed] [Google Scholar]
- 41.Siebens AW, Boron WF: Depolarization-induced alkalinization in proximal tubules. I. Characteristics and dependence on Na+. Am J Physiol 256: F342–F353, 1989 [DOI] [PubMed] [Google Scholar]
- 42.Siebens AW, Boron WF: Depolarization-induced alkalinization in proximal tubules. II. Effects of lactate and SITS. Am J Physiol 256: F354–F365, 1989 [DOI] [PubMed] [Google Scholar]
- 43.Kim HY, Verlander JW, Bishop JM, Cain BD, Han KH, Igarashi P, et al.: Basolateral expression of the ammonia transporter family member Rh C glycoprotein in the mouse kidney. Am J Physiol Renal Physiol 296: F543–F555, 2009 [DOI] [PMC free article] [PubMed] [Google Scholar]
- 44.Biver S, Belge H, Bourgeois S, Van Vooren P, Nowik M, Scohy S, et al.: A role for Rhesus factor Rhcg in renal ammonium excretion and male fertility. Nature 456: 339–343, 2008 [DOI] [PubMed] [Google Scholar]
- 45.Bourgeois S, Bounoure L, Christensen EI, Ramakrishnan SK, Houillier P, Devuyst O, et al.: Haploinsufficiency of the ammonia transporter Rhcg predisposes to chronic acidosis: Rhcg is critical for apical and basolateral ammonia transport in the mouse collecting duct. J Biol Chem 288: 5518–5529, 2013 [DOI] [PMC free article] [PubMed] [Google Scholar]
- 46.Handlogten ME, Hong SP, Westhoff CM, Weiner ID: Apical ammonia transport by the mouse inner medullary collecting duct cell (mIMCD-3). Am J Physiol Renal Physiol 289: F347–F358, 2005 [DOI] [PubMed] [Google Scholar]
- 47.Lee HW, Verlander JW, Bishop JM, Handlogten ME, Han KH, Weiner ID: Renal ammonia excretion in response to hypokalemia: Effect of collecting duct-specific Rh C glycoprotein deletion. Am J Physiol Renal Physiol 304: F410–F421, 2013 [DOI] [PMC free article] [PubMed] [Google Scholar]
- 48.Lee HW, Verlander JW, Bishop JM, Nelson RD, Handlogten ME, Weiner ID: Effect of intercalated cell-specific Rh C glycoprotein deletion on basal and metabolic acidosis-stimulated renal ammonia excretion. Am J Physiol Renal Physiol 299: F369–F379, 2010 [DOI] [PMC free article] [PubMed] [Google Scholar]
- 49.Lee HW, Verlander JW, Handlogten ME, Han K-H, Weiner ID: Effect of collecting duct-specific deletion of both Rh B Glycoprotein (Rhbg) and Rh C Glycoprotein (Rhcg) on renal response to metabolic acidosis. Am J Physiol Renal Physiol 306: F389–F400, 2014 [DOI] [PMC free article] [PubMed] [Google Scholar]
- 50.Bourgeois S, Bounoure L, Mouro-Chanteloup I, Colin Y, Brown D, Wagner CA: The ammonia transporter RhCG modulates urinary acidification by interacting with the vacuolar proton-ATPases in renal intercalated cells. Kidney Int 93: 390–402, 2018 [DOI] [PMC free article] [PubMed] [Google Scholar]
- 51.Good DW: Ammonium transport by the thick ascending limb of Henle’s loop. Annu Rev Physiol 56: 623–647, 1994 [DOI] [PubMed] [Google Scholar]
- 52.Kinne R, Kinne-Saffran E, Schütz H, Schölermann B: Ammonium transport in medullary thick ascending limb of rabbit kidney: Involvement of the Na+,K+,Cl(-)-cotransporter. J Membr Biol 94: 279–284, 1986 [DOI] [PubMed] [Google Scholar]
- 53.DuBose TD Jr, Good DW: Chronic hyperkalemia impairs ammonium transport and accumulation in the inner medulla of the rat. J Clin Invest 90: 1443–1449, 1992 [DOI] [PMC free article] [PubMed] [Google Scholar]
- 54.Donowitz M, Mohan S, Zhu CX, Chen TE, Lin R, Cha B, et al.: NHE3 regulatory complexes. J Exp Biol 212: 1638–1646, 2009 [DOI] [PMC free article] [PubMed] [Google Scholar]
- 55.Alexander RT, Grinstein S: Tethering, recycling and activation of the epithelial sodium-proton exchanger, NHE3. J Exp Biol 212: 1630–1637, 2009 [DOI] [PubMed] [Google Scholar]
- 56.Wall SM, Kim YH, Stanley L, Glapion DM, Everett LA, Green ED, et al.: NaCl restriction upregulates renal Slc26a4 through subcellular redistribution: Role in Cl- conservation. Hypertension 44: 982–987, 2004 [DOI] [PubMed] [Google Scholar]
- 57.Quentin F, Chambrey R, Trinh-Trang-Tan MM, Fysekidis M, Cambillau M, Paillard M, et al.: The Cl-/HCO3- exchanger pendrin in the rat kidney is regulated in response to chronic alterations in chloride balance. Am J Physiol Renal Physiol 287: F1179–F1188, 2004 [DOI] [PubMed] [Google Scholar]
- 58.Schwartz WB, van Ypersele de Strihou C, Kassirer JP: Role of anions in metabolic alkalosis and potassium deficiency. N Engl J Med 279: 630–639, 1968 [DOI] [PubMed] [Google Scholar]
- 59.Briggs AP: Excretion of ammonia and neutrality regulation. J Biol Chem 104: 231–238, 1934 [Google Scholar]
- 60.Batlle DC: Sodium-dependent urinary acidification in patients with aldosterone deficiency and in adrenalectomized rats: Effect of furosemide. Metabolism 35: 852–860, 1986 [DOI] [PubMed] [Google Scholar]
- 61.Hutcheon DE, Vincent ME, Sandhu RS: Renal electrolyte excretion pattern in response to bumetanide in healthy volunteers. J Clin Pharmacol 21: 604–609, 1981 [DOI] [PubMed] [Google Scholar]
- 62.Packer RK, Desai SS, Hornbuckle K, Knepper MA: Role of countercurrent multiplication in renal ammonium handling: Regulation of medullary ammonium accumulation. J Am Soc Nephrol 2: 77–83, 1991 [DOI] [PubMed] [Google Scholar]
- 63.Wall SM, Fischer MP: Contribution of the Na(+)-K(+)-2Cl(-) cotransporter (NKCC1) to transepithelial transport of H(+), NH(4)(+), K(+), and Na(+) in rat outer medullary collecting duct. J Am Soc Nephrol 13: 827–835, 2002 [DOI] [PubMed] [Google Scholar]
- 64.Abu Hossain S, Chaudhry FA, Zahedi K, Siddiqui F, Amlal H: Cellular and molecular basis of increased ammoniagenesis in potassium deprivation. Am J Physiol Renal Physiol 301: F969–F978, 2011 [DOI] [PubMed] [Google Scholar]
- 65.Han KH, Lee HW, Handlogten ME, Bishop JM, Levi M, Kim J, et al.: Effect of hypokalemia on renal expression of the ammonia transporter family members, Rh B Glycoprotein and Rh C Glycoprotein, in the rat kidney. Am J Physiol Renal Physiol 301: F823–F832, 2011 [DOI] [PMC free article] [PubMed] [Google Scholar]
- 66.Hamm LL, Gillespie C, Klahr S: NH4Cl inhibition of transport in the rabbit cortical collecting tubule. Am J Physiol 248: F631–F637, 1985 [DOI] [PubMed] [Google Scholar]
- 67.Weiner ID: Roles of renal ammonia metabolism other than in acid-base homeostasis. Pediatr Nephrol 32: 933–942, 2017 [DOI] [PMC free article] [PubMed] [Google Scholar]
- 68.Hadchouel J, Delaloy C, Fauré S, Achard JM, Jeunemaitre X: Familial hyperkalemic hypertension. J Am Soc Nephrol 17: 208–217, 2006 [DOI] [PubMed] [Google Scholar]
- 69.Gordon RD: Syndrome of hypertension and hyperkalemia with normal glomerular filtration rate. Hypertension 8: 93–102, 1986 [DOI] [PubMed] [Google Scholar]
- 70.Soppi E, Viikari J, Seppälä P, Lehtonen A, Saarinen R, Miilunpalo S: Unusual association of hyperkalemia and hypertension. Hypertension 8: 174–177, 1986 [DOI] [PubMed] [Google Scholar]
- 71.Licht JH, Amundson D, Hsueh WA, Lombardo JV: Familiar hyperkalaemic acidosis. Q J Med 54: 161–176, 1985 [PubMed] [Google Scholar]
- 72.Nahum H, Paillard M, Prigent A, Leviel F, Bichara M, Gardin JP, et al.: Pseudohypoaldosteronism type II: Proximal renal tubular acidosis and dDAVP-sensitive renal hyperkalemia. Am J Nephrol 6: 253–262, 1986 [DOI] [PubMed] [Google Scholar]
- 73.Arnold JE, Healy JK: Hyperkalemia, hypertension and systemic acidosis without renal failure associated with a tubular defect in potassium excretion. Am J Med 47: 461–472, 1969 [DOI] [PubMed] [Google Scholar]
- 74.Brautbar N, Levi J, Rosler A, Leitesdorf E, Djaldeti M, Epstein M, et al.: Familial hyperkalemia, hypertension, and hyporeninemia with normal aldosterone levels. A tubular defect in potassium handling. Arch Intern Med 138: 607–610, 1978 [PubMed] [Google Scholar]
- 75.Sanjad SA, Mansour FM, Hernandez RH, Hill LL: Severe hypertension, hyperkalemia, and renal tubular acidosis responding to dietary sodium restriction. Pediatrics 69: 317–324, 1982 [PubMed] [Google Scholar]
- 76.Travis PS, Cushner HM: Mineralocorticoid-induced kaliuresis in type-II pseudohypoaldosteronism. Am J Med Sci 292: 235–240, 1986 [DOI] [PubMed] [Google Scholar]
- 77.Szylman P, Better OS, Chaimowitz C, Rosler A: Role of hyperkalemia in the metabolic acidosis of isolated hypoaldosteronism. N Engl J Med 294: 361–365, 1976 [DOI] [PubMed] [Google Scholar]
Associated Data
This section collects any data citations, data availability statements, or supplementary materials included in this article.


