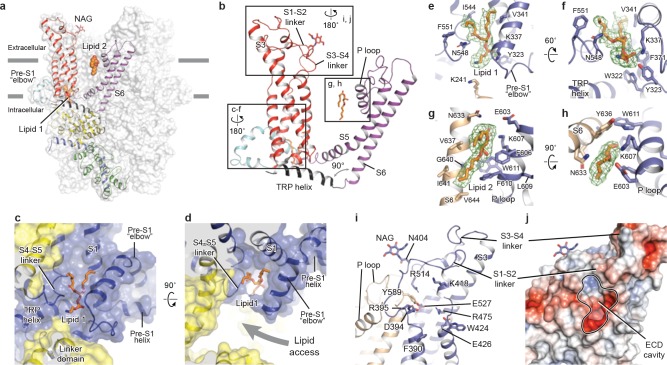
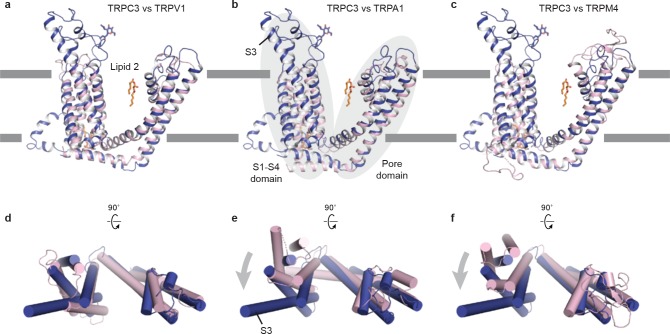
Figure 3. Transmembrane domain, extracellular domain, and lipid-binding sites.
(a) Domain organization. The channel is shown in surface representation, with one subunit shown in cartoon representation. The colors match those in Figure 2a. (b) Details of the transmembrane domain and extracellular domain. (c–d) Pre-S1 elbow and binding site of lipid 1. The lipid molecule is buried inside the pocket formed by pre-S1 elbow, S1, and the S4-S5 linker. Two adjacent subunits (blue and yellow) are shown in both cartoon and surface representations. The lipid molecule is shown as sticks. (e–f) Residues that interact with lipid 1 are shown in sticks, and protein is shown in cartoon representation. Lipid density is shown in mesh. (g–h) Lipid 2 binds between S6 and the P loop of adjacent subunits, which are in light blue and wheat. (i) Structure of the ECD. Key residues forming the cavity is shown in sticks. Adjacent subunits are in light blue and wheat. (j) Surface representation of the ECD, colored according to the electrostatic surface potential. The color gradient is from −5 to 5 kT/e (red to blue).


