

Abstract
Objective
This study was conducted to validate the Martin method in coronary atherosclerosis in comparison with the Friedewald equation.
Subjects and Methods
A total of 299 participants with a coronary artery calcium score (CACS) ≥300 and a serum triglyceride (TG) level <400 mg/dL at Seoul National University Hospital Healthcare System Gangnam Center, Seoul, Korea, were enrolled in this study. Low-density lipoprotein cholesterol (LDL-C) was directly measured with a homogeneous assay (DLDL) and estimated by both the Friedewald equation (FLDL) and Martin method (MLDL). Overall concordances between DLDL and LDL-C estimates were calculated as the percent agreement. The McNemar test was used to compare the rate of reclassification of participants with FLDL and MLDL, and to determine which differed significantly from each other.
Results
Overall concordance between DLDL and MLDL was slightly higher than that between DLDL and FLDL (73.2 vs. 70.9%, p < 0.001). The FLDL showed poor performance when the TG level was ≥200 mg/dL, mostly by underestimation, which represented a 64.7% discordance with DLDL. The reclassification rate by MLDL, however, did not exceed 35.3% in all of the TG groups.
Conclusions
The Martin method to estimate LDL-C using the strata-specific TG:VLDL ratio showed a 2-fold better concordance with LDL-C measured with a direct homogeneous assay in coronary atherosclerosis compared to the Friedewald equation when the TG level was ≥200 mg/dL. This finding suggests that MLDL could be a better alternative for estimating LDL-C compared to FLDL when the TG level is ≥200 mg/dL in coronary atherosclerosis.
Keywords: Low-density lipoprotein cholesterol, Coronary atherosclerosis, Friedewald equation
Introduction
Cardiovascular diseases (CVDs) are the leading cause of death worldwide [1]. An estimated 17.5 million people died from CVDs in 2012, which was 31% of all global deaths [1]. Of these deaths, an estimated 7.4 million were due to coronary heart disease (CHD), and 6.7 million were due to stroke [1].
Radiographically detectable coronary-artery calcium is a marker of subclinical CHD and predicts coronary events [2]. In a previous study, coronary artery calcium scores (CACS) demonstrated incremental values for the prediction of CHD compared with the standard coronary risk factors, and the prediction value was greatest when the CACS was over 300 [3].
Prevention of CVD is important since it may lead to serious clinical sequelae [4]. Changing lifestyle behaviors and reducing cardiovascular risk factors are well-known measures for the prevention of CVD [4]. Low-density lipoprotein cholesterol (LDL-C) is a major modifiable cardiovascular risk factor [5, 6]. Therefore, accurate assessment of the LDL-C level is important for making decisions about therapeutic plans. In clinical practice, LDL-C estimated by the Friedewald equation is generally utilized when direct measurement is unavailable or costly [7].
However, there are several limitations to the Friedewald equation. First, a fixed ratio of triglyceride (TG) levels to very-low-density lipoprotein cholesterol (TG/VLDL-C) of 5:1, as used in the Friedewald equation, does not provide an accurate estimate of VLDL-C. Indeed, the Lipid Research Clinics Prevalence Study showed that the mean TG:VLDL-C ratio ranged from 5.2 to 8.9 [8]. Furthermore, there are several clinical conditions that may alter the TG/VLDL-C ratio and lead to an inaccurate assessment of LDL-C when using the Friedewald equation. In patients with type III hyperlipoproteinemia, VLDL is abnormally high with cholesterol relative to TG that results in an underestimation of VLDL-C and an overestimation of LDL-C [9]. In diabetic patients, the Friedewald equation underestimated serum LDL-C on average by 8%, and by more than 10% in patients with TG levels between 200 and 400 mg/dL [10]. In patients with alcoholic liver cirrhosis, the Friedewald equation significantly underestimated LDL-C on average by 15% compared to direct measurement using an ultracentrifugation method [11].
Second, the Friedewald equation requires fasting serum to estimate LDL-C, since chylomicronemia in a nonfasting status causes the overestimation of VLDL-C and underestimation of LDL-C [9, 12]. Similarly, the Friedewald equation tends to become less reliable for estimating LDL-C when plasma TG concentrations increase, because the ratio of VLDL-C to serum TG gradually changes as serum TG concentrations increase [9, 13]. Thus, the error in estimated LDL-C gradually increases as fasting serum TG concentrations increase [9, 13]. The formula's inaccuracies at TG levels ≥400 mg/dL were well recognized by Friedewald et al. [14]. However, when TG levels are below 400 mg/dL, the LDL-C calculated by the Friedewald equation underestimates LDL-C and thus misclassifies the CVD risk [7, 15, 16]. Especially if TG levels are ≥150 mg/dL, the Friedewald estimation commonly classifies LDL-C as <70 mg/dL, despite directly measured levels that were ≥70 mg/dL [15].
Third, in the era when the Friedewald equation was proposed, an LDL-C ≤70 mg/dL was not yet established as an ideal secondary prevention target for the treatment of high-risk patients [17, 18]. In fact, an LDL-C level in this range was not included in the original training data set used in deriving the Friedewald equation [14]. Therefore, Martin et al. [18] proposed a novel method of applying an adjustable factor for the TG/VLDL-C ratio based on TGs and non-high-density lipoprotein cholesterol (HDL-C) concentrations.
Several studies applying this novel method have been reported [19, 20]. However, the Martin equation has not been validated in coronary atherosclerosis. Hence, in this study, the Martin method was compared to the traditional Friedewald equation with a direct homogeneous assay for estimating LDL-C in coronary atherosclerosis predicted using CACS.
Subjects and Methods
Study Population
The medical records of 2,773 individuals who underwent a general health check-up and completed an examination of total cholesterol, HDL-C, TG, directly measured LDL-C (DLDL), and coronary CT angiography at the Seoul National University Hospital Healthcare System Gangnam Center from September 2012 to March 2014 were reviewed. The study protocol was reviewed and approved by the institutional review board of Seoul National University Hospital (IRB No. H-1612-001-809). Since the current study was performed as a retrospective study using the database and medical records, informed consent was waived by the board. Exclusion criteria were TG levels ≥400 mg/dL and CACS <300. Based on exclusion criteria, of the 2,773 patients, 299 participants were enrolled in this study.
Demographic Characteristics, Anthropometric Data, and Laboratory Findings
Demographic characteristics and anthropometric data were acquired using medical questionnaires, nurse interviews, and health examinations. Data of total cholesterol, TG, LDL-C (DLDL), and HDL-C were obtained from the medical records.
The LDL-C estimation by the Friedewald equation (FLDL) and Martin method (MLDL) were calculated as previously described [14, 20]. The FLDL was calculated using a fixed ratio of 5 for VLDL-C:TG. Thus, FLDL (mg/dL) was expressed as: (total cholesterol - HDL-C) - TG/5. MLDL was calculated using the median of the ratio of TG to VLDL-C by non-HDL-C and TG strata acquired from 900,605 people (Table 1) [18]. Thus, MLDL was expressed as: total cholesterol - HDL-C - TG/(strata-specific median VLDL-C:TG ratio).
Table 1.
Median values for the ratio of TG to VLDL-C by non-HDL-C and TG strata (180-cell)
| TG levels, mg/dL | Non-HDL-C, mg/dL |
|||||
|---|---|---|---|---|---|---|
| <100 | 100–129 | 130–159 | 160–189 | 190–219 | ≥220 | |
| 7–49 | 3.5 | 3.4 | 3.3 | 3.3 | 3.2 | 3.1 |
| 50–56 | 4.0 | 3.9 | 3.7 | 3.6 | 3.6 | 3.4 |
| 57–61 | 4.3 | 4.1 | 4.0 | 3.9 | 3.8 | 3.6 |
| 62–66 | 4.5 | 4.3 | 4.1 | 4.0 | 3.9 | 3.9 |
| 67–71 | 4.7 | 4.4 | 4.3 | 4.2 | 4.1 | 3.9 |
| 72–75 | 4.8 | 4.6 | 4.4 | 4.2 | 4.2 | 4.1 |
| 76–79 | 4.9 | 4.6 | 4.5 | 4.3 | 4.3 | 4.2 |
| 80–83 | 5.0 | 4.8 | 4.6 | 4.4 | 4.3 | 4.2 |
| 84–87 | 5.1 | 4.8 | 4.6 | 4.5 | 4.4 | 4.3 |
| 88–92 | 5.2 | 4.9 | 4.7 | 4.6 | 4.4 | 4.3 |
| 93–96 | 5.3 | 5.0 | 4.8 | 4.7 | 4.5 | 4.4 |
| 97–100 | 5.4 | 5.1 | 4.8 | 4.7 | 4.5 | 4.3 |
| 101–105 | 5.5 | 5.2 | 5.0 | 4.7 | 4.6 | 4.5 |
| 106–110 | 5.6 | 5.3 | 5.0 | 4.8 | 4.6 | 4.5 |
| 111–115 | 5.7 | 5.4 | 5.1 | 4.9 | 4.7 | 4.5 |
| 116–120 | 5.8 | 5.5 | 5.2 | 5.0 | 4.8 | 4.6 |
| 121–126 | 6.0 | 5.5 | 5.3 | 5.0 | 4.8 | 4.6 |
| 127–132 | 6.1 | 5.7 | 5.3 | 5.1 | 4.9 | 4.7 |
| 133–138 | 6.2 | 5.8 | 5.4 | 5.2 | 5.0 | 4.7 |
| 139–146 | 6.3 | 5.9 | 5.6 | 5.3 | 5.0 | 4.8 |
| 147–154 | 6.5 | 6.0 | 5.7 | 5.4 | 5.1 | 4.8 |
| 155–163 | 6.7 | 6.2 | 5.8 | 5.4 | 5.2 | 4.9 |
| 164–173 | 6.8 | 6.3 | 5.9 | 5.5 | 5.3 | 5.0 |
| 174–185 | 7.0 | 6.5 | 6.0 | 5.7 | 5.4 | 5.1 |
| 186–201 | 7.3 | 6.7 | 6.2 | 5.8 | 5.5 | 5.2 |
| 202–220 | 7.6 | 6.9 | 6.4 | 6.0 | 5.6 | 5.3 |
| 221–247 | 8.0 | 7.2 | 6.6 | 6.2 | 5.9 | 5.4 |
| 248–292 | 8.5 | 7.6 | 7.0 | 6.5 | 6.1 | 5.6 |
| 293–399 | 9.5 | 8.3 | 7.5 | 7.0 | 6.5 | 5.9 |
| 400–13,975 | 11.9 | 10.0 | 8.8 | 8.1 | 7.5 | 6.7 |
From Martin et al. [18]. HDL-C, high-density lipoprotein cholesterol; TG, triglyceride; VLDL-C, very low-density lipoprotein cholesterol.
Coronary CT angiography was performed using a 256-slice multidetector CT scanner (Brilliance iCT 256; Philips Medical Systems, Cleveland, OH, USA). The CACS was calculated onsite on a dedicated workstation with the analysis software Wizard VB10B (Somaris/5 VB10B-W, Syngo; Siemens, Erlangen, Germany), and quantitative CACS was calculated according to the method described by Agatston et al. [21].
Statistical Analysis
All statistical analyses were performed using Statistical Package for the Social Sciences (SPSS) 22.0 for Windows (SPSS, Chicago, IL, USA) and MedCalc for Windows version 16.8.4.0 (MedCalc Software, Mariakerke, Belgium). All statistical outcomes were based on 2-sided tests, and p values <0.05 were considered to be significant.
For continuous variables, data are expressed as the median and interquartile ranges, since their distribution was not normal by the Kolmogorov-Smirnov test (p < 0.05). For categorical variables, data are expressed as percentages. Bland-Altman plots were created to compare DLDL and FLDL or DLDL and MLDL. A paired t test was performed to compare the mean difference between DLDL-FLDL and DLDL-MLDL. Linear regression was performed between DLDL and FLDL or DLDL and MLDL. Concordance in classification between FLDL and DLDL was examined through cross-tabulations by DLDL categories according to the National Cholesterol Education Program Adult Treatment Panel III (NCEP-ATP III) guideline [5]. The McNemar test was used to compare overall concordance between LDL-C estimates and whether the rate of reclassification of participants with FLDL or MLDL significantly differed from each other by DLDL categories or TG groups. The Pearson χ2 test was used to compare the reclassification rate of FLDL or MLDL among the 4 TG groups (TG <100 mg/dL, TG 100–149 mg/dL, TG 150–199 mg/dL, and TG 200–399 mg/dL). Comparisons of DLDL-FLDL or DLDL-MLDL values according to TG groups were analyzed using the Kruskal-Wallis test.
Results
The demographic characteristics and lipid profile or overall concordance of FLDL and MLDL compared to DLDL of the participants in this study are shown in Table 2. The median and interquartile ranges of DLDL, FLDL, and MLDL in our study were as follows: DLDL 107 mg/dL (89–130), FLDL 99 mg/dL (77–128), and MLDL 101 (83–128) mg/dL. The median CACS and interquartile range were 607 and 423–1017, respectively.
Table 2.
Median values of the baseline characteristics of patients in the present study
| Participants, n | 299 |
| Median age, years | 63 (58–70) |
| Male | 268 (89.6) |
| TC, mg/dL | 180 (153–202) |
| TG, mg/dL | 104 (73–147) |
| HDL-C, mg/dL | 51 (43–59) |
| Non-HDL-C, mg/dL | 125 (103–151) |
| TG:VLDL-C | 5.1 (4.5–5.8) |
| DLDL, mg/dL | 107 (89–130) |
| FLDL, mg/dL | 99 (77–128) |
| MLDL, mg/dL | 101 (83–128) |
| Overall concordance of FLDL, % (95% CI) | 70.9 (65.9–75.9) |
| Overall concordance of MLDL, % (95% CI) | 73.2 (68.2–77.9) |
Values are presented as the median (interquartile range) or n (%), unless otherwise indicated. The DLDL method was by homogeneous assay. TC, total cholesterol; TG, triglyceride; HDL-C, high-density lipoprotein cholesterol; VLDL-C, very-low density lipoprotein cholesterol; DLDL, directly measured LDL-C; FLDL, LDL-C estimated using the Friedewald equation; MLDL, LDL-C estimated using the Martin method.
The distribution of TG:VLDL-C ratios is shown in Figure 1. The median TG:VLDL-C ratio was 5.1 (4.5–5.8; Table 2). Most of estimates using both FLDL and MLDL were within 2 SD compared with DLDL, as depicted by the Bland-Altman plot (Fig. 2). The mean difference between DLDL and MLDL was slightly lower than that of DLDL and FLDL (7.4 [−7.8, 22.7] vs. 5.3 [−7.4, 18.1]; p < 0.001). Also, linear regression analysis revealed a good correlation between both FLDL and MLDL with DLDL (Fig. 3). However, MLDL showed a better fit with DLDL (MLDL, r = 0.98, p < 0.001 vs. FLDL, r = 0.97, p < 0.001) compared to FLDL. Overall concordance between DLDL and MLDL as an agreement with LDL-C treatment classes recommended by NCEP-ATP III was slightly higher than that between DLDL and FLDL (73.2 vs. 70.9%, p < 0.001).
Fig. 1.
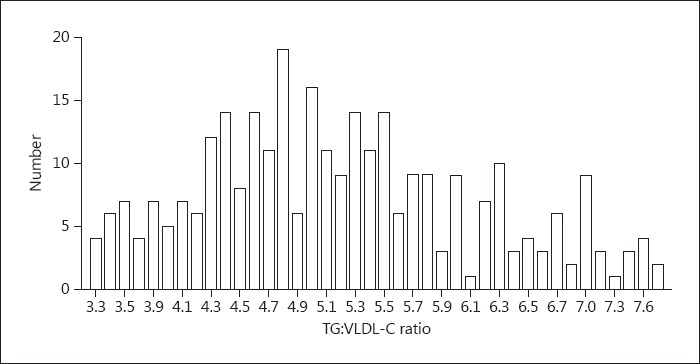
Distribution of the TG:VLDL-C ratio.
Fig. 2.
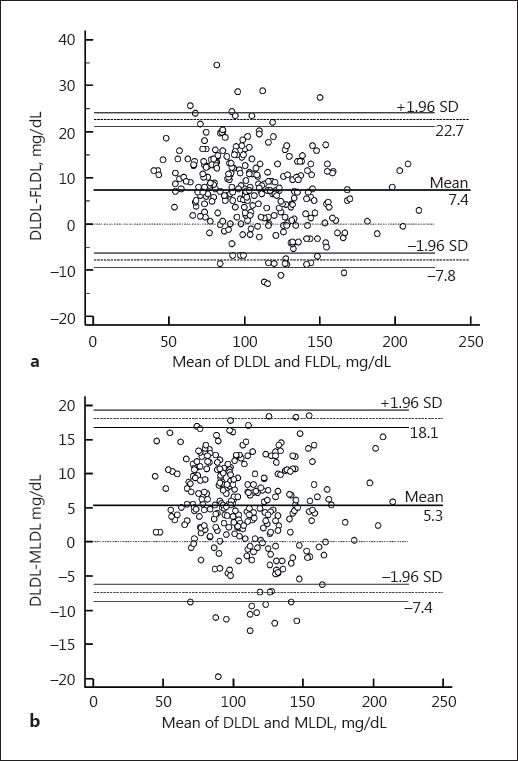
Bland-Altman plot for the comparison of DLDL and LDL-C estimated using the Friedewald equation (a) and Martin method (b).
Fig. 3.
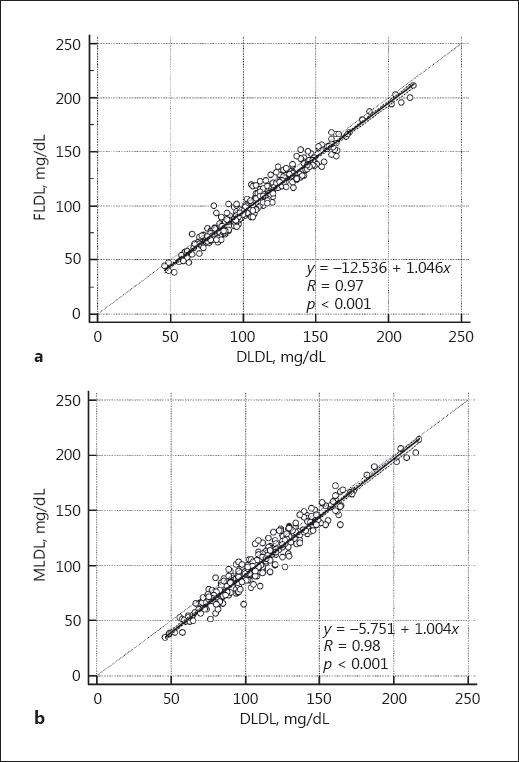
Comparison of the correlation between DLDL and FLDL (a) or MLDL (b).
Reclassification rates of FLDL or MLDL by individual DLDL NCEP-ATP III treatment classes and TG level groups are shown in Table 3. There was no significant difference in the reclassification rates between FLDL- and MLDL-estimated DLDL by NCEP-ATP III treatment classes. Analysis by TG groups showed that in the TG <100 mg/dL group, the reclassification rate of FLDL was significantly lower than that of MLDL (24.8 vs. 33.3%, p = 0.012). In the TG 200–399 mg/dL group, the reclassification rate of MLDL was significantly lower than that of FLDL as analyzed by the McNemar test (35.3 vs. 64.7, p = 0.031; Table 3). The TG levels of 200–399 mg/dL showed the greatest reclassification rate, especially by FLDL among all of the TG groups based on the Pearson χ2 test (64.7%, p < 0.001; Table 3). Underestimation of FLDL accounted for this reclassification (Fig. 4). In contrast, the reclassification rates by MLDL were 13.1–35.3% in all of the TG groups analyzed by the Pearson χ2 test (p = 0.006). The median and interquartile ranges of differences between DLDL and FLDL gradually increased as TG levels increased (TG <100 mg/dL, 5 [1–9]; TG 100–149 mg/dL, 8 [4–12]; TG 150–199 mg/dL, 11 [7–15], and TG 200–399 mg/dL, 17 [13–22]; p < 0.001). However, the differences between DLDL and MLDL across TG levels were similar to each other (TG <100 mg/dL, 7 [2–11]; TG 100–149 mg/dL, 5 [2–10]; TG 150–199 mg/dL, 4 [−3 to 10], and TG 200–399 mg/dL, 4 [−3 to 10]; p = 0.023).
Table 3.
Reclassification of DLDL by FLDL and MLDL in relation to DLDL or TG levels
| n | FLDL | MLDL | p value | |
|---|---|---|---|---|
| DLDL | ||||
| <70 mg/dL | 17 | 0 (0.0) | 1 (5.9) | n.a. |
| 70–99 mg/dL | 100 | 30 (30.0) | 22 (22.0) | 0.096 |
| 100–129 mg/dL | 106 | 41 (38.7) | 35 (33.0) | 0.286 |
| 130–159 mg/dL | 55 | 10 (18.2) | 15 (17.3) | 0.180 |
| 160–189 mg/dL | 16 | 6 (37.5) | 7 (43.7) | 1.000 |
| ≥190 mg/dL | 5 | 0 (0.0) | 0 (0.0) | n.a. |
| TG levels | ||||
| <100 mg/dL | 141 | 35 (24.8) | 47 (33.3) | 0.012 |
| 100–149 mg/dL | 84 | 16 (19.0) | 11 (13.1) | 0.063 |
| 150–199 mg/dL | 40 | 14 (35.0) | 10 (25.0) | 0.289 |
| 200–399 mg/dL | 34 | 22 (64.7) | 12 (35.3) | 0.031 |
Values are presented as n (%). p values were calculated with the McNemar test. DLDL, directly measured LDL-C; FLDL, LDL-C estimated using the Friedewald equation; MLDL, LDL-C estimated using the Martin method; TG, triglyceride.
Fig. 4.
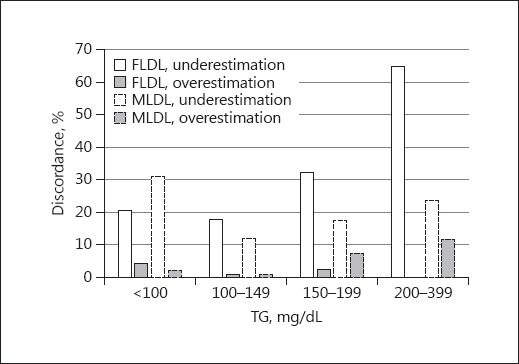
Overall discordance of estimated LDL-C using the Friedewald equation (FLDL) and Martin method (MLDL) according to the TG level by NCEP-ATP III guideline classification.
Discussion
This study showed that LDL-C calculated by the Martin approach had better overall concordance with DLDL compared to that obtained using the Friedewald method in coronary atherosclerosis. The discordance between FLDL and DLDL was mostly due to underestimation, which was most frequently observed when the TG level was ≥200 mg/dL, reaching 64.7%, thereby indicating that the Friedewald method is an inappropriate tool for actual assessment of LDL-C levels.
In this study, the overall concordance of FLDL or MLDL compared with DLDL was lower than that reported from previous studies [18, 20, 22]. The difference could be due to patient groupings, the direct LDL-C measurement method, or race. In this study, the patients were confined to those with coronary atherosclerosis, whereas the patients of previous studies [18, 20, 22] were sampled from the general population. The median age of the patient group in this study was older, and the proportion of male patients was considerably higher compared to previous studies [18, 20, 22]. The older patients in this study could have led to low non-HDL-C measurements, which probably affected FLDL and MLDL differences from DLDL compared to the previous studies [18, 20, 22]. Secondly, the studies by Martin et al. [18] and Meeusen et al. [22] used β-quantification as the reference LDL-C measurement method. Although the direct homogeneous assay showed good performance in a healthy population, all of the direct homogeneous assays on the market have shown unacceptable total error for the diseased group, such as patients with CVD or conditions that might be expected to affect lipoprotein methods [23]. Thirdly, racial differences and related differences in dietary patterns might have affected the TG:VLDL ratio [20] and probably led to low concordance between FLDL and DLDL or MLDL and DLDL in our population compared to that of the previous studies by Martin et al. [18] and Meeusen et al. [22].
Two of the 3 previous studies concluded that MLDL showed better overall concordance [18, 22]. However, Meeusen et al. [22] concluded that overall concordance between DLDL and the 2 LDL-C estimates were similar to each other: 76.9% (95% CI 75.2–79.4) for FLDL versus 77.7% (95% CI 76.0–79.6) for MLDL. In this study, although the overall concordance with DLDL only increased by 2.3% with MLDL compared to FLDL (70.9% [95% CI 65.9–75.9] for FLDL vs. 73.2% [95% CI, 68.2–77.9] for MLDL), the reclassification rate of FLDL was twice as much as that of MLDL when TG was ≥200 mg/dL (64.7 vs. 35.3%; p < 0.031). Martin's original derivation cohort and KNHANES data also showed a significant difference in concordance between DLDL and the 2 LDL-C estimates when the TG level was ≥200 mg/dL (KNHANES 62.0% [95% CI 58.6–65.4] for FLDL vs. 74.6% [95% CI 71.5–77.6] for MLDL; derivation cohort 4,483/11,116 for FLDL vs. 3,761/4,476 for MLDL) [18, 20]. This finding is important because physicians usually rely on FLDL when the TG level is lower than 400 mg/dL [24]. However, in our study, when TG was ≥200 mg/dL, FLDL underestimated 17 mg/dL at the median, indicating that the Friedewald equation is an inappropriate assessment tool for estimating LDL-C in coronary atherosclerosis patients, especially with TG ≥200 mg/dL.
At TG levels below 100 mg/dL, FLDL showed a lower reclassification rate compared to MLDL, implying FLDL estimates LDL-C better than MLDL at low TG levels. This finding suggests that the discordance of FLDL from DLDL resulted from high TG levels in the present study population. A limitation of this study was that the concordance between each LDL-C estimate and DLDL was not analyzed based on TG levels.
Conclusions
In this study, the LDL-C estimated by the Martin method provided better concordance with that measured by a direct homogeneous assay in coronary atherosclerosis. The reclassification rate of FLDL was greatest when TG levels were ≥200 mg/dL; hence, the MLDL method could be an economical method for estimating LDL-C in coronary atherosclerosis, especially when TG levels are ≥200 mg/dL.
References
- 1.World Health Organization Cardiovascular diseases: fact sheet. 2016. http://www.who.int/mediacentre/factsheets/fs317/en/ (accessed March 22, 2017).
- 2.LaMonte MJ, FitzGerald SJ, Church TS, et al. Coronary artery calcium score and coronary heart disease events in a large cohort of asymptomatic men and women. Am J Epidemiol. 2005;162:421–429. doi: 10.1093/aje/kwi228. [DOI] [PubMed] [Google Scholar]
- 3.Detrano R, Guerci AD, Carr JJ, et al. Coronary calcium as a predictor of coronary events in four racial or ethnic groups. N Engl J Med. 2008;358:1336–1345. doi: 10.1056/NEJMoa072100. [DOI] [PubMed] [Google Scholar]
- 4.Catapano AL, Graham I, De Backer G, et al. ESC/EAS guidelines for the management of dyslipidaemias. Eur Heart J. 2016;37:2999–3058. doi: 10.1093/eurheartj/ehw272. [DOI] [PubMed] [Google Scholar]
- 5.Expert Panel on Detection and Treatment of High Blood Cholesterol in Adults Executive summary of the third report of the National Cholesterol Education Program (NCEP) expert panel on detection, evaluation, and treatment of high blood cholesterol in adults (Adult Treatment Panel III) JAMA. 2001;285:2486–2497. doi: 10.1001/jama.285.19.2486. [DOI] [PubMed] [Google Scholar]
- 6.Elshourbagy NA, Meyers HV, Abdel-Meguid SS. Cholesterol: the good, the bad, and the ugly - therapeutic targets for the treatment of dyslipidemia. Med Princ Pract. 2014;23:99–111. doi: 10.1159/000356856. [DOI] [PMC free article] [PubMed] [Google Scholar]
- 7.Nauck M, Warnick GR, Rifai N. Methods for measurement of LDL-cholesterol: a critical assessment of direct measurement by homogeneous assays versus calculation. Clin Chem. 2002;48:236–254. [PubMed] [Google Scholar]
- 8.DeLong DM, DeLong ER, Wood PD, et al. A comparison of methods for the estimation of plasma low- and very low-density lipoprotein cholesterol. The Lipid Research Clinics Prevalence Study. JAMA. 1986;256:2372–2377. [PubMed] [Google Scholar]
- 9.Rifai N, Warnick R, McNamara JR, et al. Measurement of low-density-lipoprotein cholesterol in serum: a status report. Clin Chem. 1992;38:150–160. [PubMed] [Google Scholar]
- 10.Hirany S, Li D, Jialal I. A more valid measurement of low-density lipoprotein cholesterol in diabetic patients. Am J Med. 1997;102:48–53. doi: 10.1016/s0002-9343(96)00375-0. [DOI] [PubMed] [Google Scholar]
- 11.Matas C, Cabré M, Ville AL, et al. Limitations of the Friedewald formula for estimating low-density lipoprotein cholesterol in alcoholics with liver disease. Clin Chem. 1994;40:404–406. [PubMed] [Google Scholar]
- 12.Cohn JS, McNamara JR, Schaefer EJ. Lipoprotein cholesterol concentrations in the plasma of human subjects as measured in the fed and fasted states. Clin Chem. 1988;34:2456–2459. [PubMed] [Google Scholar]
- 13.Wilson PWF, Zech LA, Gregg RE, et al. Estimation of VLDL cholesterol in hyperlipidemia. Clin Chim Acts. 1985;151:285–291. doi: 10.1016/0009-8981(85)90091-9. [DOI] [PubMed] [Google Scholar]
- 14.Friedewald WT, Levy RI, Fredrickson DS. Estimation of the concentration of low-density lipoprotein cholesterol in plasma, without use of the preparative ultracentrifuge. Clin Chem. 1972;18:499–502. [PubMed] [Google Scholar]
- 15.Martin SS, Blaha MJ, Elshazly MB, et al. Friedewald-estimated versus directly measured low-density lipoprotein cholesterol and treatment implications. J Am Coll Cardiol. 2013;62:732–739. doi: 10.1016/j.jacc.2013.01.079. [DOI] [PubMed] [Google Scholar]
- 16.Quispe R, Hendrani A, Elshazly MB, et al. Accuracy of low-density lipoprotein cholesterol estimation at very low levels. BMC Med. 2017;15:83. doi: 10.1186/s12916-017-0852-2. [DOI] [PMC free article] [PubMed] [Google Scholar]
- 17.Grundy SM, Cleeman JI, Merz CN, et al. National Heart and Blood Institute; American College of Cardiology Foundation; American Heart Association Implications of recent clinical trials for the National Cholesterol Education Program Adult Treatment Panel III guidelines. Circulation. 2004;110:227–239. doi: 10.1161/01.CIR.0000133317.49796.0E. [DOI] [PubMed] [Google Scholar]
- 18.Martin SS, Blaha MJ, Elshazly MB, et al. Comparison of a novel method vs the Friedewald equation for estimating low-density lipoprotein cholesterol levels from the standard lipid profile. JAMA. 2013;310:2061–2068. doi: 10.1001/jama.2013.280532. [DOI] [PMC free article] [PubMed] [Google Scholar]
- 19.Chaen H, Kinchiku S, Miyata M, et al. Validity of a novel method for estimation of low-density lipoprotein cholesterol levels in diabetic patients. J Atheroscler Thromb. 2016;23:1355–1364. doi: 10.5551/jat.35972. [DOI] [PMC free article] [PubMed] [Google Scholar]
- 20.Lee J, Jang S, Son H. Validation of the martin method for estimating low-density lipoprotein cholesterol levels in Korean adults: findings from the Korea national health and nutrition examination survey, 2009–2011. PLoS One. 2016;11:e0148147. doi: 10.1371/journal.pone.0148147. [DOI] [PMC free article] [PubMed] [Google Scholar]
- 21.Agatston AS, Janowitz WR, Hildner FJ, et al. Quantification of coronary artery calcium using ultrafast computed tomography. J Am Coll Cardiol. 1990;15:827–832. doi: 10.1016/0735-1097(90)90282-t. [DOI] [PubMed] [Google Scholar]
- 22.Meeusen JW, Lueke AJ, Jaffe AS, et al. Validation of a proposed novel equation for estimating LDL cholesterol. Clin Chem. 2014;60:1519–1523. doi: 10.1373/clinchem.2014.227710. [DOI] [PubMed] [Google Scholar]
- 23.Miller WG, Myers GL, Sakurabayashi I, et al. Seven direct methods for measuring HDL and LDL cholesterol compared with ultracentrifugation reference measurement procedures. Clin Chem. 2010;56:977–986. doi: 10.1373/clinchem.2009.142810. [DOI] [PMC free article] [PubMed] [Google Scholar]
- 24.van Deventer HE, Miller WG, Myers GL, et al. Non-HDL cholesterol shows improved accuracy for cardiovascular risk score classification compared to direct or calculated LDL cholesterol in a dyslipidemic population. Clin Chem. 2011;57:490–501. doi: 10.1373/clinchem.2010.154773. [DOI] [PMC free article] [PubMed] [Google Scholar]