

Abstract

Lanthanide-doped upconversion (UC) phosphors absorb low-energy infrared light and convert it into higher-energy visible light. Despite over 10 years of development, it has not been possible to synthesize nanocrystals (NCs) with UC efficiencies on a par with what can be achieved in bulk materials. To guide the design and realization of more efficient UC NCs, a better understanding is necessary of the loss pathways competing with UC. Here we study the excited-state dynamics of the workhorse UC material β-NaYF4 co-doped with Yb3+ and Er3+. For each of the energy levels involved in infrared-to-visible UC, we measure and model the competition between spontaneous emission, energy transfer between lanthanide ions, and other decay processes. An important quenching pathway is energy transfer to high-energy vibrations of solvent and/or ligand molecules surrounding the NCs, as evidenced by the effect of energy resonances between electronic transitions of the lanthanide ions and vibrations of the solvent molecules. We present a microscopic quantitative model for the quenching dynamics in UC NCs. It takes into account cross-relaxation at high lanthanide-doping concentration as well as Förster resonance energy transfer from lanthanide excited states to vibrational modes of molecules surrounding the UC NCs. Our model thereby provides insight in the inert-shell thickness required to prevent solvent quenching in NCs. Overall, the strongest contribution to reduced UC efficiencies in core–shell NCs comes from quenching of the near-infrared energy levels (Er3+: 4I11/2 and Yb3+: 2F5/2), which is likely due to vibrational coupling to OH– defects incorporated in the NCs during synthesis.
Keywords: upconversion luminescence, nanocrystals, shell growth, lanthanide ions, surface quenching, excited-state dynamics
Upconversion (UC) materials are unconventional color-conversion materials that can absorb low-energy and emit higher-energy photons. Examples include polycyclic aromatic hydrocarbons,1,2 specially designed semiconductor-quantum-dot geometries,3,4 and crystals doped with lanthanide ions.5−7 Of particular interest have been β-NaREF4 nanocrystals (NCs; with RE = Y, Gd, or Lu) doped with either Er3+ or Tm3+ and often co-doped with Yb3+ or other lanthanides to increase absorption or tune the emission wavelength.8−22 Such NCs exhibit narrow-line emissions, and they are photochemically and colloidally stable, making them ideal for background-free biomedical imaging. Moreover, the small size of NCs enables their use in nanoscale designs to enhance the UC luminescence through sensitization13 or plasmon enhancement.23−29 However, the efficiency of UC luminescence is significantly lower for nanocrystalline doped NaREF4 than for the corresponding bulk material, because of excited-state quenching by the NC surface and the environment.10,11,16,19−21,30 The UC efficiency is particularly low in the smallest NCs.11,14,20
Efforts have been made to improve the low UC luminescence efficiency of doped NaREF4 NCs. The common strategy to achieve higher efficiencies is to grow inert nonluminescent shells of undoped NaREF4 (with RE = Y, Gd, or Lu) around the doped upconverting core.11,16 This serves to spatially isolate the active luminescent core from the NC surface and the environment. While this general concept has been well established, a quantitative understanding of UC luminescence quenching in NCs is still lacking. UC in lanthanide-doped crystals is a complicated process, involving (at least) two absorption events, multiple energy-migration and energy-transfer steps, and eventually emission of a high-energy photon. Meanwhile, the efficiency is limited by undesired competing processes such as cross-relaxation, back-transfer, nonradiative decay, and, in the case of NCs, quenching by energy transfer to high-energy vibrations on the surface and/or in the environment of the NCs.10,11,16,18,22,30 To understand UC luminescence from NCs and minimize quenching requires detailed and quantitative studies that unravel the competition between the various processes at play.
Here, we investigate the quenching mechanisms of the various energy levels involved in UC in NaYF4 NCs co-doped with Er3+ and Yb3+, a commonly studied nanocrystalline upconverter showing green and red emissions upon near-infrared excitation.10,13,14,16,18,20,22 The dynamics of the relevant excited states of Er3+ and Yb3+ are measured upon direct excitation in NCs with and without shell, with various dopant concentrations, and dispersed in a range of organic solvents with different refractive index and chemical nature. We observe a pronounced dependence of quenching on the chemical nature of the solvent of the NCs (aliphatic versus aromatic), pointing to Förster transfer to high-energy solvent vibrations as an important quenching mechanism.31,32 Solvent quenching affects all energy levels of Er3+ involved in near-infrared-to-visible UC, but most notably the red-emitting 4F9/2 level. The green emission from the 2H11/2 and 4S3/2 levels is quenched by cross-relaxation and energy migration at higher Er3+ concentrations, while the red emission is hardly affected. The near-infrared levels 4I11/2 (Er3+) and 2F5/2 (Yb3+) are quenched by coupling to the solvent, by coupling to OH-vibrations of hydroxyl ions incorporated in the crystal structure, and by energy migration to the NC surface. The efficiencies of all quenching pathways are suppressed if the refractive index of the solvent is increased, because this enhances the rates of photon emission but not energy-transfer (i.e., quenching) rates.33,34 We develop an analytical model for the various quenching pathways, which matches our experimental results and can predict the emission dynamics and efficiencies for NCs of different (quasi-)spherical core–shell geometries and dopant concentrations.
Results
Solvent-Dependent Decay Dynamics
We study the popular UC material β-NaYF4 co-doped with Er3+ and Yb3+.5,8 Upon excitation of Yb3+ in the near-infrared absorption band at 980 nm, this material emits green light at 520 and 540 nm and red light at 660 nm (Figure 1a). The conversion of low-energy near-infrared photons to higher-energy visible photons is made possible by successive energy-transfer steps from two (or more) Yb3+ ions to Er3+. Both the green and the red UC luminescence can arise after two energy-transfer steps followed by partial nonradiative relaxation (indicated in Figure 1b), although additional pathways involving three energy-transfer steps have been identified leading to red luminescence.35−37 The energy-transfer processes relevant to UC compete with undesired processes such as (multi)phonon relaxation and cross-relaxation that reduce the UC emission. The spectral characteristics of nanocrystalline β-NaYF4 phosphors with diameters down to sub-10 nm (refs (20 and 50)) are similar to those of bulk β-NaYF4, but the emission efficiencies are significantly lower.10,11,19−21,30 In this work we systematically study the energy-loss pathways in UC NCs (Figure 1c, Figure S1 and Table S1) that lead to these lower efficiencies, as a function of the dopant concentration, for core-only and core–shell geometries and for NCs dispersed in a range of solvents.
Figure 1.

(a) UC emission spectrum of β-NaYF4 nanocrystals co-doped with 2% Er3+ and 18% Yb3+ dispersed in cyclohexane, upon laser excitation in the Yb3+: 2F7/2 → 2F5/2 transition at 980 nm. The nanocrystals emit green photons from the 2H11/2 (520 nm) and 4S3/2 (540 nm) states and red photons (660 nm) from the 4F9/2 state. (b) Upon excitation of Yb3+ at 980 nm (dark-red wavy arrows), two consecutive energy-transfer processes (dotted lines) excite an Er3+ ion to a high excited state. Subsequently, after one or more nonradiative decay steps (black arrows) Er3+ can emit a visible photon (red or green wavy arrows). Other, more complicated, sequences of processes also contribute to the population of visible-emitting states.35−37 (c) Transmission electron micrograph of the core-only β-NaYF4:0.1% Er3+ nanocrystals used in this work. Images of other nanocrystal samples and the extracted size distributions are presented in Figure S1 and Table S1. (d) Schematic of solvent quenching, where an excited state on a lanthanide center (here, Er3+) doped in a nanocrystal can decay by transferring energy to high-energy vibrations in the surrounding solvent. (e) The total rate of solvent quenching by dipole–dipole interaction depends strongly on the radial position of the lanthanide center in the nanocrystal, illustrated here for a nanocrystal of 10 nm radius without (red line) and with (blue line) a 3 nm-thick nonluminescent shell. (f) The range of solvents used in our experiments below, with different chemical nature (affecting the solvent-quenching rate; eq 2) and different refractive index (affecting the radiative decay rate; eq 3).
Previous studies have identified that the environment of lanthanide-doped NCs, most notably the solvent, affects luminescence quenching.10,11,18,22,30 It is not always realized that such quenching is a form of Förster energy transfer, by dipole–dipole coupling of an electronic transition of a lanthanide dopant to vibrations of the solvent and ligand molecules (Figure 1d).38 The rate of energy transfer by dipole–dipole coupling, γET, scales with the inverse sixth power of the separation between the energy donor (the luminescent center) and the energy acceptor (the solvent vibration):
| 1 |
where r0 and r are the positions of the donor and acceptor, respectively. The parameter C is the “energy-transfer strength” prefactor, the value of which depends on the energy match of transitions in the lanthanide center to the vibrational energies of the solvent31,32,38 as well as on the oscillator strengths of the donor and acceptor transitions involved.43 The total solvent-quenching rate ΓQ experienced by a luminescent center is determined by its dipole–dipole coupling to all solvent vibrations surrounding the NC, which depends on the diameter of the NC and on the location of the center inside the NC. If we assume that the NC is spherical with an outer radius aout, we obtain a simple expression by integrating eq 1 over all solvent molecules outside the NC:
| 2 |
where Vout is the volume occupied by solvent, r0 = |r0| is the radial position of the Er3+ center, and ρ is the density of solvent vibrations involved in quenching. Interestingly, the amount of quenching depends only on the geometry of the NC (outer radius aout and radial position r0 of the dopant) and on the “quenching density” ρC—the product of the density of vibrations and the energy-transfer strength; units of volume per time—that describes the interaction with the solvent. To avoid that the quenching rate ΓQ becomes infinite at the surface of core-only NCs (r0 = aout in eq 2), we assume throughout this article that the “outer radius” aout (beyond which volume is occupied by solvent) is 0.3 nm larger than the physical radius of the NC as determined by electron microscopy. This 0.3 nm separation can be justified if one realizes that this space of approximately one atom thickness is occupied by species contributing significantly less to vibrational quenching than the solvent does, for example, fluoride anions of the host crystal or headgroups of the ligands (in our experiments, carboxylate head groups of oleate). The solvent-quenching model could be further fine-tuned, at the cost of increased complexity, by considering that the NC can be covered by long-chain organic ligands (in our experiments below, oleic acid) that occupy most of the volume up to 1–1.5 nm distance from the NC surface. Here, we approximate the combination of ligand and solvent as one continuous medium that can be described with a single quenching density ρC. In Figure 1e we plot the solvent-quenching rate normalized to the quenching density ΓQ/ρC. We see that the solvent-quenching rate differs by orders of magnitude between luminescent centers near the surface and those near the center of a core-only NC (red line). Growing a shell of 3 nm thickness can suppress the solvent-quenching rate by a factor 2–1000, depending on the location of a center in the NC (blue line). These pronounced effects of geometry on the quenching rate are manifestations of the strong distance dependence of dipole–dipole coupling. Our model can predict the distribution of solvent quenching rates for any spherical NC geometry (core-only or core–shell) if the quenching density ρC of a particular solvent to a particular dopant’s excited state is known.
In addition to inducing nonradiative quenching, the solvent—through its refractive index n—also affects the radiative decay rate Γrad of dopant centers in NCs:33,34
| 3 |
where Γradbulk is the radiative decay rate in a bulk sample, and nNC is the refractive index of the NC material [here, nNC = 1.48 (ref (39))]. This effect is the same for all luminescent centers inside a NC independent of their exact location, if the NC is (quasi-)spherical and much smaller than the emission wavelength. We measured the values of Γrad for each relevant level on a bulk microcrystalline sample (Figure S2). From these reference values we can calculate the radiative decay rate in any solvent, if we know its refractive index. Throughout this article we will use tabulated refractive indices in the visible, neglecting that they are in fact slightly lower (by at most 0.02 point) in the infrared where the excited states emit (partially). This translates into an acceptable error of <1% in the calculated radiative decay rates in NCs. The series of solvents used in our experiments (Figure 1f) covers a range of refractive indices from n = 1.375 (hexane) to n = 1.627 (carbon disulfide). This corresponds to a 40% variation in radiative decay rate (eq 3). Importantly, however, the solvents are different not only in terms of refractive index but also chemically. The chemical nature of the solvent affects its vibrational spectrum and thereby the dipole–dipole coupling to various Er3+ transitions. We will see below that resonances of the C–H stretch vibrational energy with transitions on the Er3+ ion affect the strength of solvent quenching. Hence, solvent effects manifest as changes in the radiative decay of lanthanide dopants in NCs (through n in eq 3) as well as in nonradiative quenching (through ρC in eq 2).
The total decay rate Γtot of a luminescent center in a nanocrystal is the sum of the rates of all available decay pathways:
| 4 |
where we have written explicitly that the radiative decay rate Γrad depends on the solvent refractive index n and that the solvent-quenching rate ΓQ depends on the radial coordinate r0 of the center in the NC and on the quenching density ρC of the solvent. For now we assume that Γrad and ΓQ are the only decay pathways for the luminescent centers. Assuming that the dopant centers are homogeneously distributed within the NC (which may in fact be not exactly true),40 we obtain the expected decay dynamics of an ensemble of doped NCs by integrating ΓQ over the NC volume:
| 5 |
where a and V are the radius and volume of the luminescent core of the NC, respectively,
| 6 |
is the monoexponential radiative decay component (eq 3), and
| 7 |
is the multiexponential solvent-quenching component to the decay (eq 2).
As we will see below, the decay dynamics of luminescent centers in NCs are accurately described by eq 5 in many cases. In other cases, at higher doping concentrations, additional decay processes become active. One of these is energy migration, that is, hopping of the excited-state energy from center to center. The effect of energy migration on the excited-state dynamics will become apparent in our experimental data. This is however difficult to take into account quantitatively with our microscopic model, because the microscopic rate distributions (e.g., for solvent quenching) are correlated for neighboring ions involved in energy migration. In this work we will therefore discuss the effects of energy migration qualitatively. Another process relevant at high dopant concentrations is cross-relaxation, in which a luminescent center transfers part of its energy to neighbors. The effect of this on the excited-state dynamics of the donor center can be taken into account analytically.41,42 We use that the rate of cross-relaxation energy transfer by dipole–dipole interaction depends on the inverse sixth power of the distance rda between a donor center and an acceptor center. Including this pathway adds a cross-relaxation term ΓX = ∑aCX/rda6 (where prefactor CX describes the “cross-relaxation strength”, and the summation runs over all nearby acceptor centers) to the total decay rate of a donor center (eq 4). To consider all possible local electronic environments of a luminescent center, that is, its separation from nearby acceptor centers, we have to take into account the complicated crystal structure of our β-NaYF4 NCs that has two types of cation sites for rare-earth ions (Y3+ or luminescent dopants), one of which is only 50% occupied.5 If we assume a homogeneous dopant distribution and neglect finite-size effects in the NC,33 then the local electronic environment of a luminescent center (determining ΓX) is uncorrelated with its radial position (determining ΓQ). Under this assumption, the total decay including solvent quenching and cross-relaxation can be written as
| 8 |
where the multiexponential factor X(t) in β-NaYF4 NCs reads as
 |
9 |
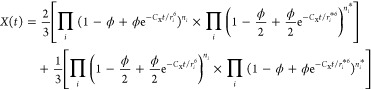
where ϕ is the doping concentration of acceptor centers, that is, the fraction of nonluminescent host cations substituted, and the products run over the (next-)nearest-neighbor shells as determined by the host-crystal structure. This long expression with four products explicitly considers the two different rare-earth cation sites in β-NaYF4, in terms of the neighborlist ri,ni (refs (33, 41, and 42)) for like sites and ri*,ni for unlike sites. In some of our NCs studied below, cross-relaxation takes place with both Er3+ and Yb3+ dopants as energy acceptors. The total decay function for this situation becomes
| 10 |
where each factor Xi(t) (i = Er, Yb) is a function as in eq 9 with ϕ = ϕi and CX = CX,i. Here we neglect correlations in the distribution of cross-relaxation rates to Er3+ neighbors and those to Yb3+ neighbors, which is justified at relatively low doping concentrations. Such correlations become important at the highest doping concentrations, because for any one excited dopant center, the cross-relaxation rates are determined by the occupation of nearby cation sites, which can each contain (apart from an inert Y3+ ion) an Yb3+ acceptor, or an Er3+ acceptor, but not both at the same time.
We note that all nonradiative decay processes considered here—solvent quenching, cross-relaxation, and energy migration—are manifestations of Förster resonance energy transfer by dipole–dipole coupling. For solvent quenching, an excited lanthanide ion in the NC is the energy donor and a vibrational mode in a solvent molecule is the energy acceptor, while for cross-relaxation and energy migration the donor and acceptor are both lanthanide ions. Dipole–dipole coupling has a strong distance dependence scaling with the donor–acceptor distance to the inverse sixth power. This, combined with the random distribution of luminescent dopants in a (nano)crystal, determines the multiexponential nature of the decay dynamics. The dipole–dipole coupling rate also depends on the spectral overlap between the donor transition (i.e., its emission spectrum) and the acceptor transition (i.e., its absorption spectrum), as we will discuss below. Importantly, the efficiency of dipole–dipole coupling—the rate of coupling compared to other decay processes of the donor, such as radiative decay—depends on the oscillator strength of the acceptor transition.43 Since f–f transitions of lanthanide dopants are parity-forbidden, the dipole–dipole coupling to lanthanide acceptors is weak and therefore short-range (Å–nm). This is why cross-relaxation and energy migration are negligible except at higher doping concentrations, when the average distance between dopants is of the order of a nm or less. Many vibrational transitions of organic molecules, on the other hand, are dipole-allowed. As a result, the coupling of a luminescent dopant in a NC to a molecule of the surrounding solvent can be significant, even if the separations are as large as 1–10 nm.
Solvent Quenching of the Visible Emissions
We focus first on the dynamics of the green-emitting [4S3/2; in thermal equilibrium with 2H11/2 (ref (44)); Figure 2a] and red-emitting (4F9/2; Figure 2b) levels in NaYF4 NCs doped with 0.1% Er3+. In these NCs the interactions between Er3+ centers, for example, cross-relaxation or energy migration, are expected to be negligible because the average ion–ion separation is large at low dopant concentrations. The decay dynamics of these levels are multiexponential (Figure S3), signifying that nonradiative decay rates vary among the Er3+ centers as expected in the case of solvent quenching (Figure 1e). As a first simple analysis, we extract the average excited-state decay rates ⟨Γtot⟩ of the green-emitting (Figure 2c) and red-emitting (Figure 2d) levels from single-exponential fits, comparing core-only NCs (filled circles) and core–shell NCs (open circles) in different solvents (colors) to bulk material (black cross). The decay rates in core-only and core–shell NCs (circles) are faster than the decay rate in bulk (cross) for both levels and for all solvents, confirming the presence of nonradiative quenching pathways in NCs. Indeed, the energy gap from both the green- and red-emitting level to the next-lower-energy level is approximately 3000 cm–1 (Figure 2a,b), which can be bridged by coupling to vibrations in organic molecules, such as the C–H stretch vibration. From the fitted decay rates ⟨Γtot⟩ and eq 3 we can estimate the average quantum yield η ≈ Γrad/⟨Γtot⟩ of the Er3+ excited states in NCs, as indicated by the gray “iso-quantum-yield” contours in Figure 2c,d.34 The quantum yields are approximately 55% (75%) for the green-emitting levels in core-only (core–shell) NCs and 15–40% (30–60%) for the red-emitting level in core-only (core–shell) NCs. Clearly, the green emission is quenched less than the red emission. Furthermore, the growth of a nonluminescent shell suppresses quenching, as expected from Figure 1e.11,19,20
Figure 2.

(a) Energy-level scheme of Er3+ with the green emission from the 4S3/2 level (in thermal equilibrium with 2H11/2; ref (44)) indicated as a green arrow and the nonradiative transition to the 4F9/2 level as a black dashed arrow. (b) Same for the red emission from the 4F9/2 level and the competing nonradiative transition to the 4I9/2 level. (c) Average excited-state decay rates ⟨Γtot⟩ of the green-emitting level in NaYF4:0.1% Er3+ NCs dispersed in different solvents (different colors; see Figure 1f), compared to the decay rate in bulk NaYF4:0.1% Er3+ (black cross). Filled circles represent core-only NCs, open circles core–shell NCs. Gray lines are iso-quantum-yield contours plotting η ≈ Γrad(n)/⟨Γtot⟩ with Γrad(n) according to eq 3. (d) Same, but for the red-emitting level. (e) The emission line shapes of the 4S3/2 → 4F9/2 (green) and the 4F9/2 → 4I9/2 (red) transitions of Er3+, which are responsible for nonradiative decay of the green- and red-emitting levels (see panel a), estimated based on the data from ref (45). (f) Infrared absorption spectra of hexane (red), octane (orange), cyclohexane (yellow), chloroform (green), toluene (cyan), chlorobenzene (blue), and o-dichlorobenzene (purple), taken from the SDBS database of the National Institute of Advanced Industrial Science and Technology (AIST), Japan. Dashed lines indicate the approximate spectral position of the C-H stretch vibrational energy in aliphatic (∼2930 cm–1) and aromatic (∼3070 cm–1) molecules. (g) Photoluminescence decay curves of the red-emitting 4F9/2 level upon direct excitation in bulk NaYF4:0.1% Er3+ (gray), compared to core–shell NCs (dark cyan) and core-only NCs (light cyan) of the same composition dispersed in toluene. The inset shows a zoom-in of the first 0.3 ms. Solid lines are fits to the solvent-quenching model (eq 5). (h) Same, but comparing bulk to NCs dispersed in cyclohexane.
If the Er3+ excited states in NCs underwent some quenching mechanism independent of the surrounding solvent, we would observe decay rates Γtot(n) = Γrad(n) + Γnr (with a constant nonradiative component Γnr) that steadily increase with increasing solvent refractive index n. More precisely, the dependence would be approximately linear for refractive indices close to the bulk value (from a series expansion of eq 3):
| 11 |
if Γnr is not affected by the nature of the solvent. For the green-emitting level we observe this approximately linear increase in decay rate with refractive index (Figure 2c), but the decay rate in chloroform (green) is noticeably slower. For the red-emitting level the trend in decay rate as described by eq 11 is not apparent (Figure 2d). Instead, the decay rates in the aliphatic solvents [hexane (red), octane (orange), cyclohexane (yellow)] are nearly a factor of 2 faster than in the other solvents and even faster than in water.18 In fact the difference between the organic solvents considered here is so large that quenching of the red emission in core–shell NCs dispersed in aliphatic solvents is similar to quenching of core-only NCs in the aromatic solvents.
We can qualitatively understand this difference in quenching rate between aliphatic and aromatic solvents by considering their vibrational energy spectra. The highest-energy vibrational modes in hydrocarbon molecules are CH-stretch modes with energies around 3000 cm–1. This nearly matches the energies of the 4S3/2 → 4F9/2 and 4F9/2 → 4I9/2 transitions of Er3+ (Figure 2e),45 which are involved in the nonradiative decay of the green- and red-emitting levels. Since we interpret solvent quenching as dipole–dipole coupling between the excited Er3+ ion and solvent vibrations, the coupling strength should scale with the oscillator strength of the vibrational mode, the oscillator strength of the relevant Er3+ transition, and its spectral overlap of the vibrational mode with the Er3+ transition.43 Indeed, the oscillator strength of the 4F9/2 → 4I9/2 transition is approximately 5× larger than that of the 4S3/2 → 4F9/2 transition [2.79 × 10⁻⁷versus 6.32 × 10⁻⁸ (ref (45))], consistent with the 4–10× faster solvent quenching (depending on the solvent; Figure 2c,d and Figure S3). More importantly, the significantly stronger quenching of the red emission in aliphatic solvents than in aromatic solvents is explained by the energy resonance of the 4F9/2 → 4I9/2 transition with the CH-stretch vibrational spectra of the solvents (Figure 2f). While the aliphatic solvents (CH-stretch at ∼2930 cm–1) have good spectral overlap with the 4F9/2 → 4I9/2 transition resulting in strong quenching, the aromatic solvents (CH-stretch at ∼3070 cm–1) have less overlap resulting in weaker quenching.
Based on these clear indications of solvent-related quenching confirming results from previous studies,10,11,18,22,30 we use the solvent-quenching model introduced above (eq 5) to quantify the quenching behavior in the different solvents. As illustrative examples, we analyze the decay dynamics of the red emission from NaYF4:0.1% Er3+ NCs dispersed in aromatic toluene (Figure 2g) and in aliphatic hexane (Figure 2h). Figure S3 shows the results for other solvents and for the green emission. We compare core-only NCs (lighter colors) to core–shell NCs (darker colors) and bulk material (gray). The decay dynamics in NCs are clearly multiexponential, while those in the bulk material are not. The solvent-quenching model (solid lines) matches this multiexponential behavior very well using the quenching density ρC as the only fit parameter. More precisely, the reduced χ2 parameters representing the fit quality are 1.22 ± 0.08 for green emission from core-only NCs, 1.08 ± 0.05 for green emission in core–shell NCs, 1.56 ± 0.19 for red emission from core-only NCs, and 1.26 ± 0.16 for red emission in core–shell NCs (mean ± standard deviation over eight solvents; Figure S3). The solvent-quenching model captures the effect of shell growth particularly well,11,19,20 as evidenced by the very similar values for ρC fitted on the core-only and core–shell dynamics (Figure S3d,h). This means that, if the quenching density ρC is known for a particular dopant excited state in a particular solvent, the model can predict the solvent-quenching behavior for any (quasi-)spherical core–shell NCs, or even—with adaptations—for other shapes.46 For example, the model predicts that a 9 nm inert shell is required to suppress solvent quenching of the green luminescence from 20 nm-diameter NCs in hexane and achieve higher than 95% luminescence quantum yield (at low doping concentration, in the limit of negligible cross-relaxation), while it requires a 20 nm shell to achieve the same for the red luminescence (Figure 5).
Figure 5.

(a–c) The quantum yields of the various emitting levels in NaYF4:Er3+,Yb3+ UC NCs as a function of shell thickness. We consider (a) the green Er3+ emission from the 4S3/2 level, (b) the red Er3+ emission from the 4F9/2 level, and (c) near-infrared Yb3+ emission from the 2F5/2 level. Data points are obtained by integrating experimental photoluminescence decay curves (eq 12) from core-only NCs (filled symbols) or core–shell NCs (open symbols). We compare NCs dispersed in hexane (red), chlorobenzene (blue), and carbon disulfide (gray) and NCs doped with low concentration of the active center (0.1%; circles) to NCs co-doped with 2% Er3+ and 18% Yb3+ (squares). Lines are predictions from our solvent-quenching model for the green- and red-emitting levels at low doping (solid lines) and high doping (dashed lines; only distinct for the green emission). (d) Simplified model of UC with a ground state (0), an intermediate excited state (NIR), and a highest excited state (VIS). Arrows indicate excitation, decay, and energy-transfer processes.
Ion–Ion Interactions at Higher Doping Concentrations
While NCs doped at low concentrations of 0.1% are ideal to study the fundamentals of solvent quenching, NCs must be doped at higher concentrations to achieve optimal UC efficiencies.47 The average dopant–dopant separations are shorter, thus enhancing the rates and efficiencies of a variety of energy-transfer processes. These include the various energy-transfer processes that are necessary to achieve UC, but also undesired energy-loss pathways such as cross-relaxation and energy migration to the NC surface. The UC brightness and efficiency are determined by a subtle balance between the impact of these different energy-transfer processes.
Figure 3a shows the average decay rate (from a simple single-exponential fit to the dynamics) of the green emitting level in NCs with different doping concentrations: 0.1% Er3+ (left), 2% Er3+ (middle), and 2% Er3+ + 18% Yb3+ (right). The decay rates increase significantly going from the low-doped sample to the higher doping concentrations, both in NCs (colored bars) and in the bulk material (white line). This is mostly the result of cross-relaxation, which occurs between dopant centers at typical separations of 1 nm and closer42 and is therefore similar in 20 nm-diameter NCs to bulk material. However, we also see that the absolute difference in decay rate between core-only (dark-colored bars) and core–shell NCs (light-colored bars) increases with increasing Er3+ concentration. This signifies that the surface-related contribution to the total decay becomes stronger. We ascribe this to energy migration from Er3+ to Er3+ ion within the NC, which allows the excited-state energy to reach the NC surface where it is quenched rapidly by solvent vibrations (Figure 3e). Migration becomes stronger at higher Er3+ concentrations (compare 0.1% Er3+ and 2% Er3+), but its effect on the decay of the green luminescence is minimized when the energy can no longer reach the surface (compare core-only and core–shell).
Figure 3.

(a) The average decay rate of the green-emitting level 4S3/2 for core–shell NCs (dark-colored bars) and core-only NCs (light-colors bars) with different doping concentrations (as indicated) and dispersed in different solvents (different colors), obtained from a single-exponential fit to the decay dynamics. White horizontal lines indicate the corresponding average decay rate in the bulk material. (b) Same for the red-emitting level 4F9/2. (c) Possible cross-relaxation pathways from the green-emitting levels of Er3+ to neighboring Er3+ or Yb3+ ions in the ground state. (d) Same for the red-emitting level of Er3+, where all of the possible cross-relaxation pathways exhibit a large energy mismatch between the donor and acceptor transition. (e) Schematic representation of energy migration (i.e., hopping) among Er3+ ions to the NC surface. (f) Photoluminescence decay curves of the green Er3+ emission in core–shell NCs dispersed in toluene, with doping concentrations of 0.1% Er3+ (black), 2% Er3+ (blue), and 2% Er3+ + 18% Yb3+ (green). Solid lines are fits to our model including solvent quenching and cross-relaxation (eqs 8 and 10). The inset shows a zoom-in on the first 0.2 ms. (g) Same for the green emission from core-only NCs. (h) Same for the red emission from core-only NCs, doped with 0.1% Er3+ (black), 2% Er3+ (yellow), and 2% Er3+ + 18% Yb3+ (red).
Surprisingly, the decay dynamics of the red emission do not accelerate with increasing dopant concentrations, neither in NaYF4 NCs nor in the bulk material (Figure 3b). Hence, while the green-emitting levels are quenched by cross-relaxation and energy migration, the red-emitting level is not. In fact, the quenching seems to decrease for the highest dopant concentrations, but this is an artifact due to the slightly larger sizes of our highly doped NCs (21.6 nm versus ∼19 nm diameter for the lower concentrations; Table S1), resulting in reduced solvent quenching. We can understand why cross-relaxation has a stronger effect on the green-emitting level than on the red-emitting level from the energy-level structures of Er3+ and Yb3+ (Figure 3c,d). Near-perfect energy matching is possible for cross-relaxation from the green-emitting levels of Er3+ to neighboring Er3+ ions in the ground state (blue and yellow arrows in Figure 3c), and a small mismatch exists for cross-relaxation to a neighboring ground-state Yb3+ ion (blue arrows). In contrast, possible cross-relaxation pathways of the red-emitting level of Er3+ all exhibit a larger energy mismatch (Figure 3d) and should therefore be significantly less efficient. This is consistent with previous studies on bulk NaYF4 crystals doped with Er3+.6
To more quantitatively analyze
the quenching dynamics in NaYF4 NCs doped with high concentrations
of Er3+ and
Yb3+, we fit the photoluminescence decay dynamics to our
full model including radiative decay, solvent quenching, and cross-relaxation
(eq 8 for NCs doped with
only Er3+ or eq 10 for NCs co-doped with Er3+ and Yb3+). Figure 3f shows
the decay of the green emission in core–shell NCs dispersed
in toluene and doped with 0.1% Er3+ (black), 2% Er3+ (blue), or co-doped with 2% Er3+ and 18% Yb3+ (green). In modeling the experimental data, we introduce
only two new fit parameters, the cross-relaxation strengths CEr and CYb, while
keeping the other parameters fixed based on the solvent-quenching
analysis above (see Figure 2). Our model (solid lines) matches the experimental data very
well using fit parameters CEr = 9.8 ×
105 Å6 ms–1 and CYb = 3.2 × 10³ Å6 ms–1 (see Figure S4 for fit results for the other solvents). This corresponds to a critical
Förster radius  of 9.2 Å for Er3+–Er3+ cross-relaxation, a typical value
for Förster transfer
to a lanthanide acceptor.42,51 For Er3+–Yb3+ cross-relaxation we obtain 3.5 Å, somewhat
shorter because of the energy mismatch for this pathway (Figure 3c). Alternatively,
we can calculate a rate of 308 ms–1 for cross-relaxation
from the green-emitting levels (2H11/2 and 4S3/2) to a nearest-neighbor Er3+ ion
or 1.0 ms–1 to a nearest-neighbor Yb3+ ion, compared to a radiative decay rate of 1.6 ms–1 for NCs in toluene. Figure S5 confirms
that quenching of the green emission at high Er3+ concentration
is mainly due to cross-relaxation, not for example energy migration
to the surface,21 because we can perfectly
reproduce the experimental decay curves from bulk NaYF4 doped with high Er3+ concentration assuming only radiative
decay and cross-relaxation, with all parameters fixed. This also confirms
that the distribution of donor–acceptor distances, which determines
the cross-relaxation rates, in our NCs is similar to bulk material.
Hence, if our NCs show deviations from a statistical distribution
of dopant ions as reported by Dong et al.,40 these are not strong enough to affect the interactions
between dopants significantly.
of 9.2 Å for Er3+–Er3+ cross-relaxation, a typical value
for Förster transfer
to a lanthanide acceptor.42,51 For Er3+–Yb3+ cross-relaxation we obtain 3.5 Å, somewhat
shorter because of the energy mismatch for this pathway (Figure 3c). Alternatively,
we can calculate a rate of 308 ms–1 for cross-relaxation
from the green-emitting levels (2H11/2 and 4S3/2) to a nearest-neighbor Er3+ ion
or 1.0 ms–1 to a nearest-neighbor Yb3+ ion, compared to a radiative decay rate of 1.6 ms–1 for NCs in toluene. Figure S5 confirms
that quenching of the green emission at high Er3+ concentration
is mainly due to cross-relaxation, not for example energy migration
to the surface,21 because we can perfectly
reproduce the experimental decay curves from bulk NaYF4 doped with high Er3+ concentration assuming only radiative
decay and cross-relaxation, with all parameters fixed. This also confirms
that the distribution of donor–acceptor distances, which determines
the cross-relaxation rates, in our NCs is similar to bulk material.
Hence, if our NCs show deviations from a statistical distribution
of dopant ions as reported by Dong et al.,40 these are not strong enough to affect the interactions
between dopants significantly.
The effect of concentration quenching due to energy migration becomes apparent from the green emission dynamics from core-only NCs (Figure 3g). Our model, using the fit parameters for solvent quenching and cross-relaxation we have determined before, matches the emission dynamics shortly after the laser pulse well (inset). At later times (t > 0.2 ms) the experimental decay from NCs with high Er3+ doping (blue and green) is clearly faster than the model predicts. This is the result of energy migration, which provides a decay pathway for the excited Er3+ dopants in the NC center (Figure 3e) that would otherwise decay slowly. Energy migration from Er3+ to Er3+ can occur also in core–shell NCs. However, the effect on the emission dynamics is less significant (Figure 3f), because the undoped shell prevents migration to the NC surface. This means that our model of solvent quenching plus cross-relaxation can accurately predict the dynamics and quantum yield of green Er3+ emission at high dopant concentrations in core–shell NCs, but will overestimate the green-emission quantum yield in core-only NCs. Modeling the effect of energy migration quantitatively is beyond the scope of this article, but can be an interesting follow-up work.
The decay dynamics of the red emission from core-only NCs at high dopant concentrations (Figure 3h) are accurately predicted by the solvent-quenching model (eq 5; quenching density ρC fixed) without introducing cross-relaxation as an additional decay pathway. A small deviation between experiment and model at late times indicates that some concentration quenching and energy migration takes place in the red (i.e., among 4F9/2 levels), but weaker than in the green (i.e., among 2H11/2 and 4S3/2 levels). This modeling of the red emission dynamics is consistent with our earlier conclusion that the red emission is hardly affected by cross-relaxation or energy migration.
Quenching of the Infrared Emissions
We now turn our attention to the near-infrared energy levels of Er3+ (4I11/2) and Yb3+ (2F5/2). Figure 4a shows the average decay rate (from a simple single-exponential fit) of the near-infrared emission (∼1000 nm) from the Er3+4I11/2 level in NCs doped with 2% Er3+. The decay rates, depending on the solvent, are approximately 1 ms–1 for core–shell NCs (open circles) and 6 ms–1 for core-only NCs (filled circles), compared to 0.13 ms–1 in the bulk material (at 0.1% Er3+; Figure S2). This means that the 4I11/2 level is strongly quenched in NCs, to ∼10% quantum yield for core–shell NCs and ∼2% quantum yield for core-only NCs. Quenching by cross-relaxation to neighboring Er3+ ions can be excluded, because the energy-level structure of Er3+ makes energy-conserving cross-relaxation pathways impossible (see also Figure S6). The quenching of core-only NCs is somewhat dependent on the chemical nature of the solvent, with the aliphatic solvents showing slightly faster decay rates and chloroform showing a slower decay rate. However, for core–shell NCs the linear refractive index dependence of decay rates indicates a solvent-independent nonradiative component (eq 11). Moreover, the solvent-quenching model fails to reproduce the decay dynamics of the Er3+ near-infrared emission in core-only and core–shell NCs with a single value for the quenching density (Figure 4b). We propose therefore that the major contributor to quenching of the near-infrared-emitting Er3+ level, especially in core–shell structures, is energy transfer to OH-vibrations. Indeed, the vibrational energy of approximately 3500 cm–1 precisely matches the 4I11/2–4I13/2 energy gap, thus explaining why quenching is strong. OH– ions likely substitute some native F– sites of the NC during the synthesis, where NaOH is used as a Na+ source. Indeed, preventing the inclusion of oxygen in NaYF4 crystals is notoriously difficult.5 New synthesis procedures20 using Na-oleate instead of NaOH as Na+ source can potentially prevent this and thus suppress quenching of the Er3+4I11/2 level.
Figure 4.

(a) Average decay rates ⟨Γtot⟩ of the near-infrared-emitting 4I11/2 level of Er3+ in core-only NCs (filled circles) and core–shell NaYF4 NCs (open circles) doped with 2% Er3+ and dispersed in different solvents, as determined from single-exponential fits. Gray lines are iso-quantum-yield contours plotting η ≈ Γrad(n)/⟨Γtot⟩, based on the bulk decay rate (black cross). (b) Photoluminescence decay curves of the near-infrared emission from core-only (blue) and core–shell (red) NaYF4:2% Er3+ NCs dispersed in toluene. Inset is a zoom-in. Solid lines show an attempt to fit our solvent-quenching model (eq 5) to the experiments using one value for ρC. (c) Same as in (a), but for the 2F5/2 level of Yb3+. Filled symbols represent core-only NCs, open symbols core–shell NCs. The NCs have dopant concentrations of 0.1% Yb3+ (squares), 18% Yb3+ (triangles), or 2% Er3+ plus 18% Yb3+(diamonds). The Er3+ and Yb3+ emissions cannot be spectrally distinguished for the co-doped NCs, so the recorded signal will contain contributions from both. The iso-quantum-yield contours are based on the bulk decay rate of Yb3+ (black cross). (d) A cartoon of rapid energy transfer and energy back-transfer between Er3+ and Yb3+ centers. (e) Photoluminescence decay curves of the near-infrared Yb3+ emission in NCs doped with 0.1% Yb3+ (red), 18% Yb3+ (green), or co-doped with 2% Er3+ and 18% Yb3+ (blue). The signal recorded from the co-doped NCs consists for a small part of 4I11/2 emission from Er3+ ions. This constitutes an estimated <5% of the total emission, based on the elemental ratio 2/18 and the ratio of radiative decay rates (Figure S2).
Figure 4c shows the average decay rate of the near-infrared emission from Yb3+ in NCs doped with various dopant concentrations, comparing core-only to core–shell NCs. NCs doped with 0.1% Yb3+, with either core-only or core–shell geometry, show mainly radiative decay with a rate close to that in the bulk material. We conclude from this that solvent quenching by dipole–dipole coupling is negligible for the 2F5/2 excited state, and we can therefore not use the solvent-quenching model. This was to be expected, because Yb3+ is effectively a two-level system with an energy gap of approximately 10,000 cm–1, that is, over three times the highest vibrational energy in hydrocarbon molecules. At higher doping concentrations the Yb3+ decay is faster and strongly dependent on the NC geometry (core-only versus core–shell). Clearly, the Yb3+ luminescence is quenched by some pathway involving the NC surface that becomes more efficient at higher doping concentration. Undercoordinated Yb3+ centers at the NC surface could be possible quenching sites, explaining the strong concentration dependence of quenching (compare core-only NCs with 0.1% and 18% Yb3+). Higher Yb3+ concentrations would simultaneously increase the number of such defect sites per NC and enable energy migration toward them. Co-doping Er3+ and Yb3+ is likely to lead to rapid energy transfer and energy back-transfer between the nearly resonant Yb3+:2F5/2 and Er3+:4I11/2 levels (Figure 4d). As a result, the effective energy migration is enhanced, and the strong quenching pathways of Er3+ (likely by coupling to OH-vibrations; see above) become available to the Yb3+ excited state. This explains why the decay rate of near-infrared excited states in NCs co-doped with 2% Er3+ plus 18% Yb3+ is enhanced by a factor 2 compared to those doped with only 18% Yb3+ (Figure 4c). The luminescence decay curves of the near-infrared emissions at high dopant concentrations are close to single-exponential (Figure 4e). This confirms that fast migration averages out the inhomogeneities in decay pathways between the luminescent centers (e.g., those near the NC surface versus those in the center), resulting in one “effective” decay rate for all centers.43
Discussion
In Figure 5 we summarize the quantum yields of the various emitting levels involved in UC by the Er3+–Yb3+ couple in NaYF4 NCs, as a function of shell thickness, doping concentration, and solvent. The data points represent experimental quantum yields determined by integrating the experimental photoluminescence decay curves:34
| 12 |
where I(0) is the photoluminescence intensity at t = 0 and Γrad is the radiative decay rate of the emitting level, estimated from the decay rate in bulk NaYF4 (Figure S2) and correcting for solvent refractive index (eq 3). Similarly, the lines are predictions of our model including solvent quenching and cross-relaxation, obtained by integrating the theoretical decay curves (eq 5 or 10) for UC NCs with a core diameter of 20 nm. The model reproduces the increase in quantum yield with increasing shell thickness (open versus filled symbols) and with increasing solvent refractive index [from hexane (red) to chlorobenzene (blue) to carbon disulfide (gray)]. It predicts that, because of strong solvent quenching, the quantum yield of the red luminescence can be further increased with even thicker shells than we used in the experiments presented here (requiring up to 20 nm thickness for 95% luminescence quantum yield, depending on the solvent). For the green Er3+ emission, our model reproduces the dependence on dopant concentration [0.1% Er3+ (circles) versus 2% Er3+ plus 18% Yb3+ (squares)]. The red-emission quantum yield does not show a significant dependence on doping concentration, because it is not quenched by cross-relaxation or energy migration. On the other hand, strong quenching due to cross-relaxation causes the quantum yield of the green emission in high-doping NCs to saturate at approximately 20% for shells >3 nm. Qualitatively, it is clear that the near-infrared Yb3+ emission becomes more efficient with increasing shell thickness, with increasing solvent refractive index, and with lower doping concentration. However, we cannot model this quantitatively because this emission is quenched by other mechanisms than dipole–dipole coupling to solvent vibrations.
To get an idea of what our results imply for the efficiency of UC luminescence from NaYF4 NCs, we consider a simplified three-level model for the UC process (Figure 5d).48 In reality Er3+–Yb3+-based UC is of course much more complex, involving more energy levels and multiple energy-transfer pathways depending on excitation power.49 Our simplified model consists of a ground state ‘0’, a first excited state “NIR” in the near-infrared, and a second excited state “VIS” that can emit visible photons. Excitation into the intermediate level and energy-transfer UC to the highest excited state, with rate constants Γexc and ΓUC, respectively, in combination with radiative and nonradiative decay of the states NIR and VIS lead to the following set of rate equations:
| 13 |
| 14 |
where NNIR and NVIS are the populations in the intermediate and in the highest excited state, and Γitot denotes the total decay rate (radiative + nonradiative) of state i. The visible UC luminescence is proportional to IUC ∝ ΓVISNVIS. Solving the rate equations for steady-state conditions yields for the UC luminescence to second order in Γexc/ΓNIRtot, that is, in the limit of weak excitation, that
| 15 |
We see that the UC intensity is quadratically dependent on the quantum yield ηNIR of the intermediate near-infrared-emitting level and linearly on the quantum yield ηVIS of the highest visible-emitting level. We thus conclude that the major contribution to low UC efficiencies in NCs compared to bulk material10,11,19,20 comes from losses in the near-infrared, in line with the interpretation of Hossan et al.,49 not only because the near-infrared-emitting levels are quenched strongly at high doping concentrations (Figure 5c) but also because losses in the infrared affect the overall UC intensity more strongly than losses in the visible. Shell growth improves the quantum yields in the near-infrared at high doping concentration by as much as a factor ∼10 in our experiments (Figure 5c), which translates into a ∼100 increase in UC intensity according to eq 15. Additionally, the shell improves the UC intensity further by a smaller factor ∼2 by increasing the quantum yield in the visible (depending on the color considered and on the solvent; Figure 5a,b). The beneficial effect of shell growth on the UC intensities thus comes mainly from the inhibition of quenching in the near-infrared. We ascribe residual quenching in the infrared in core–shell NCs with a 3 nm shell to coupling of the 4I11/2 level of Er3+ to OH-vibrations of embedded hydroxide ions, which can potentially be prevented with improved synthesis procedures that avoid hydroxides and water.20 The Yb3+2F5/2 level is indirectly quenched by the same pathway, because at high doping concentrations the Yb3+2F5/2 and Er3+4I11/2 levels rapidly exchange energy by transfer and back-transfer. Quenching of the red-emitting 4F9/2 level of Er3+ is due to solvent quenching and can be further suppressed with thicker shells (solid lines in Figure 5b) than the 3 nm we consider here or by excluding high-energy vibrations in the environment. Quenching of the green-emitting 4S3/2 and 2H11/2 levels at high doping concentration relevant to UC is mainly due to cross-relaxation to Er3+ neighbors (blue and yellow pathways in Figure 3c) and cannot be avoided by growing thicker shells. Indeed, also bulk material suffers from this loss pathway (Figure S5).6
Our systematic analysis of the decay dynamics of the various levels involved in Er3+–Yb3+-based UC provides important insights into the quenching pathways relevant to UC. However, many additional effects have to be considered for a full quantitative understanding of UC under all experimental conditions. For example, some studies have proposed complex population pathways for the red-emitting level, involving multiple multiphonon and/or energy-transfer processes.35−37 Moreover, at high excitation powers the state populations can saturate, and levels higher in energy than the green- or red-emitting ones become involved in the energy-transfer and cross-relaxation pathways.15,50 It is also important to consider that cross-relaxation and nonradiative recombination steps may not necessarily lead to irreversible energy loss, but the energy may be used in a next energy-transfer UC step. Further, the quantum yields of near-infrared and visible emission of a particular Er3+ center may be correlated, for example, if it is located near the NC surface.49 This and other variations of and correlations between the rates of various UC steps can only be taken into account fully with a microscopic theoretical model that considers individual luminescent centers (e.g., Er3+ and Yb3+) explicitly,51 as an alternative to the more common mean-field models.35,52
Conclusion
In summary, we have presented a detailed study on the excited-state dynamics in NaYF4 upconversion nanocrystals co-doped with Er3+ and Yb3+. By systematically varying important parameters such as doping concentration and the nature of the solvent, we were able to identify quenching pathways and energy-transfer processes responsible for the reduced upconversion efficiency in nanocrystals. A microscopic model was developed to provide quantitative insight in the contribution of quenching by molecular vibrations (ligands, solvent) and cross-relaxation processes. For the green and red Er3+ emission, the model accurately reproduces the observed decay dynamics and also demonstrates how the solvent quenching strength depends on resonances between solvent vibrational modes and electronic transitions on the Er3+ ion. Growing an undoped shell around the upconversion core reduces solvent quenching, and with the model the shell thickness required for a near-complete suppression of solvent quenching can be determined. For the near-infrared emission, the agreement between the observed excited-state dynamics and our model is not satisfactory. The systematic deviation indicates the presence of an additional quenching process. Based on the resonance of the O-H stretch vibrational energy and a transition on Er3+ for the IR emitting level, we propose that OH– incorporated on F– sites in NaYF4 nanocrystals is responsible. For core–shell nanocrystals, the most significant improvement in upconversion efficiency can be achieved by suppressing quenching of the near-infrared-emitting level which may be realized by alternative synthesis strategies that prevent incorporation of OH– in the NaYF4 lattice.
Methods
Nanocrystal Synthesis
The NaYF4 core nanocrystals (NCs) doped with Er3+ and/or Yb3+ were synthesized following the procedure from ref (53) with modifications based on ref (54). A mixture of REAc3 (4 mmol; with RE = Y, Er, Yb in the desired ratio) in oleic acid (24 mL) and 1-octadecene (68 mL) was degassed at 120 °C under vacuum for 90 min and then allowed to cool down to room temperature under nitrogen atmosphere. A solution of NaOH (10 mmol) and NH4F (16 mmol) in methanol (40 mL) was injected into the reaction mixture under nitrogen, which was then stirred overnight at room temperature. Next, the methanol was removed by evaporation at 100 °C under vacuum for 30 min. The reaction mixture was then quickly heated to 300 °C for 110 min under nitrogen atmosphere while stirring, during which the NaYF4 NCs form. After cooling down, the NCs were washed three times by precipitation with ethanol, centrifugation, and redispersing them in cyclohexane. In the second to last washing step, a mixture of cyclohexane (12 mL) and oleic acid (12 mL) was used to redisperse the NCs to increase ligand coverage of the surface and improve the colloidal stability. The final product was dispersed in approximately 12 mL of cyclohexane.
Core–shell NCs were synthesized by growing a nonluminescent NaYF4 shell around (co)doped cores using the method of ref (54). A solution of YAc3 (1.5 mmol) in oleic acid (9 mL) and 1-octadecene (25.5 mL) was degassed at 120 °C under vacuum for 60 min. The temperature was then decreased to 80 °C under nitrogen, and 5.5 nmol of core particles was added (estimated from transmission electron microscopy and the dry weight of the cyclohexane stock dispersion). Cyclohexane was removed at 100 °C under vacuum. The reaction mixture was then allowed to cool down to room temperature, a solution of NaOH (3.75 mmol) and NH4F (6 mmol) in methanol (15 mL) was added, and the mixture was stirred overnight. Next, methanol was evaporated at 100 °C under vacuum for 10 min. The reaction mixture was then quickly heated to 300 °C under nitrogen for 120 min before cooling down to room temperature. The NCs were washed three times by precipitation with ethanol, centrifugation, and redispersing them in cyclohexane. In the second to last washing step, a mixture of cyclohexane (3 mL) and oleic acid (3 mL) was used to redisperse the NCs to increase ligand coverage of the surface and improve the colloidal stability. The final product was dispersed in approximately 1.7 mL of cyclohexane.
Microcrystalline powders of (co)doped β-NaYF4 were prepared as described in ref (5).
Spectroscopic Experiments
Photoluminescence decay dynamics of the various Er3+ and Yb3+ emissions were recorded using an Edinburgh Instruments FLS920 fluorescence spectrometer. The samples were excited with 10 ns pulses (20 Hz) from a color-tunable optical parametric oscillator (OPO) system (Opotek HE 355 II) pumped by the third harmonic of a Nd:YAG laser. The luminescence was detected with a Hamamatsu H74220–60 photomultiplier tube for visible wavelength or with a N2-cooled R5507-73 photomultiplier tube for the near-infrared. To measure the decay dynamics of a certain energy level, we tuned the excitation laser on the same level but a few nm blue-shifted from the detection wavelength, except for the green emission where we excited in the 2H11/2 level and detected emission from the 4S3/2 level. These levels are thermally coupled and show the same decay dynamics.44 To minimize reabsorption of emitted light, the NCs were dispersed in an organic solvent at low concentration, while the microcrystalline powders were diluted with white BaSO4 powder, typically to 1% w/w or lower.
Acknowledgments
The work was supported by The Netherlands Center for Multiscale Catalytic Energy Conversion (MCEC), an NWO Gravitation programme funded by the Ministry of Education, Culture and Science of the government of The Netherlands. F.T.R. acknowledges financial support from The Netherlands Organisation for Scientific Research NWO (VENI grant number 722.017.002). P.V.-D. acknowledges financial support from the Swiss National Science Foundation SNSF (grant number P2BEP2_172238). We are grateful to R. Brechbühler for critical reading of the manuscript.
Supporting Information Available
The Supporting Information is available free of charge on the ACS Publications website at DOI: 10.1021/acsnano.8b01545.
Tranmission electron microscopy of the upconversion nanocrystals, photoluminescence decay of bulk material, and a complete data set and modeling of excited-state decay dynamics of the visible-emitting levels (PDF)
The authors declare no competing financial interest.
Supplementary Material
References
- Cao X.; Hu B.; Zhang P. High Upconversion Efficiency from Hetero Triplet–Triplet Annihilation in Multiacceptor Systems. J. Phys. Chem. Lett. 2013, 4, 2334–2338. 10.1021/jz401213w. [DOI] [Google Scholar]
- Wu M.; Congreve D. N.; Wilson M. W. B.; Jean J.; Geva N.; Welborn M.; Van Voorhis T.; Bulović V.; Bawendi M. G.; Baldo M. A. Solid-State Infrared-to-Visible Upconversion Sensitized by Colloidal Nanocrystals. Nat. Photonics 2016, 10, 31–34. 10.1038/nphoton.2015.226. [DOI] [Google Scholar]
- Deutsch Z.; Neeman L.; Oron D. Luminescence Upconversion in Colloidal Double Quantum Dots. Nat. Nanotechnol. 2014, 8, 649–653. 10.1038/nnano.2013.146. [DOI] [PubMed] [Google Scholar]
- Makarov N. S.; Lin Q.; Pietryga J. M.; Robel I.; Klimov V. I. Auger Up-Conversion of Low-Intensity Infrared Light in Engineered Quantum Dots. ACS Nano 2016, 10, 10829–10841. 10.1021/acsnano.6b04928. [DOI] [PubMed] [Google Scholar]
- Krämer K. W.; Biner D.; Frei G.; Güdel H. U.; Hehlen M. P.; Lüthi S. R. Hexagonal Sodium Yttrium Fluoride Based Green and Blue Emitting Upconversion Phosphors. Chem. Mater. 2004, 16, 1244–1251. 10.1021/cm031124o. [DOI] [Google Scholar]
- Suyver J. F.; Grimm J.; van Veen M. K.; Biner D.; Krämer K. W.; Güdel H. U. Upconversion Spectroscopy and Properties of NaYF4 Doped with Er3+, Tm3+ and/or Yb3+. J. Lumin. 2006, 117, 1–12. 10.1016/j.jlumin.2005.03.011. [DOI] [Google Scholar]
- Martín-Rodríguez R.; Fischer S.; Ivaturi A.; Froehlich B.; Krämer K. W.; Goldschmidt J. C.; Richards B. S.; Meijerink A. Highly Efficient IR to NIR Upconversion in Gd2O2S:Er3+ for Photovoltaic Applications. Chem. Mater. 2013, 25, 1912–1921. 10.1021/cm4005745. [DOI] [Google Scholar]
- Heer S.; Kömpe K.; Güdel H.-U.; Haase M. Highly Efficient Multicolour Upconversion Emission in Transparent Colloids of Lanthanide-Doped NaYF4 Nanocrystals. Adv. Mater. 2004, 16, 2102–2105. 10.1002/adma.200400772. [DOI] [Google Scholar]
- Boyer J.-C.; Vetrone F.; Cuccia L. A.; Capobianco J. A. Synthesis of Colloidal Upconverting NaYF4 Nanocrystals Doped with Er3+, Yb3+ and Tm3+, Yb3+via Thermal Decomposition of Lanthanide Trifluoroacetate Precursors. J. Am. Chem. Soc. 2006, 128, 7444–7445. 10.1021/ja061848b. [DOI] [PubMed] [Google Scholar]
- Boyer J.-C.; Manseau M.-P.; Murray J. I.; van Veggel F. C. J. M. Surface Modification of Upconverting NaYF4 Nanoparticles with PEG–Phosphate Ligands for NIR (800 nm) Biolabeling within the Biological Window. Langmuir 2010, 26, 1157–1164. 10.1021/la902260j. [DOI] [PubMed] [Google Scholar]
- Wang F.; Wang J.; Liu X. Direct Evidence of a Surface Quenching Effect on Size-Dependent Luminescence of Upconversion Nanoparticles. Angew. Chem., Int. Ed. 2010, 49, 7456–7460. 10.1002/anie.201003959. [DOI] [PubMed] [Google Scholar]
- Wang F.; Deng R.; Wang J.; Wang Q.; Han Y.; Zhu H.; Chen X.; Liu X. Tuning Upconversion through Energy Migration in Core–Shell Nanoparticles. Nat. Mater. 2011, 10, 968–973. 10.1038/nmat3149. [DOI] [PubMed] [Google Scholar]
- Zou W.; Visser C.; Maduro J. A.; Pshenichnikov M. S.; Hummelen J. C. Broadband Dye-Sensitized Upconversion of Near-Infrared Light. Nat. Photonics 2012, 6, 560–564. 10.1038/nphoton.2012.158. [DOI] [Google Scholar]
- Zhao J.; Lu Z.; Yin Y.; McRae C.; Piper J. A.; Dawes J. M.; Jin D.; Goldys E. M. Upconversion Luminescence with Tunable Lifetime in NaYF4:Yb,Er Nanocrystals: Role of Nanocrystal Size. Nanoscale 2013, 5, 944–952. 10.1039/C2NR32482B. [DOI] [PubMed] [Google Scholar]
- Zhao J.; Jin D.; Schartner E. P.; Lu Y.; Liu Y.; Zvyagin A. V.; Zhang L.; Dawes J. M.; Xi P.; Piper J. A.; Goldys E. M.; Monro T. M. Single-Nanocrystal Sensitivity Achieved by Enhanced Upconversion Luminescence. Nat. Nanotechnol. 2013, 8, 729–734. 10.1038/nnano.2013.171. [DOI] [PubMed] [Google Scholar]
- Chen D.; Huang P. Highly Intense Upconversion Luminescence in Yb/Er:NaGdF4 @NaYF4 Core–Shell Nanocrystals with Complete Shell Enclosure of the Core. Dalton Trans. 2014, 43, 11299–11304. 10.1039/c4dt01237b. [DOI] [PubMed] [Google Scholar]
- Liu Y.; Zhao J.; Zhang R.; Liu Y.; Liu D.; Goldys E. M.; Yang X.; Xi P.; Sunna A.; Lu J.; Shi Y.; Leif R. C.; Huo Y.; Shen J.; Piper J. A.; Robinson J. P.; Jin D. Tunable Lifetime Multiplexing Using Luminescent Nanocrystals. Nat. Photonics 2014, 8, 32–36. 10.1038/nphoton.2013.322. [DOI] [Google Scholar]
- Arppe R.; Hyppänen I.; Perälä N.; Peltomaa R.; Kaiser M.; Würth C.; Christ S.; Resch-Genger U.; Schäferling M.; Soukka T. Quenching of the Upconversion Luminescence of NaYF4:Yb3+,Er3+ and NaYF4:Yb3+,Tm3+ Nanophosphors by Water: the Role of the Sensitizer Yb3+ in Non-Radiative Relaxation. Nanoscale 2015, 7, 11746–11757. 10.1039/C5NR02100F. [DOI] [PubMed] [Google Scholar]
- Fischer S.; Johnson N. J. J.; Pichaandi J.; Goldschmidt J. C.; van Veggel F. C. J. M. Upconverting Core–Shell Nanocrystals with High Quantum Yield under Low Irradiance: On the Role of Isotropic and Thick Shells. J. Appl. Phys. 2015, 118, 193105. 10.1063/1.4936119. [DOI] [Google Scholar]
- Rinkel T.; Raj A. N.; Dühnen S.; Haase M. Synthesis of 10 nm β-NaYF4:Yb,Er/NaYF4 Core/Shell Upconversion Nanocrystals with 5 nm Particle Cores. Angew. Chem., Int. Ed. 2016, 55, 1164–1167. 10.1002/anie.201508838. [DOI] [PubMed] [Google Scholar]
- Johnson N. J. J.; He S.; Diao S.; Chan E. M.; Dai H.; Almutairi A. Direct Evidence for Coupled Surface and Concentration Quenching Dynamics in Lanthanide-Doped Nanocrystals. J. Am. Chem. Soc. 2017, 139, 3275–3282. 10.1021/jacs.7b00223. [DOI] [PubMed] [Google Scholar]
- Hyppänen I.; Höysniemi N.; Arppe R.; Schäferling M.; Soukka T. Environmental Impact on the Excitation Path of the Red Upconversion Emission of Nanocrystalline NaYF4:Yb3+,Er3+. J. Phys. Chem. C 2017, 121, 6924–6929. 10.1021/acs.jpcc.7b01019. [DOI] [PubMed] [Google Scholar]
- Schietinger S.; Aichele T.; Wang H.-Q.; Nann T.; Benson O. Plasmon-Enhanced Upconversion in Single NaYF4:Yb3+/Er3+ Codoped Nanocrystals. Nano Lett. 2010, 10, 134–138. 10.1021/nl903046r. [DOI] [PubMed] [Google Scholar]
- Han S.; Deng R.; Xie X.; Liu X. Enhancing Luminescence in Lanthanide-Doped Upconversion Nanoparticles. Angew. Chem., Int. Ed. 2014, 53, 11702–11715. 10.1002/anie.201403408. [DOI] [PubMed] [Google Scholar]
- Sun Q.-C.; Mundoor H.; Ribot J. C.; Singh V.; Smalyukh I. I.; Nagpal P. Plasmon-Enhanced Energy Transfer for Improved Upconversion of Infrared Radiation in Doped-Lanthanide Nanocrystals. Nano Lett. 2014, 14, 101–106. 10.1021/nl403383w. [DOI] [PubMed] [Google Scholar]
- Fischer S.; Kumar D.; Hallermann F.; von Plessen G.; Goldschmidt J. C. Enhanced Upconversion Quantum Yield near Spherical Gold Nanoparticles – a Comprehensive Simulation Based Analysis. Opt. Express 2016, 24, A460–A475. 10.1364/OE.24.00A460. [DOI] [PubMed] [Google Scholar]
- Yin Z.; Li H.; Xu W.; Cui S.; Zhou D.; Chen X.; Zhu Y.; Qin G.; Song H. Local Field Modulation Induced Three-Order Upconversion Enhancement: Combining Surface Plasmon Effect and Photonic Crystal Effect. Adv. Mater. 2016, 28, 2518–2525. 10.1002/adma.201502943. [DOI] [PubMed] [Google Scholar]
- Zhou D.; Liu D.; Xu W.; Yin Z.; Chen X.; Zhou P.; Cui S.; Chen Z.; Song H. Observation of Considerable Upconversion Enhancement Induced by Cu2–xS Plasmon Nanoparticles. ACS Nano 2016, 10, 5169–5179. 10.1021/acsnano.6b00649. [DOI] [PubMed] [Google Scholar]
- Xu W.; Chen X.; Song H. Upconversion Manipulation by Local Electromagnetic Field. Nano Today 2017, 17, 54–58. 10.1016/j.nantod.2017.10.011. [DOI] [Google Scholar]
- Stouwdam J. W.; Hebbink G. A.; Huskens J.; van Veggel F. C. J. M. Lanthanide-Doped Nanoparticles with Excellent Luminescent Properties in Organic Media. Chem. Mater. 2003, 15, 4604–4616. 10.1021/cm034495d. [DOI] [Google Scholar]
- Guyot-Sionnest P.; Wehrenberg B.; Yu D. Intraband Relaxation in CdSe Nanocrystals and the Strong Influence of the Surface Ligands. J. Chem. Phys. 2005, 123, 074709. 10.1063/1.2004818. [DOI] [PubMed] [Google Scholar]
- Aharoni A.; Oron D.; Banin U.; Rabani E.; Jortner J. Long-Range Electronic-to-Vibrational Energy Transfer from Nanocrystals to Their Surrounding Matrix Environment. Phys. Rev. Lett. 2008, 100, 057404. 10.1103/PhysRevLett.100.057404. [DOI] [PubMed] [Google Scholar]
- Rabouw F. T.; Den Hartog S. A.; Senden T.; Meijerink A. Photonic Effects on the Förster Resonance Energy Transfer Efficiency. Nat. Commun. 2014, 5, 3610. 10.1038/ncomms4610. [DOI] [PubMed] [Google Scholar]
- Senden T.; Rabouw F. T.; Meijerink A. Photonic Effects on the Radiative Decay Rate and Luminescence Quantum Yield of Doped Nanocrystals. ACS Nano 2015, 9, 1801–1808. 10.1021/nn506715t. [DOI] [PubMed] [Google Scholar]
- Anderson R. B.; Smith S. J.; May P. S.; Berry M. T. Revisiting the NIR-to-Visible Upconversion Mechanism in β-NaYF4:Yb3+,Er3+. J. Phys. Chem. Lett. 2014, 5, 36–42. 10.1021/jz402366r. [DOI] [PubMed] [Google Scholar]
- Berry M. T.; May P. S. Disputed Mechanism for NIR-to-Red Upconversion Luminescence in NaYF4:Yb3+,Er3+. J. Phys. Chem. A 2015, 119, 9805–9811. 10.1021/acs.jpca.5b08324. [DOI] [PubMed] [Google Scholar]
- Zhang J.; Hao Z.; Li J.; Zhang X.; Luo Y.; Pan G. Observation of Efficient Population of the Red-Emitting State from the Green State by Non-Multiphonon Relaxation in the Er3+–Yb3+ System. Light: Sci. Appl. 2015, 4, e239. 10.1038/lsa.2015.12. [DOI] [Google Scholar]
- van Dijk J. M. F.; Schuurmans M. F. H. On the Nonradiative and Radiative Decay Rates and a Modified Exponential Energy Gap Law for 4f–4f Transitions in Rare-Earth Ions. J. Chem. Phys. 1983, 78, 5317–5323. 10.1063/1.445485. [DOI] [Google Scholar]
- Sokolov V. I.; Zvyagin A. V.; Igumnov S. M.; Molchanova S. I.; Nazarov M. M.; Nechaev A. V.; Savelyev A. G.; Tyutyunov A. A.; Khaydukov E. V.; Panchenko V. Ya. Determination of the Refractive Index of β-NaYF4/Yb3+/Er3+/Tm3+ Nanocrystals Using Spectroscopic Refractometry. Opt. Spectrosc. 2015, 118, 609–613. 10.1134/S0030400X15040190. [DOI] [Google Scholar]
- Dong C.; Pichaandi J.; Regier T.; van Veggel F. C. J. M. Nonstatistical Dopant Distribution of Ln3+-Doped NaGdF4 Nanoparticles. J. Phys. Chem. C 2011, 115, 15950–15958. 10.1021/jp206441u. [DOI] [Google Scholar]
- van Wijngaarden J. T.; Scheidelaar S.; Vlugt T. J. H.; Reid M. F.; Meijerink A. Energy Transfer Mechanism for Downconversion in the (Pr3+, Yb3+) Couple. Phys. Rev. B: Condens. Matter Mater. Phys. 2010, 81, 155112. 10.1103/PhysRevB.81.155112. [DOI] [Google Scholar]
- Yu D. C.; Martín-Rodrïguez R.; Zhang Q. Y.; Meijerink A.; Rabouw F. T. Multi-Photon Quantum Cutting in Gd2O2S:Tm3+ to Enhance the Photo-Response of Solar Cells. Light: Sci. Appl. 2015, 4, e344. 10.1038/lsa.2015.117. [DOI] [Google Scholar]
- Henderson B.; Imbusch G. F.. Optical Spectroscopy of Inorganic Solids; Clarendon Press: Oxford, 1989. [Google Scholar]
- Geitenbeek R. G.; Prins P. T.; Albrecht W.; van Blaaderen A.; Weckhuysen B. M.; Meijerink A. NaYF4:Er3+,Yb3+/SiO2 Core/Shell Upconverting Nanocrystals for Luminescence Thermometry up to 900 K. J. Phys. Chem. C 2017, 121, 3503–3510. 10.1021/acs.jpcc.6b10279. [DOI] [PMC free article] [PubMed] [Google Scholar]
- Villanueva-Delgado P.; Biner D.; Krämer K. W. Judd–Ofelt Analysis of β-NaGdF4: Yb3+, Tm3+ and β-NaGdF4:Er3+ Single Crystals. J. Lumin. 2017, 189, 84–90. 10.1016/j.jlumin.2016.04.023. [DOI] [Google Scholar]
- Fischer S.; Swabeck J. K.; Alivisatos A. P. Controlled Isotropic and Anisotropic Shell Growth in β-NaLnF4 Nanocrystals Induced by Precursor Injection Rate. J. Am. Chem. Soc. 2017, 139, 12325–12332. 10.1021/jacs.7b07496. [DOI] [PubMed] [Google Scholar]
- Wang F.; Liu X. Upconversion Multicolor Fine-Tuning: Visible to Near-Infrared Emission from Lanthanide-Doped NaYF4 Nanoparticles. J. Am. Chem. Soc. 2008, 130, 5642–5643. 10.1021/ja800868a. [DOI] [PubMed] [Google Scholar]
- Pollnau M.; Gamelin D. R.; Lüthi S. R.; Güdel H. U.; Hehlen M. P. Power Dependence of Upconversion Luminescence in Lanthanide and Transition-Metal-Ion Systems. Phys. Rev. B: Condens. Matter Mater. Phys. 2000, 61, 3337–3346. 10.1103/PhysRevB.61.3337. [DOI] [Google Scholar]
- Hossan M. Y.; Hor A.; Luu Q.; Smith S. J.; May S.; Berry M. T. Explaining the Nanoscale Effect in the Upconversion Dynamics of β-NaYF4:Yb3+,Er3+ Core and Core–Shell Nanocrystals. J. Phys. Chem. C 2017, 121, 16592–16606. 10.1021/acs.jpcc.7b04567. [DOI] [Google Scholar]
- Gargas D. J.; Chan E. M.; Ostrowski A. D.; Aloni S.; Altoe M. V. P.; Barnard E. S.; Sanii B.; Urban J. J.; Milliron D. J.; Cohen B. E.; Schuck P. J. Engineering Bright Sub-10-nm Upconverting Nanocrystals for Single-Molecule Imaging. Nat. Nanotechnol. 2014, 9, 300–305. 10.1038/nnano.2014.29. [DOI] [PubMed] [Google Scholar]
- Villanueva-Delgado P.; Krämer K. W.; Valiente R.; de Jong M.; Meijerink A. Modeling Blue to UV Upconversion in β-NaYF4:Tm3+. Phys. Chem. Chem. Phys. 2016, 18, 27396–27404. 10.1039/C6CP04347J. [DOI] [PubMed] [Google Scholar]
- Fischer S.; Steinkemper H.; Löper P.; Hermle M.; Goldschmidt J. C. Modeling Upconversion of Erbium Doped Microcrystals Based on Experimentally Determined Einstein Coefficients. J. Appl. Phys. 2012, 111, 013109. 10.1063/1.3674319. [DOI] [Google Scholar]
- Li Z.; Zhang Y. An Efficient and User-Friendly Method for the Synthesis of Hexagonal-Phase NaYF4:Yb, Er/Tm Nanocrystals with Controllable Shape and Upconversion Fluorescence. Nanotechnology 2008, 19, 345606. 10.1088/0957-4484/19/34/345606. [DOI] [PubMed] [Google Scholar]
- Wang F.; Deng R.; Liu X. Preparation of Core-Shell NaGdF4 Nanoparticles Doped with Luminescent Lanthanide Ions to Be Used as Upconversion-Based Probes. Nat. Protoc. 2014, 9, 1634–1644. 10.1038/nprot.2014.111. [DOI] [PubMed] [Google Scholar]
Associated Data
This section collects any data citations, data availability statements, or supplementary materials included in this article.