

Abstract
Objectives
The Outpatient Pain Clinics at Memorial Sloan Kettering Cancer Center participated in developing a pain registry to gain insight on the referral and management of cancer pain as related to demographic information, cancer history, prescription records, and interventional pain procedures stored in the institutional database.
Methods
Five cohorts (subsets of one another) were defined and compared to describe demographics and differences in management and outcomes by age, race, sex, and cancer type. Clinic patients were compared with the entire institution to determine factors associated with better pain relief and reduced side effects.
Results
A small percentage were referred to a pain specialist. A total of 1,043 patients completed 3,544 surveys. Compared with the institution, there were higher proportions of patients age 51 to 60 years, nonwhites, and patients with thoracic, abdominal, and head and neck cancers. Medical management controlled pain with three drug categories in 40% of visits. Short-acting opioids were the only category that statistically provided good pain relief with fewer side effects. Pain scores were improved with increasing opioid dose. Management differed by sex, age, and race; women consistently had lower doses of opioids, poorer pain control, more side effects, and were prescribed a greater variety of medications.
Conclusions
A limited set of medications was required to manage most patients in the clinic, supporting the continued place of opioids and the World Health Organization analgesic ladder in managing cancer pain. Women may need a more nuanced approach for obtaining the best balance of pain relief and side effects.
Keywords: Outcome, Cancer Pain, Outpatient, Oncology, Symptom
Introduction
An Institute of Medicine report [1] highlighted the problem of chronic pain associated with cancer and its undertreatment [2,3]. Effective treatment requires an evidence-based approach that is objective and provides a framework to balance what works with risk.
To address this, in early 2012, the Pain Clinics of three hospitals in New York City (New York Presbyterian Hospital-Weill Cornell Medical Center, Hospital for Special Surgery, and Memorial Sloan Kettering Cancer Center [MSK]) developed a pain registry recording pain patient-reported outcomes (PROs) capturing pain intensity, functional impairment, symptoms (medication side effects and mood), quality of life, and opioid misuse.
The aim of this study was to link the PRO to institutional demographic information (medical history, prescription records, and interventional pain procedures) of patients at MSK to determine what provided the most pain relief with the fewest side effects.
Methods
Patient Populations
Five cohorts of patients seen at MSK Manhattan, excluding all outside sites, from March 12, 2012, until February 28, 2015, were defined (see Figure 1).
Figure 1.

Breakdown of groups. APS = Anesthesia Pain Service; MSK = Memorial Sloan Kettering Cancer Center.
Group 1: all patients treated at MSK’s Manhattan sites within the defined dates with five or more appointments at MSK (to minimize patients solely seeking second opinions).
Group 2: all patients in Group 1 referred to the Manhattan location of the Anesthesia Pain Service (APS).
Group 3: patients of Group 2 offered the PRO to complete on at least a second visit to the APS clinic.
Pain management at a first visit reflects the referring doctor and would not account for our management decisions.
Group 3a: the subset of Group 3 that completed the PRO.
Group 3b: the subset of Group 3 that refused to complete the PRO.
Group 3b and Group 3a equal Group 3.
Completing the questionnaires was “standard of care” in the APS clinics. A waiver to use existing data was granted by the Institutional Privacy Board.
Study Design
Groups 1 and 2 were compared on demographic variables to assess for any biases related to referral to the APS clinic. They were analyzed by sex, age, race, and cancer diagnosis at presentation.
Comparison of morphine equivalents (MEQs) was only possible for Group 2 (all APS pain) and subsets as only the APS employed exclusive electronic prescribing of opioids during the study period.
Group 2 and its subsets were the only groups offered questionnaires. Completion involved four sections: 1) the Brief Pain Inventory (BPI) [4], 2) the EQ-5D-3L, a measure of health status from the EuroQol group [5], 3) the Condensed Memorial Symptom Assessment Scale (CMSAS), a five-point scale to measure 14 physical and psychological symptoms [6] to capture medication side effects, and 4) the Current Opioid Misuse Measure (COMM), a 17-item self-report on aberrant drug-taking behavior [7].
For Group 3a (Questionnaire), the most recent medications and procedure categories three months before the questionnaire date were matched to that questionnaire. Group 3a is the only group completing the questionnaire and providing information on the BPI, EQ-5D-3L, CMSAS, and COMM. Group 3b was used to ascertain differences between those completing and not completing the questionnaire.
Study Measures
Demographic and clinical variables included age at first clinic visit, sex, race, and cancer diagnosis.
Prescribing information (inpatient and outpatient) and Current Procedural Terminology coding for procedures were mapped to groups standardized at all three hospitals for Group 2 and subsets (Table 1 and 4).
Table 1.
Medication prescribing frequencies (using the Fisher exact test)
| Medication Category | Proportion Female, % | P* | Proportion Male, % | Overall Frequency, % |
|---|---|---|---|---|
| Long-acting opioids | 51.9 | 0.021* | 48.1 | 44.1 |
| Short-acting opioids | 55.5 | 0.723 | 44.5 | 74.5 |
| Methadone | 49.3 | 0.060 | 50.7 | 14.4 |
| Neuropathic drug | 57.1 | 0.200 | 42.9 | 44.0 |
| NSAID | 63.9 | 0.000* | 36.1 | 22.1 |
| GI med | 5.9 | 0.343 | 94.1 | 30.0 |
| Steroid | 51.2 | 0.051 | 48.8 | 26.8 |
| Anti-emetic | 58.3 | 0.059 | 41.7 | 37.7 |
| Benzodiazepine | 59.2 | 0.044* | 40.8 | 29.0 |
| Intrathecal pain pump | 54.0 | 0.886 | 46.0 | 3.2 |
| Sleep Aid | 56.0 | 0.837 | 44.0 | 16.4 |
| Stimulant | 45.5 | 0.219 | 54.5 | 2.8 |
| Other | 54.1 | 0.386 | 45.9 | 49.5 |
| Nonformulary | 55.0 | 0.878 | 45.0 | 44.8 |
P refers to the comparison of female vs male in terms of the use of the particular medication category.
GI = gastrointestinal; NSAID = nonsteroidal anti-inflammatory drug.
Table 3.
Procedure frequencies (N = 573 procedures using the Fisher exact test)
| Proportion Female, % | P* | Proportion Male, % | Overall Frequency, % | |
|---|---|---|---|---|
| EPIDURAL BLOCKS | 50.7 | 0.122 | 49.3 | 12.4 |
| EPIDURAL BLOOD PATCH | 100.0 | 0.150 | 0.0 | 0.7 |
| EPIDURAL CATHETER | 55.6 | 0.692 | 44.4 | 4.7 |
| FACET PROCEDURES | 45.1 | 0.010* | 54.9 | 12.4 |
| HEAD/NERVE BLOCKS | 63.6 | 0.716 | 36.4 | 5.8 |
| INTRATHECAL PUMP | 53.7 | 0.386 | 46.3 | 9.4 |
| JOINT PROCEDURES | 69.0 | 0.014* | 31.0 | 22.0 |
| LE NERVE BLOCKS | 54.5 | 0.663 | 45.5 | 3.8 |
| LOCAL INJECTION | 65.0 | 0.326 | 35.0 | 14.0 |
| PARAVERTEBRAL NERVE BLOCKS | 53.6 | 0.391 | 46.4 | 9.8 |
| SPINE PROCEDURES | 54.9 | 0.268 | 45.1 | 23.2 |
| STIMS | 62.5 | 0.686 | 37.5 | 11.2 |
| UE NERVE BLOCKS | 64.6 | 0.258 | 35.4 | 16.8 |
| VISCERAL NERVE BLOCKS | 51.7 | 0.440 | 48.3 | 5.1 |
P refers to the comparison of female vs male in terms of the use of the medication category.
Opioid medications were converted to total daily dose oral morphine equivalents (MEQs) calculated from the standard conversions used by MSK [8–11]. It was assumed all sustained-release opioids would be used as prescribed. Because “as needed” (prn) medications may vary in use, we assumed consumption of 50% of the maximum allowed daily dose was reasonable. Prescribing was summarized by medication categories. “Other” included acetaminophen and lidocaine patches, while nonformulary was used to generate prescriptions for nonmedication items such as radiology and physical therapy.
Statistical Methods
Comparisons between groups were performed using Fisher’s exact test for categorical factors (sex, age categories, race, and cancer types). Unknown cancer types were excluded between groups but included in the within-group analyses. Among patients with medication data (Group 2), prescribing patterns of each medication are compared between sexes using the Fisher exact test, similarly with procedure types. Among patients with questionnaire responses (Group 3a), scores were compared between sexes using the Wilcoxon rank sum test. Only summary values were available for Group 1; therefore, comparisons of groups assume independence.
Analysis of the PRO focused on percent pain relief (% relief), obtained from the BPI and the CMSAS physical subscale. Both outcomes were treated as continuous measures: higher percent relief is desirable, whereas lower CMSAS physical score implies fewer physical symptoms. Linear mixed-effects models for outcomes included time since first anesthesiology visit (cubic splines) and patient-level random effects to address correlation between multiple visits from the same patient. Fixed effects included age at first anesthesiology visit, race (white vs nonwhite), sex, medications in the previous 30 days (14 categories), morphine equivalent (Log10-transformed), cancer type (16 categories), and procedure performed (yes/no). As patients may present with multiple diagnoses at the first pain visit, dummy variables for each cancer type indicate the specific cancer type. Similarly, dummy variables for each medication category allow multiple medication categories with a patient visit. Multivariable models with the same set of variables allow for assessments of the effects of each variable in the presence of other factors. Analysis of the EQ5D-VAS scale is similar to that for Percent Pain Relief and CMSAS physical subscale. The normality assumption of the EQ5D-VAS is confirmed using graphical summary of the residuals. A linear mixed-effects model for all available EQ5D-VAS responses was created including time since first anesthesiology visit (cublic spline) and patient-level random effects. Fixed effects are the same set as those included in the first two outcomes, excluding any responses with only nonformulary medication or unknown cancer type. Due to potential high collinearity between MEQ and certain pain medications, we examine two multivariable models for EQ5D-VAS, the first version with no MEQ but all medication categories and the second version with MEQ but removing the covariates for long-acting opioids, short-acting opioids, methadone, and intrathecal pump.
All analyses were performed using R 3.2.5 (R Core Team, Vienna, Austria). All tests were two-sided, and P values of less than 0.05 were considered significant. Tables and figures were generated using Microsoft Exc90el 2016 MSO (16.0.7030.1021) 32-bit.
Results
From Figure 1, from March 12, 2012, until February 28, 2015, 72,326 patients had five or more clinic visits in all MSK clinics in Manhattan (Group 1). Of the 1,971 patients seen in the APS during the study period (Group 2), 1,857 (94.2%) completed questionnaires. Of these, 785 (42.3%) were making their first visit. Group 3 consisted of people making at least a second visit to the clinic and included 1,152 patients, of whom 1,043 (90.5%) completed at least one questionnaire (Group 3a), while 109 (9.5%) patients did not complete any questionnaires and formed a control group (Group 3b). The 1,043 patients in Group 3a completed 3,544 total questionnaires, with 611 (58.6%) patients completing more than one questionnaire, with a median of 2 questionnaires per patient, interquartile range (IQR) of 1 to 4, and a maximum of 40 questionnaires. Among those with two or more questionnaires (N = 611), the median was 4, with an IQR of 2 to 6.
Neither sex was overrepresented in the pain clinics (Group 1 vs Group 2). Additionally, the sex distribution of those completing questionnaires was representative of the APS clinic as a whole (Group 2 vs Group 3), with no difference among those refusing questionnaires (Group 3a vs Group 3b).
Age comparisons (Figure 2) showed more patients age 51 to 60 years in Group 2 (all APS) than Group 1 (all MSK). Aggregating into those age 60 years or younger and older than age 60 years shows that those seen more than once by APS (Group 3) were younger than all APS patients (Group 2). On race, more nonwhites were seen by APS compared with the whole institution (Group 2 vs Group 1).
Figure 2.
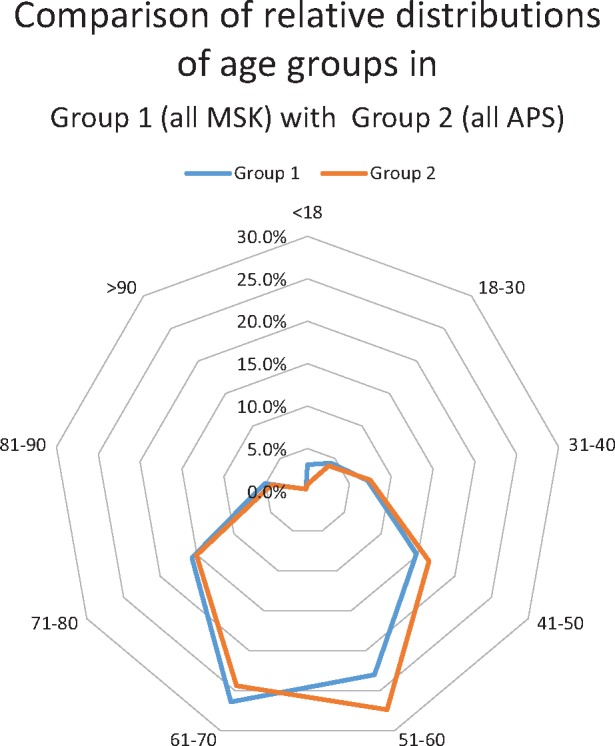
Radar map of age distributions. APS = Anesthesia Pain Service; MSK = Memorial Sloan Kettering Cancer Center.
No differences were noted between those completing or refusing questionnaires by sex or age, but racial differences did exist, primarily because more patients refusing also declined to list a race.
The cancers most seen in the pain clinics (Group 2) included breast (16.6%), thoracic (15.8%), genitourinary (14.4%), and colorectal (7.0%). Comparing with MSK as a whole (Group 1) revealed more thoracic, orthopedic, gastrointestinal, head and neck, and colorectal cancers in Group 2 than the center (Figure 3). Breast, genitourinary, endocrine, and lymphoma were fewer in in the clinics compared with the center, though the first two of these were in the top three in clinic frequency.
Figure 3.

Radar map of cancer distributions. APS = Anesthesia Pain Service; MSK = Memorial Sloan Kettering Cancer Center.
Prescribing data for 1,577 patients of Group 2 (all APS pain) show a median of five categories of medications prescribed (IQR = 2–7) per patient. At each visit, a median of three prescriptions (IQR = 2–5) were provided. Short-acting opioids (74.5%), long-acting opioids (44.1%), neuropathic drugs (44%), and anti-emetics (37.7%) were the most prescribed medications (Table 1). The categories “other” and “nonformulary” were numerically higher but not counted as they were disparate groups. Females were prescribed long-acting opioids, nonsteroidal anti-inflammatory drugs (NSAIDs), and benzodiazepine with greater frequency than males in Group 2 and Group 3. No medication was statistically more frequent in males except methadone (50.7% vs 49.3%), which approached statistical significance (P = 0.060) in Group 2.
To focus on analgesic prescribing, we concentrated only on analgesic categories: NSAIDs, short-acting opioids, long-acting opioids, neuropathic drugs, and methadone, forming potentially 120 combinations. The most frequent combinations among 5,778 clinic visits by Group 2 patients are in Table 2A. About 48% of all combinations consisted of some combination of a long-acting opioid +/− a short-acting opioid +/− a neuropathic drug. Even within a single category of drug, only one or two choices were commonly used: oxycodone extended release (ER) or fentanyl patch for long-acting opioids, oxycodone or hydromorphone for short-acting opioids, and gabapentin or pregabalin for neuropathic agents. Data on comparative MEQs are presented in Table 2B. This data is at the visit level as repeat visits by the same patient are counted. The control group showed the lowest maximum values but also had the fewest observations; among those with higher MEQs, high doses of methadone with intravenous patient-controlled analgesia were more commonly prescribed. Only patients of the pain clinic had electronic prescriptions, so Group 1 comparative data were not available. Patients on long-acting opioids had a median MEQ greater than those on just short-acting opioids as the former was always prescribed a short-acting opioid as a rescue medication.
Table 2A.
Most frequent combination of medication categories prescribed
| Combinations of Medication Categories | First most Common Medication in this Combination (%) | Second Most Common in this Category (%) | Third most Common in this Category (%) | Percent of All Rx Total for Category | |
|---|---|---|---|---|---|
| (1) | Short-acting opioid only | Oxycodone | Hydromorphone | Tramadol | 16.9 |
| N = 529 (54.1*) | N = 168 (17.2*) | N = 64 (6.6*) | N = 977 | ||
| (2) | Short-acting opioid + long-acting opioid | Oxycodone + oxycodone ER | Oxycodone + fentanyl patch | Hydromorphone + fentanyl patch | 15.1 |
| N = 323 (37.1*) | N = 163 (18.7*) | N = 72 (8.3*) | N = 870 | ||
| (3) | No analgesic medications | 12.4 | |||
| N = 719 | |||||
| (4) | Short-acting opioid + long-acting opioid + neuropathic agent | Oxycodone + oxycodone ER + gabapentin | Oxycodone + oxycodone ER + pregabalin | Oxycodone + fentanyl patch + gabapentin | 10.3 |
| N = 88 (14.8*) | N = 51 (8.6*) | N = 45 (7.6*) | N = 593 (10.0) | ||
| (5) | Short-acting + neuropathic agent | Oxycodone + gabapentin | Oxycodone + pregabalin | Tramadol + gabapentin | 6.0 |
| N = 91 (26.1*) | N = 39 (11.2*) | N = 35 (10.1*) | N = 348 (7.1) |
Reflects percent of the total for that row category.
ER = extended release.
Table 2B.
Descriptive data for MEQ dosing among groups (among all patient visits)
| Group 2 | Group 3 | Group 3a | Group 3b | |
|---|---|---|---|---|
| All Anesthesia Pain Clinic | Questionnaire and Control | Questionnaire Only | Control Only | |
| N = observations | 4,616 | 4,099 | 3,891 | 208 |
| Max, mg | 54,735 | 54,735 | 54,735 | 17,846 |
| p75, mg | 549 | 582 | 585 | 487 |
| Median, mg | 158 | 180 | 180 | 168 |
| p25, mg | 52 | 52 | 52 | 58 |
| Min, mg | 5 | 5 | 5 | 8 |
| Mean, mg | 745 | 762 | 771 | 584 |
| SD | 2,461 | 2,538 | 2,581 | 1,512 |
MEQ = morphine equivalent.
Among 573 patients (29.1%) undergoing interventional procedures (Table 3), 3,833 procedures were performed (Table 4). The median was one unique procedure type per patient; 130 patients had two procedures (23% of those undergoing procedures), and 44 patients had three (8%). Intrathecal pump placement had an overall frequency of 9% among this group, with no sex differences; pump adjustment and refill represented the most commonly performed procedure. Among unique patients having procedures, the most common were spine procedures (23.2%), joint procedures, and upper-extremity nerve blocks (16.8%). Comparing sexes, joint procedures were more common in females (69.0% vs 31.0%), while in males it was facet procedures (54.9% vs 45.1%).
Table 4.
Procedure detail for Group 2
| Procedure Category | No. | % | Subprocedure | % of Total |
|---|---|---|---|---|
| IT PUMP | 1,245 | 32.5 | ANALYZE SP INF PUMP W/REPROG | 19.6 |
| ANL SP INF PMP W/MDREPRG&FIL | 11.5 | |||
| ANALYZE SPINE INFUS PUMP | 1.4 | |||
| JOINT PROCEDURES | 473 | 12.3 | DRAIN/INJECT JOINT/BURSA | 9.0 |
| INJECT SACROILIAC JOINT | 3.3 | |||
| UE NERVE BLOCKS | 367 | 9.6 | N BLOCK INJ INTERCOST MLT | 6.2 |
| N BLOCK INJ INTERCOST SNG | 3.1 | |||
| N BLOCK INJ BRACHIAL PLEXUS | 0.2 | |||
| N BLOCK CONT INFUSE B PLEX | 0.1 | |||
| LOCAL INJECTION | 318 | 8.3 | INJ TRIGGER POINT 1/2 MUSCL | 4.3 |
| INJECT TRIGGER POINTS > 3 | 2.3 | |||
| INJECT SKIN LESIONS | 1.0 | |||
| INJ TENDON SHEATH/LIGAMENT | 0.5 | |||
| INJ TENDON ORIGIN/INSERTION | 0.2 | |||
| SPINE PROCEDURES | 287 | 7.5 | INJECT SPINE LUMBAR/SACRAL | 4.0 |
| N BLOCK LUMBAR/THORACIC | 2.4 | |||
| INJECT SPINE CERV/THORACIC | 0.9 | |||
| TREAT SPINAL CORD LESION | 0.1 | |||
| TREAT SPINAL CANAL LESION | 0.1 | |||
| PARAVERTEBRAL NERVE BLOCKS | 283 | 7.4 | INJ PARAVERT F JNT L/S 1 LEV | 2.3 |
| INJ PARAVERT F JNT L/S 2 LEV | 2.0 | |||
| INJ PARAVERT F JNT L/S 3 LEV | 1.3 | |||
| INJ PARAVERT F JNT C/T 1 LEV | 0.8 | |||
| INJ PARAVERT F JNT C/T 2 LEV | 0.7 | |||
| INJ PARAVERT F JNT C/T 3 LEV | 0.3 | |||
| EPIDURAL BLOCKS | 200 | 5.2 | INJ FORAMEN EPIDURAL L/S | 4.0 |
| INJ FORAMEN EPIDURAL C/T | 0.6 | |||
| INJ FORAMEN EPIDURAL ADD-ON | 0.6 | |||
| HEAD AND NECK NERVE BLOCKS | 187 | 4.9 | N BLOCK STELLATE GANGLION | 4.0 |
| N BLOCK INJ OCCIPITAL | 0.6 | |||
| N BLOCK INJ TRIGEMINAL | 0.3 | |||
| N BLOCK SPENOPALATINE GANGL | 0.1 | |||
| FACET PROCEDURES | 149 | 3.9 | INJECTION TREATMENT OF NERVE | 1.9 |
| N BLOCK OTHER PERIPHERAL | 1.4 | |||
| DESTROY LUMB/SAC FACET JNT | 0.6 | |||
| STIMS | 121 | 3.2 | APPLY NEUROSTIMULATOR | 1.6 |
| INJECTION TREATMENT F NERVE | 1.5 | |||
| EPIDURAL CATHETER | 71 | 1.9 | INJECT SPINE W/CATH LMB/SCRL | 1.9 |
| VISCERAL NERVE BLOCKS | 68 | 1.8 | N BLOCK INJ HYPOGAS PLXS | 1.2 |
| N BLOCK INJ CELIAC PLXS | 0.6 | |||
| LE NERVE BLOCKS | 57 | 1.5 | N BLOCK INJ ILIO-ING/HYPOGI | 1.0 |
| N BLOCK INJ FEM SINGLE | 0.2 | |||
| N BLOCK INJ PUDENDAL | 0.2 | |||
| N BLOCK INJ SCIATIC SNG | 0.1 | |||
| EPIDURAL BLOOD PATCH | 7 | 0.2 | INJECT EPIDURAL PATCH | 0.2 |
| Total | 3,833 |
On the BPI, low back pain was the worst pain location, reported by both males and females, 19.0% and 20.1%, respectively. The hip was the second most common location for females (9.5%) and abdominal pain for males (11.9%). Leg pain was third most common in both sexes. Except for the head (females 3.8% vs males 2.0%), no sex disparities existed in the worst pain location.
There were significant differences between sexes for “BPI least pain level,” “BPI average pain level,” and “BPI current pain level,” with median scores for males lower by 1. “BPI percent relief” also showed a difference, with males reporting more pain relief (data not shown).
By CMSAS scores, pain was the most bothersome symptom. Despite being a cancer hospital, median scores for weight loss, lack of appetite, nausea, and constipation were among the lowest reported. Lack of energy, feeling drowsy, difficulty sleeping, and difficulty concentrating were rated as highest (data not shown). Worrying and feeling sad ranked highest among psychological scores. Females scored significantly higher on both CMSAS physical and psychological composite scores, corresponding to worse outcomes.
The EQ-5D-3L demonstrated no differences in any dimension by sex but did show that patients older than age 70 years (P = 0.0007) reported more difficulties with mobility, as did those between age 19 and 30 years. By race, whites reported the least difficulty with self-care (P = 0.0124) compared with other groups.
Multivariable analysis was used to determine independent contributions of factors related to percent relief. MEQs were removed as they were highly collinear with the opioid terms. Only age (being younger), being white, and the presence of a short-acting opioid were statistically predictive of better pain relief. Endocrine tumors were negatively associated with pain relief while head and neck tumors were positively associated.
CMSAS physical symptom multivariable analysis showed steroids as associated with worse CMSAS. Head and neck cancers predicted worsening symptoms. Being female predicted worse side effects, with age having no effect.
Multivariable analysis of the EQ-5D-VAS was with morphine equivalents (instead of opioid drug categories) and showed statistically lower scores for higher morphine equivalents (P < 0.001), the presence of anti-emetics (P < 0.001), and undergoing a procedure (P = 0.010). Worse scores were noted for those with an orthopedic tumor.
A scatterplot of percent relief and CMSAS coefficients explored which factors simultaneously result in improved pain and decreased side effects, where the lower right quadrant is optimal (Figure 3). Only short-acting opioids proved statistically significant for both improved pain relief and fewer symptoms on the CMSAS.
Discussion
To our knowledge, this is the first systematic study of pain outcomes achieved in a single pain clinic within a Comprehensive Cancer Center. A minority of patients at MSK (2.7%) sought specialty pain management within the center, suggesting that most cancer patients had either no pain or pain that was manageable by a primary oncologist. Those seen consisted of higher proportions of patients age 51 to 60 years, nonwhites, and patients with thoracic, abdominal, and head and neck cancers. No significant sex differences were apparent, suggesting no referral bias. Greater-age (51 to 60 years) patients in the pain clinic are consistent with other studies [12]. Underrepresented were liquid tumors in the clinic, which is in line with published reports [12]. The importance of comparative data with the institution is highlighted here. Breast and genitourinary cancers were the first and third most common cancers in the pain clinics, yet were less prevalent than in the institution. Without comparative data, we would fail to note that these are relatively less likely to have pain appointments and would mistakenly infer the opposite. We are reluctant to make conclusions on the likelihood of pain with the type of cancer as the clinic proportions may simply represent the referral preferences of certain oncologists. Similarly, we can make no inferences as to why more nonwhites were seen in the clinic as this may also represent a referral bias. That patients younger than age 60 years had greater total visits may be from living longer and having greater opportunity for follow-up visits.
Figure 4.

Scatterplot of coefficients from mixed linear models of percent relief and Condensed Memorial Symptom Assessment Scale (CMSAS) [6]. Lower right quadrant dots display values where Pain Relief and Side Effects were favorable. Statistically significant for both coefficients: Short Acting Opioid and Head & Neck. Statistically Significant only for Percent Relief: Age, White vs Non White. Statistically Significant only for Side Effects: Male vs Female, Steroid [6].
The average pain relief in the clinic was 60% with medical management, which was accomplished with three drug categories 48% of the time: short-acting opioids, long-acting opioids, and neuropathic drugs using six medications, two from each category. In our two-dimensional multivariable analysis, we showed that short-acting opioids provided the best pain relief with the fewest side effects after adjusting for multiple factors: age, sex, race, cancer types, medication categories, and procedures. We suspect that the immediacy of therapeutic effect reinforces a causal relationship of dosing and relief. As increased morphine equivalents showed significantly improved EQ-5D-VAS scores, additional opioids are of value. Long-acting opioids showed benefit in the univariate analysis (P = 0.002), as did methadone in the multivariable analysis. Because they are second-line opioids that are added to short-acting opioids, their marginal benefit may not be as pronounced as with initiation of opioids as is done with short-acting opioids. Anti-emetics improved EQ-5D-VAS scores, likely by facilitating increased total opioid doses.
Most surprising to us were the gender disparities. Short-acting opioids were more often prescribed in men. Women had lower doses of opioids, poorer pain control, and worse side effects, with a greater variety of medications. Women were prescribed on average 30 MEQs/d less than males, likely causing higher BPI on multiple subscales. We suspect their higher use of NSAIDs is likely from increased side effects, as evidenced by the CMSAS scores and CMSAS multivariable analysis.
Also surprising, physical symptoms associated with cancer were not the most bothersome on the CMSAS. Psychological symptoms of worrying and feeling sad scored highest, more so in women [4,5,10]. Worsening CMSAS with steroids is likely from etiologies (spinal metastases, brain metastases, intractable pain) that initiate steroids than from the steroids themselves, and the need for steroids may signal deterioration. Not surprising, mobility was most difficult for older patients. For 19- to 30-year-olds, it was likely a reflection of a significant change from baseline.
On the BPI, low back pain was the worst pain location, reported by both sexes, as noted in the literature [13]. Only 573 patients (29.1%) underwent interventional procedures. The most common procedure for women was a joint procedure (2:1 compared with men), while men had more facet blocks. Women favored interventions for their second most common pain (hip pain) than for their most common (low back pain). Interventional procedures are a mainstay of our clinic, yet we found no statistical improvements in percent relief or CMSAS. In the univariable analysis, it approached statistical significance as a negative predictor of relief. Relief with procedures was puzzling: the percent relief did not show improvement, but multivariable EQ-5D-VAS analysis showed statistically lower scores, and CMSAS did show improved side effects (though not statistically significant) [14,15].
Methodological Limitations
While 2.7% of MSK patients obtained a pain referral, we are unable to determine what proportion of cancer patients who have pain this represents. This statistic was indeterminable during the study period, but with the introduction of widespread electronic prescribing and state prescription registries, it should be more easily ascertained in future studies. We further hope this will permit us to compare our data, including ICD-10 and COMM information, with our partner institutions more consistently.
A major limitation is not defining the etiology of pain, whether neuropathic, non-neuropathic, or from active cancer, cancer treatment, or benign causes. We were, therefore, unable to delineate treatments sought for pain from cancer vs noncancer pain in a cancer patient. In previous analyses, most of our patients have mixed somatic-neuropathic pain or pure somatic pain [16]. We did not include cancer stage as this would vary during treatment over time.
The COMM was not examined as misuses are perceived as low in this population. Further analyses should focus on this and examine the survival characteristics of those with favorable pain relief and side effects.
Conclusions
Because of referral biases, it is difficult to predict which cancer types will likely develop pain. Based on our data and multivariable analysis comparing relief and side effects, short-acting opioids provide the best balance between pain relief and side effects [17]. From the data, women will have more pain and more side effects; therefore, it is appropriate to favor nonopioids over opioids initially. As this is sensible for both sexes, these two recommendations of nonopioids and short-acting opioids offer further validation to the WHO ladder. Long-acting opioids and methadone have a role as a practical adjunct to minimize the frequency of the short-acting opioid. We also showed that effective management does not require numerous drugs. A small, focused formulary of an NSAID, neuropathic drugs (gabapentin and pregabalin), short-acting opioids (hydromorphone and oxycodone), or long-acting opioids (oxycodone ER and fentanyl patch) can treat most aspects of cancer pain.
Compared with men, women may benefit from early psychologic coreferral as they more often report worrying and feeling sad. Again, this would be sensible for both sexes as men might have underreported such symptoms. Physical symptoms play a minor role in patient complaints of both sexes, except for mobility issues in older patients.
Interventional procedures remain indicated for difficult-to-control pain, though the degree of relief is difficult to quantify without a randomized trial. Although our data were insufficiently powered to conclude this, our study does validate their role in decreasing pain scores, and their indication may be for intractable opioid side effects as opposed to just analgesia. By permitting relief of pain, doses may decrease, and symptoms may improve.
Ideal in an era of personalized medicine is an application where a practitioner may enter sex, age, race, and cancer type and a probability score recommends pain specialty referral. Our data were not equipped to validate this, but with the greater adoption of digital medical records, this would be a valuable focus of future research.
References
- 1. Relieving pain in America: A blueprint for transforming prevention, care, education, and research. Mil Med [Internet] 2016;1815:397–9. Available at: http://publications.amsus.org/doi/full/10.7205/MILMED-D-16-00012 (accessed July 3, 2016). [DOI] [PubMed] [Google Scholar]
- 2. Apolone G, Corli O, Caraceni A, et al. Pattern and quality of care of cancer pain management. Results from the Cancer Pain Outcome Research Study Group. Br J Cancer 2009;10010:1566–74. [DOI] [PMC free article] [PubMed] [Google Scholar]
- 3. Breivik H, Cherny N, Collett B, et al. Cancer-related pain: A pan-European survey of prevalence, treatment, and patient attitudes. Ann Oncol 2009;208:1420–33. [DOI] [PubMed] [Google Scholar]
- 4. Cleeland CS. Brief Pain Inventory (BPI). Houston, TX: MD Anderson Cancer Center; 1982;1100:6. [Google Scholar]
- 5. Ramos-Goni JM, Rivero-Arias O.. Eq5d: A command to calculate index values for the EQ-5D quality-of-life instrument. Stata J 2011;111:120–5. [Google Scholar]
- 6. Chang VT, Hwang SS, Kasimis B, Thaler HT.. Shorter symptom assessment instruments: The Condensed Memorial Symptom Assessment Scale (CMSAS). Cancer Invest 2004;224:526–36. [DOI] [PubMed] [Google Scholar]
- 7. Ives TJ, Chelminski PR, Hammett-Stabler CA, et al. Predictors of opioid misuse in patients with chronic pain: A prospective cohort study. BMC Health Serv Res 2006;61:46. [DOI] [PMC free article] [PubMed] [Google Scholar]
- 8. Foley KM. The treatment of cancer pain. N Engl J Med 1985;3132:84–95. [DOI] [PubMed] [Google Scholar]
- 9. Malhotra VT. Pain Management in the colorectal cancer patient In: Saltz L, Memorial SK, eds. Colorectal Cancer:Evidence-Based Chemotherapy Strategies, 1st edition Totowa, NJ: Humana Press; 2007:245–62. [Google Scholar]
- 10. Eddy N, Lee L.. American Society for Pharmacology and Experimental Therapeutics. J Pharmacol Exp Ther [Internet]. Available at: http://jpet.aspetjournals.org/content/125/2/116.short (accessed March 23, 2017). [Google Scholar]
- 11. Prommer E. Levorphanol: The forgotten opioid. Support Care Cancer 2007;153:259–64. [DOI] [PubMed] [Google Scholar]
- 12. Caraceni A, Portenoy RK.. An international survey of cancer pain characteristics and syndromes. Pain 1999;823:263–74. [DOI] [PubMed] [Google Scholar]
- 13. Grond S, Zech D, Diefenbach C, Bischoff A.. Prevalence and pattern of symptoms in patients with cancer pain: A prospective evaluation of 1635 cancer patients referred to a pain clinic. J Pain Symptom Manage 1994;96:372–82. [DOI] [PubMed] [Google Scholar]
- 14. Staats P, Smith T, Deer T, et al. (228) Randomized Comparison of Medtronic Intrathecal Drug Delivery Systems (IDDS) plus Comprehensive Medical Management (CMM) vs CMM for Unrelieved Cancer Pain. Pain Med 2001;23:251–2 [Google Scholar]
- 15. Staats PS, Hekmat H, Sauter P, Lillemoe K.. The effects of alcohol celiac plexus block, pain, and mood on longevity in patients with unresectable pancreatic cancer: A double-blind, randomized, placebo-controlled study. Pain Med 2001;21: 28–34. [DOI] [PubMed] [Google Scholar]
- 16. Malhotra VT, Root J, Kesselbrenner J, et al. Intrathecal pain pump infusions for intractable cancer pain: An algorithm for dosing without a neuraxial trial. Anesth Analg 2013;1166:1364–70. [DOI] [PMC free article] [PubMed] [Google Scholar]
- 17. Portenoy RK. Pain management in the older cancer patient. Oncology (Williston Park, NY) 1992; 6(suppl 2): 86–98. [PubMed] [Google Scholar]