Abstract
Purpose
To investigate whether sheets of retina organoids derived from human embryonic stem cells (hESCs) can differentiate, integrate, and improve visual function in an immunodeficient rat model of severe retinal degeneration (RD).
Methods
3D hESC-derived retina organoids were analyzed by quantitative PCR and immunofluorescence. Sheets dissected from retina organoids (30–65 days of differentiation) were transplanted into the subretinal space of immunodeficient rho S334ter-3 rats. Visual function was tested by optokinetic testing and electrophysiologic recording in the superior colliculus. Transplants were analyzed at 54 to 300 days postsurgery by immunohistochemistry for donor and retinal markers.
Results
Retina organoids contained multiple retinal cell types, including progenitor populations capable of developing new cones and rods. After transplantation into an immunodeficient rat model of severe RD, the transplanted sheets differentiated, integrated, and produced functional photoreceptors and other retinal cells, according to the longer human developmental timetable. Maturation of the transplanted retinal cells created visual improvements that were measured by optokinetic testing and electrophysiologic recording in the superior colliculus. Immunohistochemistry analysis indicated that the donor cells were synaptically active. Extensive transplant projections could be seen within the host RD retina. Optical coherence tomography imaging monitored long-term transplant growth and survival up to 10 months postsurgery.
Conclusions
These data demonstrate that the transplantation of sheets dissected from hESC-derived retina organoids is a potential therapeutic method for restoring vision in advanced stages of RD.
Keywords: immunodeficient, optical coherence tomography, optokinetic testing, vision repair, retina transplantation, superior colliculus electrophysiology
Age-related macular degeneration and retinitis pigmentosa lead to the incurable loss of vision in millions of people.1 No traditional therapy can restore lost vision in the advanced stages of retinal degeneration (RD) due to the irrevocable loss of photoreceptors. Recently developed cell therapies are promising treatments for RD. Fetal retinal sheets transplanted into RD rodent models2–6 and human RD patients7 improved vision. In the human study, 7 of 10 patients showed improved visual acuity after one year and no sign of transplant rejection was observed. Such transplants continue to mature, synaptically integrate, and generate new photoreceptors.8,9 Due to ethical and supply issues, fetal retina sheets are difficult to scale to a clinically relevant level. Fortunately, pluripotent stem cells can be differentiated into tissue comparable to that of fetal retina.10–14 3D retina organoids developed from human embryonic stem cells (hESCs) may offer a uniform, scalable, functional, and safe solution15–17 for patients in need of retinal transplants.
In order to evaluate the effectiveness of hESC-derived retinal sheet transplants, we used the nude rho S334ter-3 rat with severe RD.18,19 This rat has a fast rate of RD due to a toxic rhodopsin transgene mutation that destroys the rods, resulting in continued degeneration of the cones.3,20,21 At the time of transplantation in our study, most rod photoreceptors are lost.6 There are only few cone photoreceptors remaining to be rescued by trophic factors secreted by the donor tissue22 or to incorporate donor cytoplasm via cytoplasmic transfer.23–27
An important part of the design of this study builds on the fact that human cells have a much slower development than rat cells. Therefore, for functional testing, survival times after transplantation were selected to be at least 6 months and longer.
Although there are several behavioral methods to assess visual acuity or improvements,28–30 the optokinetic response (OKT) was used, as it requires no subject training, is a reflex response to light stimulation of the retina, and is sensitive enough to detect transplanted tissue within an RD environment.28,31–33 Electrophysiologic recordings of the superior colliculus (SC) can determine if functional connections are made with existing visual pathways. The SC receives direct retinal input,34 and is sensitive to a wide range of light intensities.35 In addition, its electrophysiologic activity reflects the phototransduction process and light-collecting ability of functional photoreceptors.36
With clinical applications in mind, we investigated whether transplanted sheets from hESC-derived retina organoids can differentiate into essential retinal cell types, integrate with host neural pathways, and improve visual function in RD nude rats.
Methods
Cell Culture
hESCs (cell line CSC14, NIH registration no. 0284; AIVITA Biomedical, Inc., Irvine, CA, USA) were expanded using chemically defined and xeno-free custom-formulated media (Irvine Scientific, Irvine, CA, USA) supplemented with low levels of BFGF and Activin-A. Cells were grown on Matrigel (Corning, Corning, NY, USA) and passaged every 3 to 4 days by using a Collagenase IV digestion.
In initial experiments (data not shown), multiple published methods10,11,37–39 were compared in their ability to differentiate pluripotent stem cells into 3D retina. The method of Zhong et al.11 gave the most consistent results and was further modified for this study.
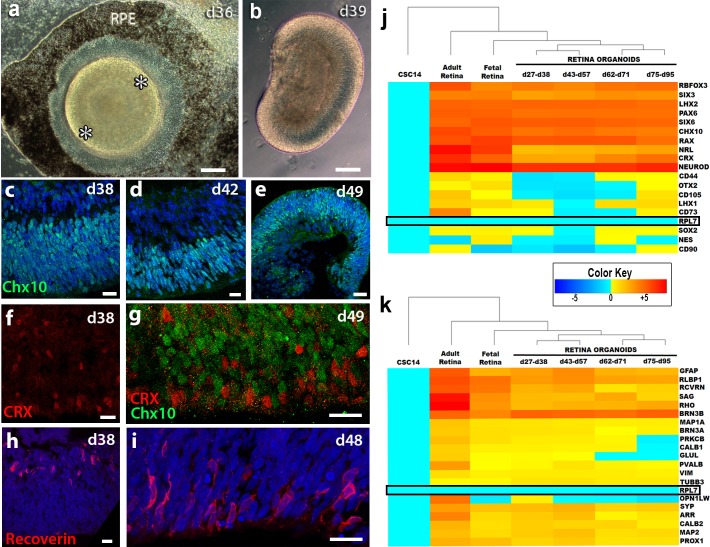
For differentiation, cultures were dissociated with Collagenase IV. The basal media was supplemented with Xeno-free B27 (Gibco, Gaithersburg, MD, USA). Aggregates formed embryoid bodies in ultra-low adherence dishes and were transferred on a laminin-collagen substrate after 7 to 10 days. After 21 to 36 days, refringent annular structures showing visible laminated morphology would appear in the culture (Fig. 1a). These structures were dissected and placed in suspension culture until time for transplantation (Fig. 1b). Media containing the B27 supplement with no additional growth factors was used throughout the differentiation process and refreshed every 2 to 3 days. Due to extended in vitro culture times, penicillin-streptomycin (Gibco) was periodically added to the media.
Figure 1.
Characterization of retina organoids in vitro. (a) Phase contrast image of retina organoid (RO) in 2D culture at day 36 of differentiation prior to cutting out of dish. A pigmented RPE monolayer can be seen surrounding the organoid. The developing neuroretina is comprised of a raised ridge of cells (white asterisks). (b) Phase contrast image of RO in 3D suspension culture at day 39 of differentiation. A laminar organization can be recognized and the cells themselves are translucent. (c–e) Chx10 expression within day 38, day 42, and day 49 3D ROs. (f) CRX is found as early as day 38 in developing ROs. (g) CRX+ cells at day 49 are localized mostly in the apical region of the organoid and are restricted to a different population than Chx10+ progenitors. (h–i) Recoverin+ cells appear as early as day 38 with basal expression and are later restricted to the apical region by day 48. (j) qPCR of genes critical to retinogenesis and photoreceptor production. Fold expression clustergram comparing adult human retina (n = 5), human fetal retina (n = 4), and stem cell-derived retina organoids at various days of differentiation age ranges (n = 5 to 6). RO tissues are organized according to 2D adherent (27–38 days), in early 3D culture (43–57 days), continued 3D culture (62–71 days), and extended 3D culture (75–95 days). There is temporal progressive differentiation of hESCs into retinal tissue. Normalized to day 0 hESC controls (CSC14) and RPL7 (boxed with black outline) as the housekeeping gene. The dendrogram tree on top was generated using nearest neighbor linkage. The heatmap color key ranges ±5. (k) qPCR analysis of retinal subpopulations. Many of the cell types that are critical to transplant success and future synaptogenesis are present within the retinal organoid sheet. Ganglion (BRN3A), amacrine (CALB2), horizontal (CALB1), and Müller (GFAP and GLUL) cell populations are alive within the tissue. (c–e, h, i) Nuclei are stained blue with DAPI. (a, b) Scale bar: 200 μm. (d–g) Scale bar: 50 μm.
Quantitative PCR
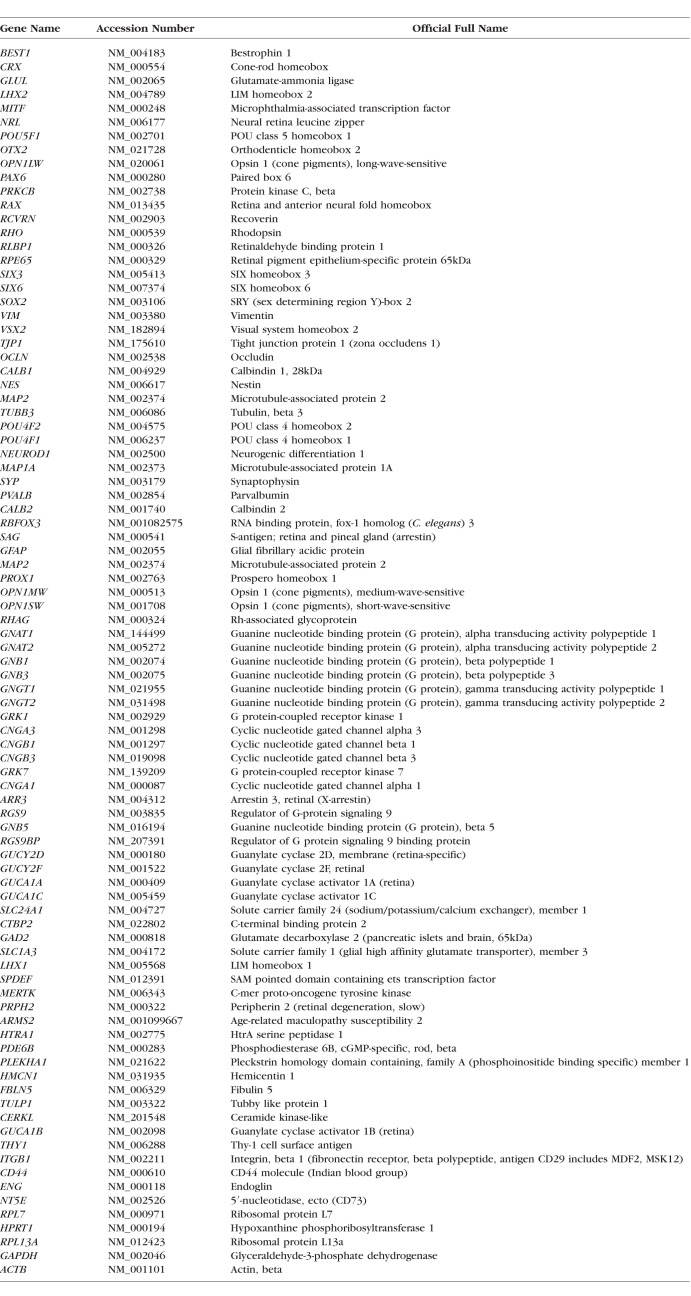
A custom qPCR array (Qiagen, Germantown, MD, USA; Catalog no. CAPH13339) consisting of 84 genes and 5 housekeeping genes (see Table 1) was used to analyze the expression in retina organoids and control (adult and fetal) retinal tissues. Adult human retinal tissue (n = 5) was used as positive control. Human fetal retinal tissues (n = 4) ranging from day 105 to day 145 postconception were obtained from suppliers approved by the Human Stem Cell Research Oversight Committee. Differentiated retina organoids were analyzed at days 27 to 38 (n = 6), days 43 to 57 (n = 6), days 62 to 71 (n = 6), and days 75 to 95 (n = 5). Most samples consisted of pieces remaining from organoids used to produce retinal sheets for transplantation. RNA was isolated using Trizol reagent (Qiagen), DNase I digestion (Fisher, Waltham, MA, USA), and phenol-chloroform extraction (Fisher). cDNA was generated using an RT2 cDNA synthesis kit (Qiagen). Amplification was performed using an RT2 SYBR Green with ROX qPCR master mix (Qiagen). The annealing temperature was 60°C, and amplification was performed with the following conditions: 95°C (10 minutes), 40 cycles at 95°C (1 minute each), and 60°C (30 seconds). Fold expression was calculated using the double delta cycle threshold (Ct) method and normalized to day 0 undifferentiated hESC (line CSC14). For the purpose of analysis and heatmap generation, nondetected amplification in control tissue and organoids were assigned cycle threshold values of 40. Heat maps were generated using an “hclust” R-program algorithm (The R foundation, Vienna, Austria). 2D clustergram dendrograms of sample and gene linkage were calculated using hierarchical complete linkage clustering.40 Figures 1j and 1k display a representative tree schematic based on sample lineages.
Table 1.
List of Genes in qPCR Array
Experimental Animals
Animals were treated in accordance with National Institutes of Health (NIH) guidelines for the care and use of laboratory animals, the ARVO Statement for the Use of Animals in Ophthalmic and Vision Research, and under a protocol approved by the Institutional Animal Care and Use Committee of University of California Irvine. SD-Foxn1 Tg(S334ter)3Lav (RD nude rat) transplant recipients were generated by crossing SD-Tg(S334ter)3Lav rats and NTac:NIH-Whn rats.18
Retina Sheet Preparation
Retina organoids (day 30 to 65 of differentiation) were selected based on transparency and morphologic criteria of a hollow spherical shape with a laminated structure seen under the phase contrast and stereoscope. The structures often contained adherent retinal pigment epithelium (RPE) aggregates (Supplementary Figs. S1a, S1b) that were removed during the preparation of retinal rectangular sheets (1.0–1.7 × 0.6 mm) for transplantation (Supplementary Figs. S1c, S1d).
Transplantation
Recipient rats (26–38 postnatal day, either sex) were randomized into nonsurgery age-matched controls (AMCs) (n = 10), sham surgery (n = 11), and transplant (n = 25) experimental groups (17 different surgery sets). Some transplanted animals were used only for histology (n = 7) and not for functional tests to investigate transplant development. Several rats were eliminated from analysis after the first or second optical coherence tomography (OCT) exam (n = 4) because of faulty surgeries or corneal ulcers. Two transplant rats could not be used for the final analysis because they died before recording.
Rats received a subcutaneous injection of ketoprofen (4 mg/kg) (Zoetis, Parsippany-Troy Hills, NJ, USA) and dexamethasone eye drops (Bausch & Lomb, Inc., Rancho Cucamonga, CA, USA) prior to anesthesia to prevent eyelid swelling. After ketamine/xylazine anesthesia (40–55 mg/kg ketamine, 6.0–7.5 mg/kg xylazine), pupils were dilated by 1% atropine eye drops (Akorn, Lake Forest, IL, USA). Eyes were disinfected with ophthalmic betadine (Alcon, Fort Worth, TX, USA). Nonsurgical eyes were kept moist by artificial tears (Akorn). During surgery, the eye was frequently treated with 0.5% tetracaine (Bausch & Lomb) and 0.1% dexamethasone eye drops (Bausch & Lomb).
Transplantation of retinal sheets has been previously described.41 Briefly, a small incision (∼1 mm) was made posterior to the pars plana, parallel to the limbus, followed by local retinal detachment. Donor tissue was placed (not injected and not pushed) into the subretinal space of the left eye by using a custom implantation instrument with a flat rat curved nozzle (opening, 0.22 mm) that protected the donor tissue inside the nozzle tip, with minimal accompanying liquid (Supplementary Figs. S1e–j). Sham surgery consisted of injecting media alone. The incision was closed with 10-0 sutures. For recovery, the surgical eye received additional eye drops of betadine and application of a gentamycin/polymycin/bacitracin ointment (Bausch & Lomb).
Spectral-Domain OCT (SD-OCT) Imaging
SD-OCT imaging (Bioptigen Envisu R2200; Bioptigen, Research Triangle Park, NC, USA) was used to document and monitor the transplant as it developed in the host retina. The general protocol was described previously.6 Transplanted rats (n = 25) were imaged every 1 to 2 months, starting 2 weeks after surgery, up to 9.5 months of age (8.5 months postsurgery). Rats with transplant misplacement into the vitreous and excessive surgical trauma, such as optic nerve or corneal damage, were excluded from further analysis (n = 4). The last scan was scheduled as close as possible to the terminal SC recording. Sham (n = 10) and nonsurgery RD nude rats (n = 10) were imaged at approximately similar ages.
Quantification of SD-OCT
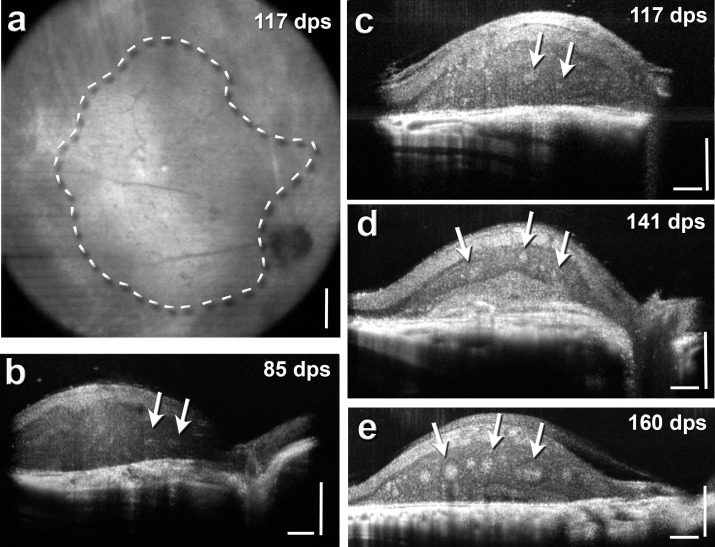
The area of the transplant was determined by using sequential cross-sectional B-scans to define the host/donor boundary. These positions were then compared to the corresponding locations in the fundus image to outline the transplant (Fig. 2a). The InVivoVue program (Bioptigen) contains calipers that were used to create several geometric figures to overlay the transplant border. Length and width (mm) were measured to generate estimates of area (mm2). The sum of all geometric figures per transplant was defined as the transplant area. The distance from the optic nerve was calculated for the ventral edge, dorsal edge, and approximate center of the transplant. The angle between both the dorsal edge and ventral edge connecting lines was calculated and termed “edge angle”. Data are summarized in Table 2.
Figure 2.
OCT analysis of transplant development and growth. (a) Representative fundus image of transplant no. 7 at 117 days postsurgery (dps) that showed a strong response in the SC. The borders of the transplant are outlined with a dashed line (according to B-scans) and the optic nerve is visible. The overall shape was determined using cross-sectional B-scans. An example of a B-scan for this transplant can be seen in (c). (b–d) Some representative retinal cross-section B-scans of various transplanted animals. B-scans are stretched vertically in order to see the layers better. The images show the transplants in the degenerated host retina with rosettes (arrows) at various dps. Transplants in (b–d) had been recorded for visual responses in the SC. (a) Scale bar: 300 μm. (b–d) Horizontal and vertical scale bar: 200 μm.
Table 2.
SC Recording and OCT Analysis of Transplanted RD Rats
Optokinetic Response Testing
At ages corresponding to 2 to 3, 4 to 5, and 6 months postsurgery, the visual acuity of RD nude rats (transplanted, sham surgery, and nonsurgery AMCs) was measured by recording optomotor responses to a virtual cylinder, with alternating black and white vertical stripes at six different spatial frequencies (Optomotry, Cerebral Mechanics, Alberta, Canada), as previously described.6 Rats were dark-adapted for at least 1 hour prior to testing. The best visual acuity of two same-day tests was used for analysis. Video recordings were evaluated off-line by two independent observers blinded to the experimental condition. If there was a discrepancy between the two observers, videos were reanalyzed by a third observer and data discussed before giving a final score (prior to decoding the experimental condition).
SC Electrophysiologic Recording
Visual responses from the SC were recorded as previously described after overnight dark-adaptation.6 In brief, the rats were recorded at the age of 5 to 11 months (4–10 months after surgery for surgery rats). During the recording, the tester was blinded to the group allocation of the animals. Multiunit electrical responses were recorded from 50 to 70 locations on the SC surface, approximately 200 to 400 μm apart, by using a tungsten microelectrode (0.5 MΩ impedance; MicroProbe, Inc., Carlsbad, CA, USA). At each location, light stimuli (20 ms, +0.58 to −6.13 log cd/m2) were delivered approximately 10 times at 10-second-intervals. When responses were found, the intensity of light stimuli was reduced until there was no response in order to determine the response threshold. Responses to the strongest light stimuli (stimulus level 0.58 log cd/m2) were quantified into a map over the area of the SC. All spikes occurring 30 to 210 ms after the onset of the photic stimulus were counted. Spike counts and locations of responses were analyzed using a custom MATLAB program (Mathworks, Natick, MA, USA). Results are listed in Tables 2 and 3.
Table 3.
Summary of SC Electrophysiology Recording of All Rats
Histology and Immunofluorescence
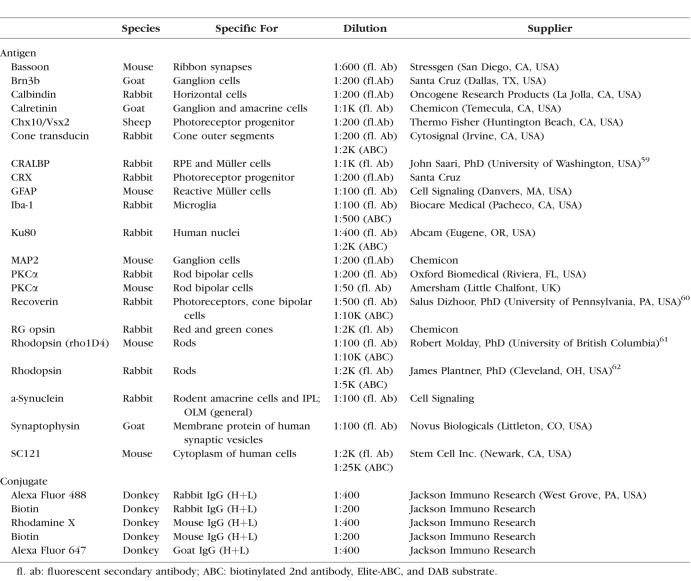
After rats were euthanized with an injection of an anesthetic overdose, they were perfusion-fixed with cold 4% paraformaldehyde in 0.1 M Na-phosphate buffer (transplanted rats, n = 25; sham surgeries, n = 11; AMCs, n = 10). After opening the cornea, eyes were postfixed for 1 to 2 hours. Eye cups were dissected along the dorso-ventral axis, cryoprotected (30% sucrose), and frozen in optimum cutting temperature compound. Retina organoids were frozen using a similar procedure.6 Serial 10-μm cryostat sections were stored at −20°C. Every fifth slide was stained using hematoxylin and eosin and imaged on an Olympus BXH10 (Center Valley, PA, USA) using an Infinity 3-1U camera (Lumenera, Ottawa, Ontario, Canada). For immunofluorescence and diaminobenzidine (DAB) analysis, we used Histo-VT One (Nacalai USA, Inc., San Diego, CA, USA) for antigen retrieval of cryostat sections at 70°C. Primary and secondary antibodies are listed in Table 4. Primaries were left on sections overnight at 4°C at specified concentrations. Slides were incubated for at least 30 minutes at room temperature in fluorescent or biotinylated secondary antibodies. Fluorescent sections were coverslipped using Vectashield mounting media (Vector Labs, Burlingame, CA, USA) with 5 μg/mL 4,6-diamidino-2-phenylindole (DAPI).
Table 4.
Antibodies Used in This Study
For DAB staining, sections were incubated with an ABC kit (Vector Labs) after incubation with the biotinylated secondary antibody and developed with DAB for up to 4 minutes. Ionized calcium binding adaptor molecule 1 (Iba-1)-DAB stained cells were counted using ImageJ (version 1.51g) on representative sections of NIH nude rats (n = 3, 3 sections per animal), AMCs (n = 9), sham surgeries (n = 11), and transplants (n = 19). Counts of three independent observers were averaged and are shown as cells/μm2 retinal area (Fig. 3m).
Figure 3.
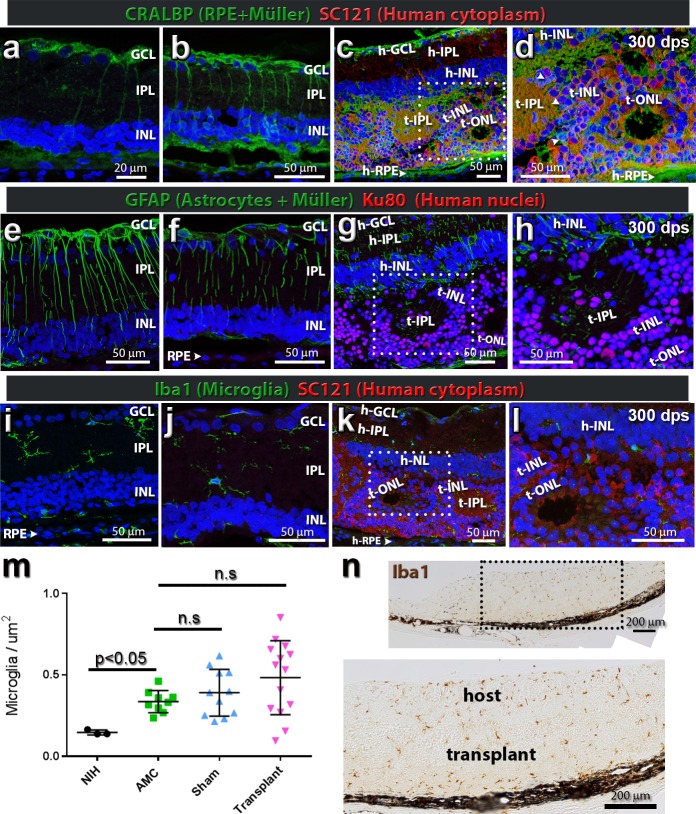
Glial cell and immune response to RD and transplantation. (a–d) CRALBP expression (green) with normal protein localization in Müller cells and RPE, as seen in (a) postnatal day (P)30 RD and (b) sham surgery at 169 dps. (c, d) At 300 dps, a transplanted RD animal shows the host Müller cells integrating with the SC121+ donor tissue (red). (d) Boxed area in panel (c). There is some suggestive colabeling of CRALBP, with SC121 indicative of donor-derived Müller glia (arrow heads). (e–h) GFAP expression in a P30 RD rat (e) (time of transplantation), (f) sham surgery at 169 dps, and (g, h) transplanted animals. GFAP levels increased in the host Müller cells in response to the underlying RD, surgery trauma, and transplant tissue. Donor nuclei in (g, h) are Ku80+ (red). There are host Müller cell projections reaching into the retinal sheet and they interact with Ku80+ transplant cells. (i–l) Iba-1-immunoreactive microglia (green) (i) in the nontransplanted P31 nude RD retina microglia are restricted to the IPL and choroid (n = 3). Microglia cells are mostly negative for major histocompatibility complex II and CD68 (data not shown). (j) Sham surgery (n = 4) (example shown is 181 dps). (k–l) Transplanted recipient animals (n = 9) (example shown is 300 dps). SC121 immunoreactivity of the human donor cytoplasm (red) defines host/donor boundary. The resident microglia populations can be found in the IPL and areas of surgical damage. Occasionally, microglia can be found within transplant rosettes (not shown). Images are oriented with the GCL on top and RPE layer on the bottom. In all panels, nuclei are stained blue with DAPI. Scale bars: 50 μm, except for (a) (20 μm). (m) Quantification of Iba-1 counts: Iba1+ cells were counted per section, normalized to retinal area (μm2), averaged over three adjacent sections and organized into the four following categories: NIH non-RD controls (n = 3), RD AMC (n = 9), RD sham rats (n = 11), and RD transplant rats (n = 19). The only significant difference was between NIH non-RD controls and AMC (P < 0.05). AMC versus SHAM, AMC versus transplant, and NIH versus surgery were nonsignificant (P > 0.05). (n) Representative Iba1 DAB-stained section (transplant no. 7). Transplant is shown with brown Iba1+ cells seen within the transplant and host retina. Scale bar: 200 μm.
Fluorescence was imaged using a Zeiss LSM700 confocal microscope (Zeiss, Oberkochen, Germany) taking tiled stacks of 5 to 8-μm-thickness at 20×, 40×, and 63×. Confocal images were extracted in Zen 2012 software (Zeiss). 3D images were extracted separately for each channel and combined in Adobe Photoshop CS6 software (San Jose, CA, USA). Volocity (×64) software (Perkin-Elmer, Waltham, MA, USA) was used to obtain higher magnification 3D opacity-rendered images that could be rotated for better viewing of the 3D structures.
Statistical Analysis
For all statistical analyses, the significance level was calculated in Graphpad Prism software (Graphpad Software LLC, La Jolla, CA, USA) with paired and unpaired two-tailed t-tests using mean ± SEM. The level of significance was set at 0.05.
Results
Development and Characterization of Retina Organoids
After 21 days of hESC differentiation, neural retinal structures could be identified by a refringent annular structure that showed laminated morphology, and after another 7 days, an epithelial “sack” with evident pigmentation developed (Fig. 1a, asterisks). The annular neural structures reassembled an eye field, previously described as horseshoe-shaped.11 This morphology was strikingly suggestive of eye development; thus, the in vitro structure was designated as a “retina organoid”. These structures were characterized by a flattened area and a curved ridge of multilayered cells often surrounded by a RPE monolayer (Fig. 1a). Neural retina structures that clearly delimited from the surrounding cells were dissected out at days 30–42 by using a microspatula and placed into a suspension culture. In the absence of an adherent substrate, the dissected structures developed into mini 3D eye cups, with some containing an RPE aggregate on one side (Fig. 1b; Supplementary Figs. S1a, S1b). The retina organoid continued its development and the cells expressed Chx10, CRX, recoverin (Fig. 1c–g), Brn3b, calbindin, CRALBP, and MAP2 (Supplementary Figs. S2 a–l) at various timepoints. Marker expression changed over time and localization could shift between the apical and basal regions of the organoid as subpopulations appeared and proteins became restricted to certain cell types. The Brn3b+ ganglion cells (Supplementary Figs. S2 a–c) and the Chx10+ photoreceptor progenitors (Fig. 1d) were on polar opposite areas of the structures. A slightly modified mix of cell populations appeared at different timepoints, with day 43 to day 57 having the most diversity (Fig. 1j–k).
Quantitative PCR gene analysis compared expression patterns between adult human retina, human fetal retina, and stem cell-derived retina organoids (4 groups, 27–95 days of differentiation) by using an array of 84 genes (Table 1). Representative heatmaps of selected genes display the varying expression levels amongst the tissues (Figs. 1j–k). The first heatmap displays early eye field (CHX10, LHX2, and RAX) and photoreceptor progenitor markers (CRX, NRL, and CD73) (Fig. 1j), and the second heatmap displays genes that are found in the various retinal subpopulations, such as ganglion (BRN3A), amacrine (CALB2), horizontal (CALB1), and Müller cells (GFAP and glutamine synthetase [GLUL]) (Fig. 1k). A hierarchical clustering along the sample axis compares gene expression patterns of retina organoid tissues with day 0 (undifferentiated) stem cells, day 105 to 145 fetal tissues, and adult control retina tissues. There was a similarity between retina organoids and human fetal retina, reflecting the more immature developmental state of the retina organoids. Undifferentiated hESCs expressed almost none of the retinal genes.
OCT Analysis
OCT analysis showed that the transplants were deposited subretinally, with an average distance from the optic nerve of 1.82 ± 0.33 mm and covered an average area of 1.43 ± 0.03 mm2. The transplants exhibited an average size increase of 1.4 ± 0.07. Table 2 summarizes the measurements. Transplants matured and developed subretinally, with the formation of photoreceptor rosettes. Examples of OCT images are shown in Figure 2, with arrows pointing out the hyperreflective photoreceptor rosettes within transplants (Figs. 2b–e). Rosettes only appeared after several months in vivo (Supplementary Fig. 3).
Immunohistochemic Analysis of Host Microglia and Müller Cell Response
Figures 3a–d show CRALBP immunoreactivity in Müller and RPE cells. Transplants exhibited stronger CRALBP immunoreactivity than the host retina, with Müller cells extending radial processes in rosettes (Figs. 3c, 3d). The host Müller cells were highly active and expressed GFAP throughout the cell body in response to RD and the surgical trauma (Figs. 3e–h). Populations of Iba1-immunoreactive microglia were present in the inner plexiform layer (IPL) of the degenerating host retina on the day of surgery (Fig. 3i). There was a significant increase of Iba-1 cells in age-matched RD rats compared to NIH non-RD rats (Fig. 3m; P > 0.05). After transplant, microglia cells were found within the transplanted tissue (Fig. 3k, 3j–l). There was a wider variation of microglia number per μm2 in transplanted retinas than seen in sham controls (Fig. 3m). The Iba1 counts in transplanted retinas were not significantly different from sham and age-matched RD controls (Figs. 3i, 3j, 3m; P > 0.05), although the variation within the transplant group might explain the P value.
Immunohistochemic Analysis of Transplant Cell Type Development and Connectivity
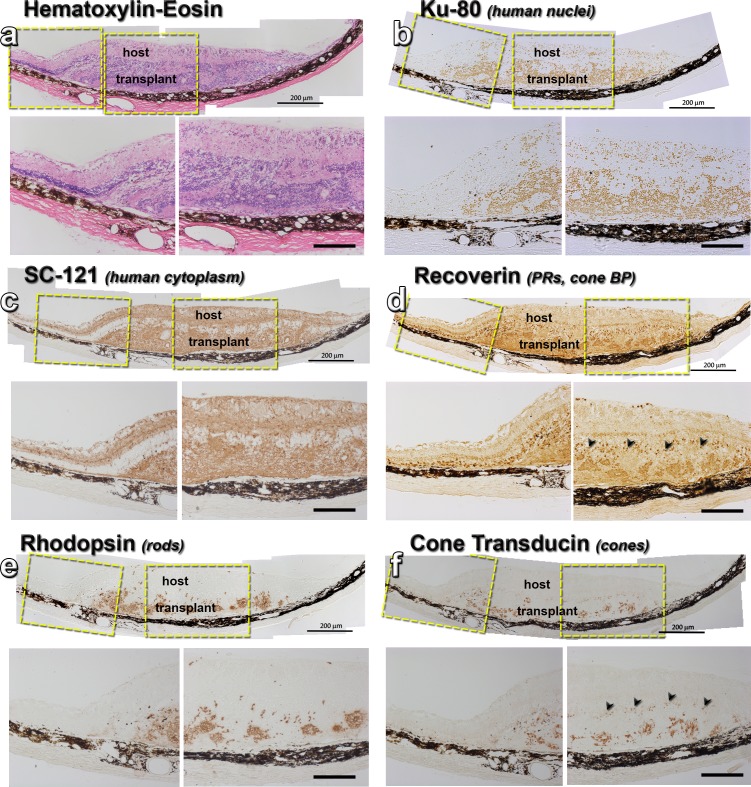
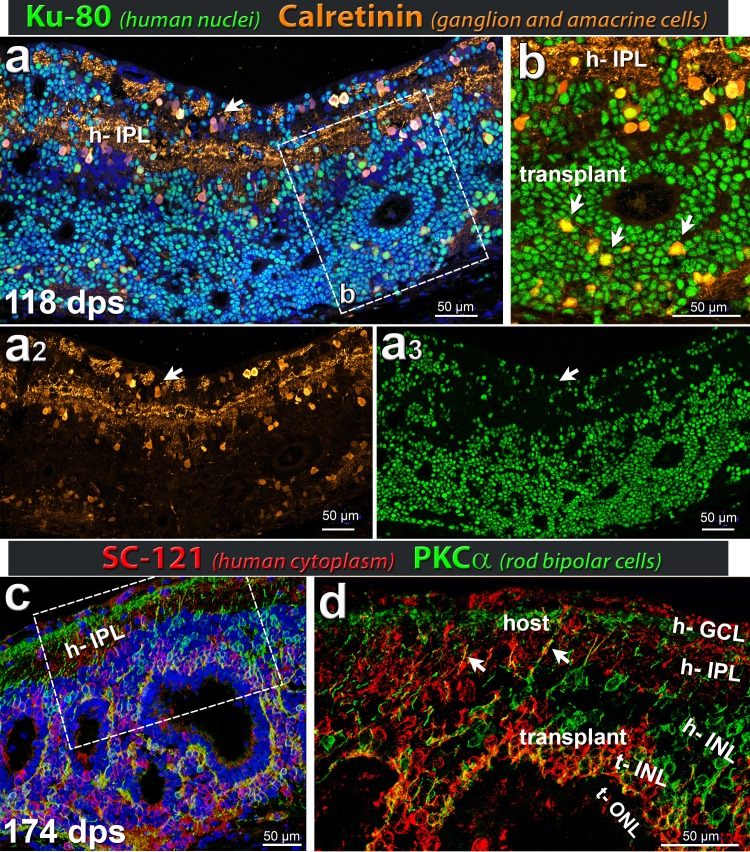
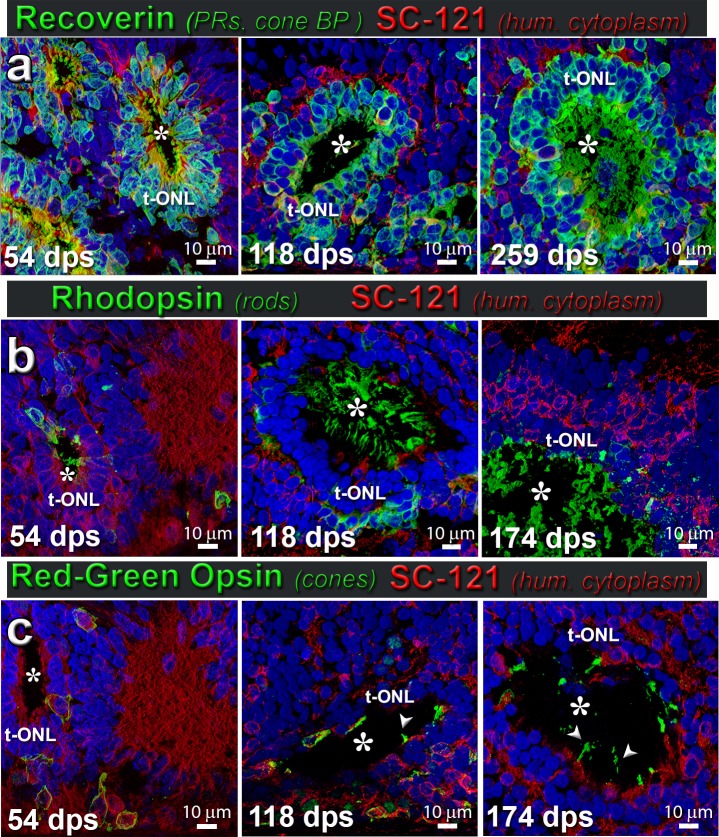
At the time of transplantation, the donor tissue had no mature photoreceptors, as determined by qPCR and histology (Figs. 1c–k). The retinal organoids had also no mature cones (opsin+) or rods (rhodopsin+), but contained photoreceptor precursors (CRX+ and recoverin+) (Figs. 1g, 1i). Staining with antibodies directed against the human cytoplasmic marker stem cell 121 (SC121; STEM 121) and the nuclear marker Ku80 confirmed the distribution of transplanted tissue within the host subretinal space (Figs. 3–8). Figure 4 shows histology and DAB staining of donor and photoreceptor markers in a representative transplant. At the time of analysis (6 months postsurgery), all rod photoreceptors (rhodopsin +) were of organoid origin (identified by SC121 and Ku80) and not rescued host cells (Figs. 4e, 6a). Transplant cones showed strong cone transducin immunoreactivity, whereas staining in the host was very faint (Fig. 4f). Normal rat retina stained well for these photoreceptor markers (data not shown). Transplanted retina organoids were able to develop donor-derived horizontal, bipolar, and amacrine cells (Figs. 5a–c). Retinal organoids produced red-green opsin+ cones, rhodopsin+ rods, and recoverin+ photoreceptors organized into rosettes, with putative outer segments elongating and maturing over time, following the longer human developmental timetable (Fig. 6a–c).
Figure 4.
Histology of transplant no. 7 with best SC response. Each panel shows an overview of the transplant area, with enlargements of the transplant-host interface and main transplant area underneath. (a) Hematoxylin-eosin staining of a 183 dps transplant in the subretinal space of an RD rat. (b) Ku80 stain (human nuclei) stains the transplant. Some donor cells have migrated into the host retina. (c) SC121 staining (human cytoplasm) shows donor processes extending into host retina. (d) Recoverin (photoreceptors, cone bipolar cells) staining of transplant rosettes. There are some remaining host recoverin+ cones and they are highlighted by black arrows in the enlargement. (e) Rhodopsin staining of transplant rosettes. No stain in host. (f) Cone transducin staining of transplant rosettes. Only very faint, scattered stain (black arrows) in host. Scale bars: 200 μm.
Figure 5.
Expression of calretinin and PKCα (amacrine and rod bipolar cells) in hESC-derived retinal transplant (markers Ku80 or SC121). (a, b) Ku80 (green) stains human nuclei (transplant), appearing turquoise in panel (a) because of underlying DAPI nuclear stain. Calretinin (gold) is expressed in ganglion and amacrine cell bodies in addition to processes in the host IPL. The inset (b) highlights donor Ku80+ calretinin+ cells (white arrows) in the transplant INL close to the transplant OPL interacting with photoreceptor rosette. Calretinin+ cells in transplant resemble inner retinal (amacrine) cells in morphology. Single channels are shown in (a2). Calretinin (gold) and (a3) Ku80 (green). Note that many transplant cells have migrated into the host GCL (arrow) (n = 5). (c, d) SC121 (red) labels human cytoplasm and PKCα (green) is a marker of rod bipolar cells. The transplanted tissue develops rod bipolar cells in the INL surrounding the rosettes, forming dendritic terminals in the OPL of rosettes. Their processes extend into host IPL and GCL (arrows in [d] point to two examples). (d) Boxed area in panel (c) without DAPI allows for better visualization of the host IPL and donor invaginating projections (red) (n = 5). (a–c) Nuclei are stained blue with DAPI. Scale bars: 50 μm.
Figure 6.
In vivo photoreceptor development in hESC-derived retinal transplants over time. (a) Recoverin (photoreceptors and cone bipolar cells, green) and SC121 (human cytoplasm, red) at different stages postsurgery (54, 118, 259 dps). Putative outer segments can be seen at 259 dps (asterisk in lumen of rosette). There were no transplants with parallel layers, but there was layer organization around the rosettes with formation of a distinct ONL (label t-ONL), OPL, and INL. A rosette is a spherical arrangement of photoreceptors and other retinal layers around a lumen (white asterisks; n = 7). (b) Rhodopsin (green; rods) and SC121 (red); minimal rhodopsin labeling in younger transplants (SC121+, red) (white asterisk; 54 dps), with only a few cells positive for rhodopsin, but increasing gradually with age (118 dps) and localized to the outer segments (174 dps) (n = 5). (c) Red-green (RG) opsin (green) and SC121 (red); at 54 dps, RG opsin is expressed in the budding cones beginning to develop within the rosettes. At more than 100 dps, RG opsin expression is seen in the developing outer segments (arrowheads) of cones within rosettes, and cone frequency increased with age of transplant (174 dps) (n = 8). (a–c) Nuclei are stained blue with DAPI. Scale bars: 10 μm (a–c).
Figure 7.
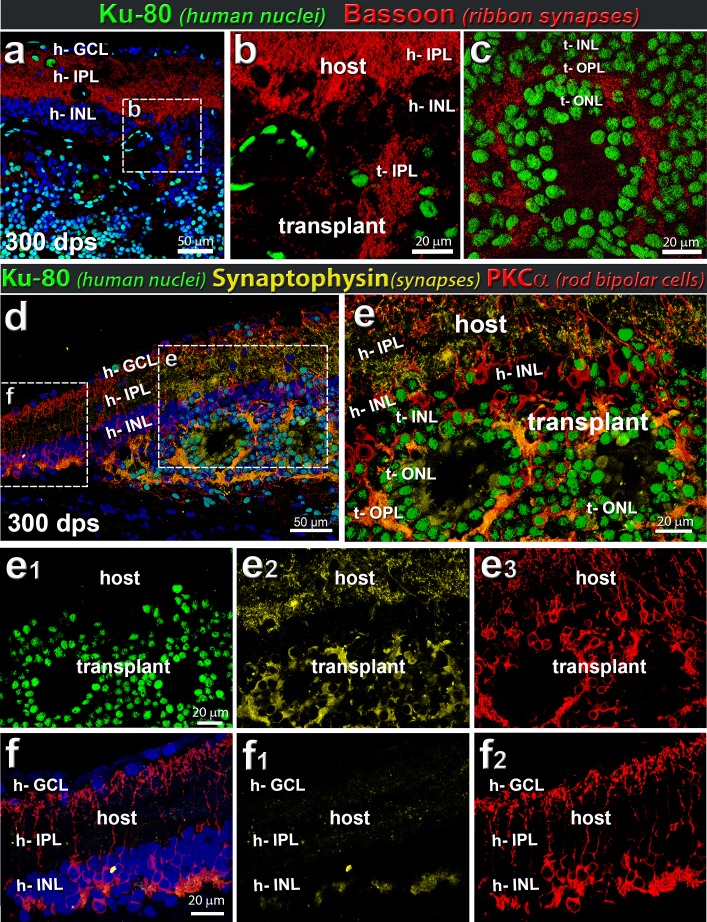
Rat host and human retinal transplant synaptic markers. Example of transplant at 300 dps. (a–c) Combination of Bassoon (red, indicative of ribbon synapses) and Ku80 (human nuclei, green) (n = 5). (a, b) Ribbon synapses (bassoon; red) are found in the host bipolar cells demarcating host IPL. (a–c) Ribbon synapses can be seen within the transplant (Ku80; green) and surrounding rosettes. The donor bipolar cells generate a bassoon-staining IPL (t-IPL) (b) and donor photoreceptors create a bassoon-immunoreactive OPL (t-OPL) (c). (d–f) Combination of synaptophysin (yellow), PKCα (red), and Ku80 (green). Within transplant (example at 300 dps), Ku80+ PKCα+ cells express high levels of synaptophysin, as would be expected of functioning human neurons. (d) Overview image of transplant. € Enlargement of transplant/host interface. The ONL surrounding the photoreceptor rosettes highly expresses synaptophysin, indicative of functional neurons and connectivity. Note the extensive synaptophysin immunoreactivity (yellow) in the IPL of the host retina (e, e2). Single channels are shown in (e1) Ku80 (green), (e2) synaptophysin (yellow), and (e3) PKCα (red). (f) Enlargement of host retina adjacent to transplant, containing no Ku80+ transplant cells. Single channels (f1) synaptophysin (yellow), and (f2) PKCα (red). Note that there is significantly less synaptophysin immunoreactivity in the IPL in this area (f1) compared to the host IPL overlying the transplant (e2). (a, d, f) Nuclei are stained blue with DAPI (n = 5).
Figure 8.
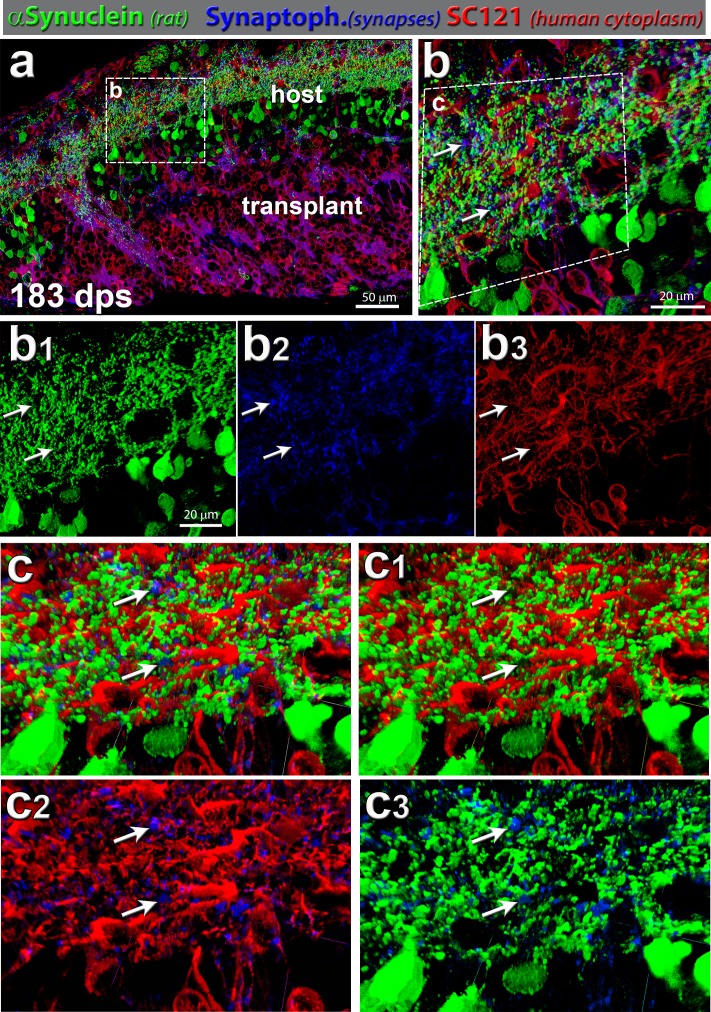
Synaptic connectivity: rat-specific α-synuclein (green), synaptophysin (blue), and SC121 (human cytoplasm, red). (a) Transplant processes (SC121, red) were well integrated within host retina (rat α-synuclein, green) and showed functional connectivity, which was evident with synaptophysin (blue) labeling in transplant (red) and host (green). This transplant shown (no. 7) had a strong SC light response. It was highly integrated at the host/donor interface. Area of enlargement in (b) is indicated by a white dashed box. (b) Magnification within host IPL: synaptophysin punctate expression can be found uniformly throughout the area of interest (n = 8). Arrows indicate two areas with close contact of blue, green, and red channels (same area indicated in the single channels (b1, b2, b3). (b1) Green channel (rat α-synuclein), (b2) blue channel (synaptophysin), and (b3) red channel (human cytoplasm, SC121). (c) Volocity 3D images of host IPL enlargement in (b). The white arrows indicate the same areas as in (b). (c) All three channels (red-green-blue); (c1) red-green, (c2) red-blue, and (c3) green-blue.
Synaptic connectivity was further analyzed using antibodies specific for SC121 (human cytoplasm), synaptophysin (synapses), bassoon (general ribbon synapses), and α-synuclein (rodent IPL and amacrine cells) (Figs. 7, 8). Bassoon labeling, indicative of ribbon synapses, was found in the host IPL and in synaptic areas of the transplant (Ku80; green), around rosettes in the donor IPL and outer plexiform layer (OPL) (Figs. 7 a–c). Transplant processes (SC121; red) extended into the host region and were well integrated within host retina IPL (α-synuclein; green) (Figs. 7d–I, 8a–d). The host IPL showed increased immunoreactivity for synaptophysin (yellow in Fig. 7 and blue in Fig. 8) close to the transplant compared to further away, suggesting synaptic connectivity between the transplant and host.
Visual Function Improvement Evaluated by OKT
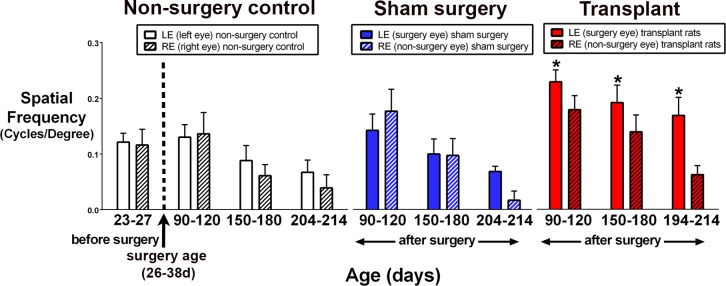
The visual acuity of RD rats was already reduced at 23 to 27 days of age, corresponding to 3 to 7 days before surgery (Fig. 9). Visual acuity significantly decreased with age in nonsurgery AMC RD rats (n = 9) and sham surgery RD rats (n = 11) (Fig. 9), as measured by paired t-tests (between eyes of the same animals) and unpaired t-tests (between experimental groups). There was no significant difference between left eye and right eye in sham surgery and AMC groups and no difference between AMC and sham control rats. In addition, the right nonsurgery eyes of the transplanted rats (n = 12) showed the same degree of visual acuity loss as nonsurgery AMC and sham surgery rats. However, at 2 to 3 months postsurgery, significant improvement was observed in the transplanted eyes compared to the nonsurgery right eyes of the same rats. This difference became larger at later timepoints (Fig. 9). The improvement was also significant compared to nonsurgery AMC and sham surgery rats (P < 0.05; Fig. 9). However, all values were lower than those of NIH nude rats with a normal retina (0.42 ± 0.03 cycles/degree); this is similar to our previous paper6 as the rho S334ter-3 rat never develops outer segments.21
Figure 9.
Significantly better visual acuity after transplantation (OKT test). At the age of 23 to 27 days (corresponding to 2–3 days before surgery), visual acuity of nonsurgery RD rats is about the same as at the age of 90 to 120 days. Visual acuity was improved significantly (P < 0.05) in transplanted versus nonsurgery (control) eyes postsurgery at 90 to 120, 150 to 180, and 194 to 214 days of age (paired t-tests between eyes of same animals), and when compared with presurgery testing. The improvement in transplanted rats was also significant compared to nonsurgery AMC and sham animals (unpaired t-tests). Transplanted rats: age 90 to 120 days, n = 11; 150 to 180 days, n = 12; 194 to 214 days, n = 12. AMC: 23 to 27 days, n = 12; 90 to 120 days, n = 8; 150–180 days, n = 9; 204 to 214 days, n = 8; sham surgery, 90 to 120 days, n = 11; 150 to 180 days, n = 9; 204 to 214 days, n = 3.
Visual Function Improvement Evaluated by SC Electrophysiologic Recording
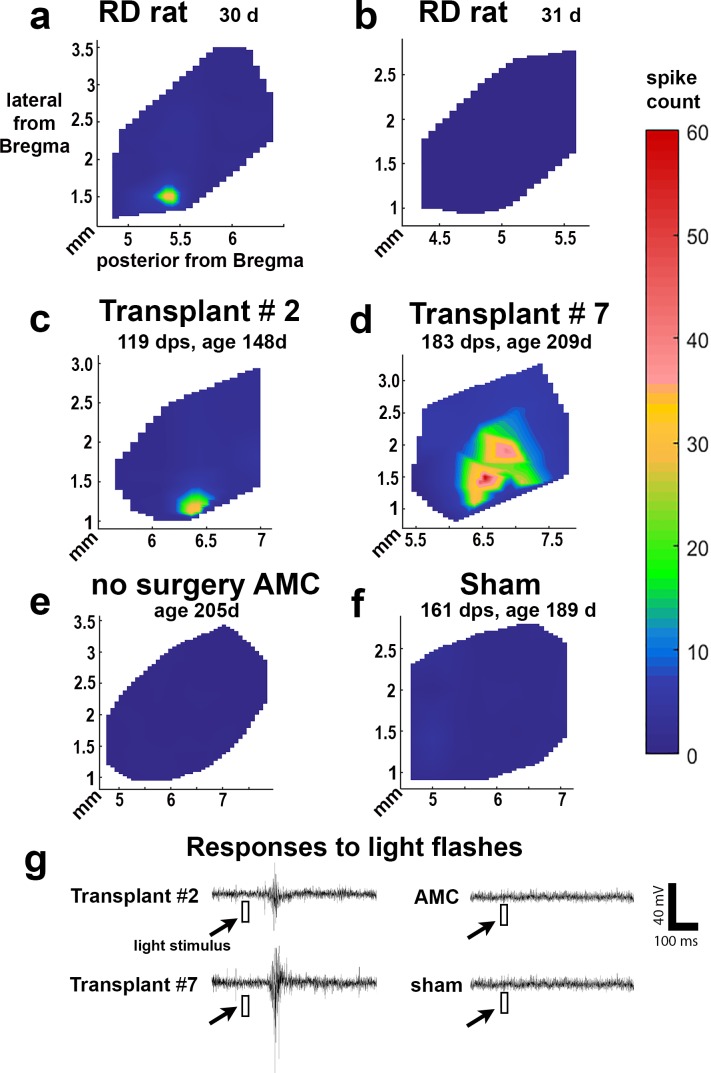
In rats with normal vision, a flash of light can easily evoke a response in the whole area of the SC. The lowest light intensity that can evoke a response is −5.8 log cd/m2 (data not shown).6,35 Figures 10a and 10b show that at postnatal day 30 (P30), the approximate time of transplantation, the RD rats had lost most of their visual function. Only the maximum light level (+0.58 log cd/m2) in the test range could stimulate a response in a small area of the SC in 3 of 6 rats (max spike count, 40). After transplantation, at the age of 5 to 11 months, 9 of 13 rats showed responses to flashes of light in the SC (Figs. 10c, 10d; Tables 2, 3). Five transplanted rats showed responses to dimmer light (the best light threshold was −0.15 log cd/m2) (Tables 2, 3). No responses could be evoked in any SC area of control nonsurgery AMC rats (n = 8) (Fig. 10e) and sham surgery rats (n = 6) (Fig. 10f; Table 3) at the maximum light level (+0.58 log cd/m2). The vision improvement demonstrated in the transplant group was significant compared to the AMC and sham surgery groups (P < 0.05; Table 3).
Figure 10.
Electrophysiologic recording in SC, increased responses in transplanted rats (Tables 2, 3). Representative spike count heatmaps. (a) 1-month-old RD rat with small response and (b) 1-month-old RD rat with no response in the entire SC. The light response could be found in a very small area of SC. Such responses were only found in three of six animals (Table 3). (c, d) Selected transplants show responses in a limited area of the SC. (e) A nonsurgery AMC, and (f) sham surgery. No response was found in the entire SC area of nonsurgery AMCs and sham rats. (g) Example traces of experiments in (a–d) are representative from either the location with the strongest response in transplant rats (c, d) or a random location in nonsurgery AMC and sham rat. The light stimulus (10 msec) is indicated as a white square. The scale bar applies to all traces and the color bar applies to all heatmaps.
Discussion
The current study demonstrates that 3D retina organoid sheets derived from hESCs improve visual acuity and light sensitivity in a model of severe RD. Having a morphology and functionality similar to a fetal retina, stem cell-derived retinal sheets have the potential to be therapeutic. The progenitors within hESC-derived organoids self-assembled into retinal layers in vivo, a feature that has only been accomplished with retina progenitor sheet transplantation6,42 and not with injected dissociated cells.
Retinal tissue differentiated from mouse or hESCs or induced pluripotent stem cells was reported to develop mature photoreceptors within an RD microenvironment.17,42 The new photoreceptors established characteristic structures such as inner/outer segments. The donor tissue integrated with the host IPLs, suggesting possible host-graft synaptogenesis. In our study, the hESC-derived retinal sheets produced a significant vision improvement in transplanted eyes, as determined by OKT testing and SC electrophysiologic recording. The transplantation technique presented here is less traumatic, as the specially designed transplantation instrument protects the tissue during delivery to the subretinal space and does not require folding of the transplanted retina sheet, which would easily cause the tissue to be disturbed.
Most retinal cell transplantation approaches have used dissociated cells to rescue host photoreceptors at early disease stages. In these studies, transplanted cells release growth factors and cytokines that produce a trophic effect, resulting in visual improvement by prolonging host cells' survival.31,43,44 New evidence has emerged suggesting that rather than direct integration of transplanted photoreceptor precursors, cytoplasmic material transfer from transplanted cells may occur to the host photoreceptor cells, resulting in rescuing the host cells in an RD environment.26,27,45,46 The exchange of intracellular content is restricted to photoreceptor-photoreceptor or Müller-photoreceptor interactions. Horizontal, bipolar, Müller, or amacrine cells do not exchange cytoplasmic content with donor cells.27,46–49 The conditions seem to require that the host outer limiting membrane must be disrupted and host photoreceptors relatively healthy. If the cells are too degenerated, rescue is not possible. However, integration of donor cells can still occur alongside cytoplasmic transfer.23 The host microenvironment and disease pathology likely determine the degree to which both mechanisms of integration can occur.
Currently, all models of cytoplasmic transfer involve transplantation of mouse primary or mouse ESC-derived cells as a single-cell suspension into the subretinal space of a mouse host. Whether retinal sheets can transfer material similar to single cells is unknown. In our model, the potential for cytoplasmic transfer is low due to the extreme photoreceptor degeneration in the host that already has happened at the time of transplantation. The host photoreceptors are too defective, with no clear remaining outer nuclear layer (ONL). In addition, the host's RD is immutable due to its root genetic cause. Cytoplasmic transfer will not undo the rod apoptosis triggered by the mutant rhodopsin and the unfolded protein response.
Both OKT testing and SC recording strengthen our study and demonstrate that the transplants improved vision. Transplanted rats perform better in OKT 2 to 3 months after compared with before transplantation, which means that the transplants improved visual acuity. The difference between transplanted and control eyes increased with time due to the slower development of the human transplant and the increased degeneration of the rat host. Any light responses detected at the time of SC electrophysiologic analysis (4 to 10 months postsurgery; rat age 5 to 11 months) are most likely due to the transplants, as histology showed no active host photoreceptors remaining and there were no responses in AMCs or sham controls.6 This is in contrast to another RD model, the Royal College of Surgeons rat, where trophic effects of donor tissue have been documented when the Royal College of Surgeons retina still has functional cones and rods.31,43,44
The S334ter-3 nude rat model has a fast rate of RD and represents an early start of the degeneration process. Most rods are absent at P30 and functional cones are absent by the age of 2 months.3,6,19,20,50 The recipients received donor retina organoids derived from human origins that have a much slower development than the rat. Furthermore, the immunostaining of human cytoplasm SC121 and nuclear marker Ku80 clearly delineate between graft and host tissue, with rod photoreceptor markers observed only in the transplant because rods are gone in the rat host at the time of analysis. Reduction of cone transducin and other phototransduction proteins in the host retina are indicative of poor light-collecting ability19,50 and, therefore, implies that host cones are no longer functional. OCT and histology analysis of host retinal layers in nonsurgery, sham, and transplanted RD rats showed similar rates of degeneration (data not shown). The transplanted retina organoid sheet produced new retinal cells, including photoreceptors. In the donor tissue, rhodopsin+, and red-green Opsin+, photoreceptors only appeared posttransplantation, indicating that new donor photoreceptor development can apparently occur even in a disturbed RD microenvironment.48,51
Analysis of retina organoid development in vitro showed that the cells express critical neuroretinal progenitor transcription factors PAX6, Chx10, CRX, and NRL. Their gene network is most similar to that of a developing fetal retina, with a large population of progenitors and immature developing photoreceptors.52 Those same transcription factors are expressed in the organoid in a pattern similar to fetal tissue, with putative laminar organization of the ONL, IPL, inner nuclear layer (INL), and ganglion cell layer (GCL).
Retina organoid sheets continued to grow in vivo (in spite of the disturbed environment) and developed several mature retinal cell types, including rods/cones and bipolar, Müller, horizontal, and amacrine cells, although they exhibited circular lamination (rosettes), similar to some fetal sheet transplants.5,53,54 After several months postsurgery, synaptic staining allowed for the visualization of important host/donor cell-to-cell interactions within the host IPL. The presence of potentially active synapses (regular and ribbon) within the transplant indicates that these maturing neurons can likely make functionally relevant connections within the transplant and with the host. Bassoon is a scaffold protein found in the ribbon presynaptic zone, allowing fast and continuous neurotransmitter release.55 Bassoon+ synapses are found in the donor OPL between new photoreceptor and donor bipolar cells. In all transplants, donor processes extended extensively into the host region. Increased synaptophysin immunoreactivity within the host IPL (identified by a rat-specific antibody for α-synuclein) indicated a likely transplant-host communication.
OCT has proven to be a valuable tool for analysis in order to monitor transplant growth.6,56 OCT showed that human transplants from embryonic stem cells continued to grow in vivo and survive for at least up to 10 months, the longest timepoint investigated in this study. The ability to image in real time is an advantage for monitoring retinal cell replacement.
Although the rosetted hESC-derived transplants appear disorganized, they share most cell types and features with fetal sheet transplants that develop retinal layers (including photoreceptors), demonstrate host-transplant integration, and improve visual function.5,41,54 What may be missing is a scaffold produced by Müller cells, a main element for retinal organization and lamination.57,58 Our focus will be to improve the lamination of the hESC-derived retina transplants by creating a scaffold and to transplant sheets of hESC-derived retina and RPE together.
In summary, this study shows that hESCs can develop into retinal cells, repair an area of a severely degenerated retina, and improve visual function.
Supplementary Material
Acknowledgments
The authors thank the following for their technical assistance: Stephanie Kayser, MS (Caladrius Biosciences); Tatiana Estrada-Hernandez (Caladrius Biosciences); Rockelle Robles (AIVITA Biomedical); and Robert Lin, PhD, Jaclyn Sigman, Luxi Zhang, Jessica Quynh Huong Duong, Marissa Mahtob Marie Monazzami, Dakota Christine Hollister, Derek C.Y. Lee, Jacson Wan, Prarthana Somaiah, Mylei Tran, Catherine Kloesel, Mony Sary, Johannes Santoso, Tina Karimi, and Tej Kalakuntla (all Univeristy of California Irvine). The authors thank Brian Cummings, PhD (University of California Irvine) and Len Kitzes, PhD (University of California Irvine) for scientific advice, David Gamm, MD, PhD (University of Wisconsin) for his kind gift of immunodeficient S334ter-3 rat breeding pairs, and all the past and current students of the Seiler laboratory for their excellent and enthusiastic research assistance.
Supported by CIRM Grant TR4-06648 (MJS) and NIH Grant R01EY024045 (HSK). This study was made possible in part through access to the Optical Biology Core Facility of the Developmental Biology Center, a shared resource supported by the Cancer Center Support Grant (CA-62203) and Center for Complex Biological Systems Support Grant (GM-076516) at the University of California, Irvine.
Disclosure: B.T. McLelland, None; B. Lin, None; A. Mathur, None; R.B. Aramant, Ocular Transplantation LLC (E), P; B.B. Thomas, None; G. Nistor, AIVITA Biomedical, Inc. (E); H.S. Keirstead, AIVITA Biomedical, Inc. (E, S); M.J. Seiler, P
References
- 1. Wong WL, Su X, Li X,et al. . Global prevalence of age-related macular degeneration and disease burden projection for 2020 and 2040: a systematic review and meta-analysis. . 2014; 2: e106– e116. [DOI] [PubMed] [Google Scholar]
- 2. Woch G, Aramant RB, Seiler MJ, Sagdullaev BT, McCall MA. . Retinal transplants restore visually evoked responses in rats with photoreceptor degeneration. . 2001; 42: 1669– 1676. [PubMed] [Google Scholar]
- 3. Sagdullaev BT, Aramant RB, Seiler MJ, Woch G, McCall MA. . Retinal transplantation-induced recovery of retinotectal visual function in a rodent model of retinitis pigmentosa. . 2003; 44: 1686– 1695. [DOI] [PubMed] [Google Scholar]
- 4. Thomas BB, Seiler MJ, Sadda SR, Aramant RB. . Superior colliculus responses to light - preserved by transplantation in a slow degeneration rat model. . 2004; 79: 29– 39. [DOI] [PubMed] [Google Scholar]
- 5. Seiler MJ, Aramant RB. . Cell replacement and visual restoration by retinal sheet transplants. . 2012; 31: 661– 687. [DOI] [PMC free article] [PubMed] [Google Scholar]
- 6. Seiler MJ, Lin RE, McLelland BT,et al. . Vision recovery and connectivity by fetal retinal sheet transplantation in an immunodeficient retinal degenerate rat model. . 2017; 58: 614– 630. [DOI] [PMC free article] [PubMed] [Google Scholar]
- 7. Radtke ND, Aramant RB, Petry HM, Green PT, Pidwell DJ, Seiler MJ. . Vision improvement in retinal degeneration patients by implantation of retina together with retinal pigment epithelium. . 2008; 146: 172– 182. [DOI] [PubMed] [Google Scholar]
- 8. Seiler MJ, Thomas BB, Chen Z, Wu R, Sadda SR, Aramant RB. . Retinal transplants restore visual responses: trans-synaptic tracing from visually responsive sites labels transplant neurons. . 2008; 28: 208– 220. [DOI] [PubMed] [Google Scholar]
- 9. Seiler MJ, Aramant RB, Thomas BB, Peng Q, Sadda SR, Keirstead HS. . Visual restoration and transplant connectivity in degenerate rats implanted with retinal progenitor sheets. . 2010; 31: 508– 520. [DOI] [PMC free article] [PubMed] [Google Scholar]
- 10. Nakano T, Ando S, Takata N,et al. . Self-formation of optic cups and storable stratified neural retina from human ESCs. Cell Stem . 2012; 10: 771– 785. [DOI] [PubMed] [Google Scholar]
- 11. Zhong X, Gutierrez C, Xue T,et al. . Generation of three-dimensional retinal tissue with functional photoreceptors from human iPSCs. . 2014; 5: 4047. [DOI] [PMC free article] [PubMed] [Google Scholar]
- 12. La Torre A, Lamba DA, Jayabalu A, Reh TA. . Production and transplantation of retinal cells from human and mouse embryonic stem cells. . 2012; 884: 229– 246. [DOI] [PubMed] [Google Scholar]
- 13. Mellough CB, Sernagor E, Moreno-Gimeno I, Steel DH, Lako M. . Efficient stage-specific differentiation of human pluripotent stem cells toward retinal photoreceptor cells. . 2012; 30: 673– 686. [DOI] [PubMed] [Google Scholar]
- 14. Osakada F, Ikeda H, Sasai Y, Takahashi M. . Stepwise differentiation of pluripotent stem cells into retinal cells. . 2009; 4: 811– 824. [DOI] [PubMed] [Google Scholar]
- 15. Jayakody SA, Gonzalez-Cordero A, Ali RR, Pearson RA. . Cellular strategies for retinal repair by photoreceptor replacement. . 2015; 46: 31– 66. [DOI] [PubMed] [Google Scholar]
- 16. Lamba DA, McUsic A, Hirata RK, Wang PR, Russell D, Reh TA. . Generation, purification and transplantation of photoreceptors derived from human induced pluripotent stem cells. . 2010; 5: e8763. [DOI] [PMC free article] [PubMed] [Google Scholar]
- 17. Assawachananont J, Mandai M, Okamoto S,et al. . Transplantation of embryonic and induced pluripotent stem cell-derived 3D retinal sheets into retinal degenerative mice. . 2014; 2: 662– 674. [DOI] [PMC free article] [PubMed] [Google Scholar]
- 18. Seiler M, Aramant R, Nistor G,et al. . A new immunodeficient pigmented retinal degenerate rat strain to study transplantation of human cells. . 2014; 252: 1079– 1092. [DOI] [PMC free article] [PubMed] [Google Scholar]
- 19. Martinez-Navarrete G, Seiler MJ, Aramant RB, Fernandez-Sanchez L, Pinilla I, Cuenca N. . Retinal degeneration in two lines of transgenic S334ter rats. . 2011; 92: 227– 237. [DOI] [PMC free article] [PubMed] [Google Scholar]
- 20. Ray A, Sun GJ, Chan L, Grzywacz NM, Weiland J, Lee EJ. . Morphological alterations in retinal neurons in the S334ter-line3 transgenic rat. . 2010; 339: 481– 491. [DOI] [PubMed] [Google Scholar]
- 21. LaVail MM, Nishikawa S, Steinberg RH,et al. . Phenotypic characterization of P23H and S334ter rhodopsin transgenic rat models of inherited retinal degeneration. . 2018; 167: 56– 90. [DOI] [PMC free article] [PubMed] [Google Scholar]
- 22. Yang Y, Mohand-Said S, Leveillard T, Fontaine V, Simonutti M, Sahel JA. . Transplantation of photoreceptor and total neural retina preserves cone function in P23H rhodopsin transgenic rat. . 2010; 5: e13469. [DOI] [PMC free article] [PubMed] [Google Scholar]
- 23. Waldron PV, Di Marco F, Kruczek K,et al. . Transplanted donor- or stem cell-derived cone photoreceptors can both integrate and undergo material transfer in an environment-dependent manner. . 2018; 10: 406– 421. [DOI] [PMC free article] [PubMed] [Google Scholar]
- 24. Giordano-Santini R, Linton C, Hilliard MA. . Cell-cell fusion in the nervous system: alternative mechanisms of development, injury, and repair. . 2016; 60: 146– 154. [DOI] [PubMed] [Google Scholar]
- 25. Singh MS, Balmer J, Barnard AR,et al. . Transplanted photoreceptor precursors transfer proteins to host photoreceptors by a mechanism of cytoplasmic fusion. . 2016; 7: 13537. [DOI] [PMC free article] [PubMed] [Google Scholar]
- 26. Pearson RA, Gonzalez-Cordero A, West EL,et al. . Donor and host photoreceptors engage in material transfer following transplantation of post-mitotic photoreceptor precursors. . 2016; 7: 13029. [DOI] [PMC free article] [PubMed] [Google Scholar]
- 27. Santos-Ferreira T, Llonch S, Borsch O, Postel K, Haas J, Ader M. . Retinal transplantation of photoreceptors results in donor-host cytoplasmic exchange. . 2016; 7: 13028. [DOI] [PMC free article] [PubMed] [Google Scholar]
- 28. Pearson RA, Barber AC, Rizzi M,et al. . Restoration of vision after transplantation of photoreceptors. . 2012; 485: 99– 103. [DOI] [PMC free article] [PubMed] [Google Scholar]
- 29. McGill TJ, Douglas RM, Lund RD, Prusky GT. . Quantification of spatial vision in the Royal College of Surgeons rat. . 2004; 45: 932– 936. [DOI] [PubMed] [Google Scholar]
- 30. Prusky GT, West PW, Douglas RM. . Behavioral assessment of visual acuity in mice and rats. . 2000; 40: 2201– 2209. [DOI] [PubMed] [Google Scholar]
- 31. Luo J, Baranov P, Patel S,et al. . Human retinal progenitor cell transplantation preserves vision. . 2014; 289: 6362– 6371. [DOI] [PMC free article] [PubMed] [Google Scholar]
- 32. Thomas BB, Seiler M, Sadda SR, Coffey PJ, Aramant RB. . Optokinetic test to evaluate visual acuity of each eye independently. . 2004; 138: 7– 13. [DOI] [PubMed] [Google Scholar]
- 33. Thomas BB, Shi D, Khine K, Kim LA, Sadda SR. . Modulatory influence of stimulus parameters on optokinetic head-tracking response. . 2010; 479: 92– 96. [DOI] [PMC free article] [PubMed] [Google Scholar]
- 34. LeVere TE. . The primary visual system of the rat: a primer of its anatomy. . 1978; 6: 142– 169. [Google Scholar]
- 35. Thomas BB, Aramant RB, Sadda SR, Seiler MJ. . Light response differences in the superior colliculus of albino and pigmented rats. . 2005; 385: 143– 147. [DOI] [PubMed] [Google Scholar]
- 36. Prichard JR, Armacanqui HS, Benca RM, Behan M. . Light-dependent retinal innervation of the rat superior colliculus. Anat Rec (Hoboken). 2007; 290: 341– 348. [DOI] [PubMed] [Google Scholar]
- 37. Gonzalez-Cordero A, West EL, Pearson RA,et al. . Photoreceptor precursors derived from three-dimensional embryonic stem cell cultures integrate and mature within adult degenerate retina. . 2013; 31: 741– 747. [DOI] [PMC free article] [PubMed] [Google Scholar]
- 38. Boucherie C, Mukherjee S, Henckaerts E, Thrasher AJ, Sowden JC, Ali RR. . Brief report: self-organizing neuroepithelium from human pluripotent stem cells facilitates derivation of photoreceptors. Stem cells (Dayton, Ohio). 2013; 31: 408– 414. [DOI] [PubMed] [Google Scholar]
- 39. Phillips MJ, Perez ET, Martin JM,et al. . Modeling human retinal development with patient-specific induced pluripotent stem cells reveals multiple roles for visual system homeobox 2. . 2014; 32: 1480– 1492. [DOI] [PMC free article] [PubMed] [Google Scholar]
- 40. Schonlau M. . The clustergram: a graph for visualizing hierarchical and non-hierarchical cluster analyses. . 2002; 3: 316– 327. [Google Scholar]
- 41. Aramant RB, Seiler MJ. . Retinal transplantation—advantages of intact fetal sheets. . 2002; 21: 57– 73. [DOI] [PubMed] [Google Scholar]
- 42. Shirai H, Mandai M, Matsushita K,et al. . Transplantation of human embryonic stem cell-derived retinal tissue in two primate models of retinal degeneration. . 2016; 113: E81– E90. [DOI] [PMC free article] [PubMed] [Google Scholar]
- 43. Coffey PJ, Girman S, Wang SM,et al. . Long-term preservation of cortically dependent visual function in RCS rats by transplantation. . 2002; 5: 53– 56. [DOI] [PubMed] [Google Scholar]
- 44. Semo M, Haamedi N, Stevanato L,et al. . Efficacy and safety of human retinal progenitor cells. . 2016; 5 4: 6. [DOI] [PMC free article] [PubMed] [Google Scholar]
- 45. Ortin-Martinez A, Tsai EL, Nickerson PE,et al. . A reinterpretation of cell transplantation: GFP transfer from donor to host rhotoreceptors. . 2017; 35: 932– 939. [DOI] [PubMed] [Google Scholar]
- 46. Sanges D, Simonte G, Di Vicino U,et al. . Reprogramming Müller glia via in vivo cell fusion regenerates murine photoreceptors. . 2016; 126: 3104– 3116. [DOI] [PMC free article] [PubMed] [Google Scholar]
- 47. Eberle D, Kurth T, Santos-Ferreira T, Wilson J, Corbeil D, Ader M. . Outer segment formation of transplanted photoreceptor precursor cells. . 2012; 7: e46305. [DOI] [PMC free article] [PubMed] [Google Scholar]
- 48. Singh MS, Charbel Issa P, Butler R,et al. . Reversal of end-stage retinal degeneration and restoration of visual function by photoreceptor transplantation. . 2013; 110: 1101– 1106. [DOI] [PMC free article] [PubMed] [Google Scholar]
- 49. Eberle D, Schubert S, Postel K, Corbeil D, Ader M. . Increased integration of transplanted CD73-positive photoreceptor precursors into adult mouse retina. . 2011; 52: 6462– 6471. [DOI] [PubMed] [Google Scholar]
- 50. Zhu CL, Ji Y, Lee EJ, Grzywacz NM. . Spatiotemporal pattern of rod degeneration in the S334ter-line-3 rat model of retinitis pigmentosa. . 2013; 351: 29– 40. [DOI] [PubMed] [Google Scholar]
- 51. Pearson RA. . Advances in repairing the degenerate retina by rod photoreceptor transplantation. . 2014; 32: 485– 491. [DOI] [PMC free article] [PubMed] [Google Scholar]
- 52. Kaewkhaw R, Kaya KD, Brooks M,et al. . Transcriptome dynamics of developing photoreceptors in three-dimensional retina cultures recapitulates temporal sequence of human cone and rod differentiation revealing cell surface markers and gene networks. . 2015; 33: 3504– 3518. [DOI] [PMC free article] [PubMed] [Google Scholar]
- 53. Aramant RB, Seiler MJ. . Transplanted sheets of human retina and retinal pigment epithelium develop normally in nude rats. . 2002; 75: 115– 125. [DOI] [PubMed] [Google Scholar]
- 54. Seiler MJ, Aramant RB. . Intact sheets of fetal retina transplanted to restore damaged rat retinas. . 1998; 39: 2121– 2131. [PubMed] [Google Scholar]
- 55. Dick O, tom Dieck S, Altrock WD,et al. . The presynaptic active zone protein bassoon is essential for photoreceptor ribbon synapse formation in the retina. . 2003; 37: 775– 786. [DOI] [PubMed] [Google Scholar]
- 56. Seiler MJ, Rao B, Aramant RB,et al. . Three-dimensional optical coherence tomography imaging of retinal sheet implants in live rats. . 2010; 188: 250– 257. [DOI] [PMC free article] [PubMed] [Google Scholar]
- 57. Vecino E, Rodriguez FD, Ruzafa N, Pereiro X, Sharma SC. . Glia-neuron interactions in the mammalian retina. . 2016; 51: 1– 40. [DOI] [PubMed] [Google Scholar]
- 58. Taylor L, Arner K, Taylor IH, Ghosh F. . Feet on the ground: physical support of the inner retina is a strong determinant for cell survival and structural preservation in vitro. . 2014; 55: 2200– 2213. [DOI] [PubMed] [Google Scholar]
- 59. Saari JC, Bunt-Milam AH, Bredberg DL, Garwin GG. . Properties and immunocytochemical localization of three retinoid-binding proteins from bovine retina. . 1984; 24: 1595– 1603. [DOI] [PubMed] [Google Scholar]
- 60. Dizhoor AM, Ray S, Kumar S,et al. . Recoverin: a calcium sensitive activator of retinal rod guanylate cyclase. . 1991; 251: 915– 918. [DOI] [PubMed] [Google Scholar]
- 61. Molday RS, MacKenzie D. . Monoclonal antibodies to rhodopsin: characterization, cross-reactivity, and application as structural probes. . 1983; 22: 653– 660. [DOI] [PubMed] [Google Scholar]
- 62. Plantner JJ, Hara S, Kean EL. . Improved, rapid radioimmunoassay for rhodopsin. . 1982; 35: 543– 548. [DOI] [PubMed] [Google Scholar]
Associated Data
This section collects any data citations, data availability statements, or supplementary materials included in this article.


