

Abstract
Immune cells communicate by releasing large quantities of cytokines. Although the mechanisms of cytokine secretion are increasingly understood, quantitative knowledge of the number of cytokines per vesicle is still lacking. Here, we measured with quantitative microscopy the release rate of vesicles potentially carrying interleukin‐6 (IL‐6) in human dendritic cells. By comparing this to the total secreted IL‐6, we estimate that secretory vesicles contain about 0.5–3 IL‐6 molecules, but with a large spread among cells/donors. Moreover, IL‐6 did not accumulate within most cells, indicating that synthesis and not trafficking is the bottleneck for IL‐6 production. IL‐6 accumulated in the Golgi apparatus only in ~ 10% of the cells. Understanding how immune cells produce cytokines is important for designing new immunomodulatory drugs.
Keywords: dendritic cell, exocytosis, interleukin 6
Abbreviations
BrefA, Brefeldin A
ER, endoplasmic reticulum
IL‐6, interleukin 6
LPS, lipopolysaccharide
RE, recycling endosome
SNARE, soluble NSF attachment protein receptor
STED, stimulation emission depletion
TfR, transferrin receptor
TIRF, total internal reflection fluorescence
TNFα, tumor necrosis factor α
VAMP3, vesicle‐associated membrane protein 3
A general and important hallmark of the immune system is the remarkable plasticity of cytokine secretion by immune cells. Cellular activation, for instance, during infection or tissue damage, triggers the secretion of pro‐ or anti‐inflammatory cytokines to orders of magnitude higher than at resting conditions 1, 2. One of the most prominent examples is the secretion of the soluble cytokine interleukin 6 (IL‐6) within hours after stimulation of macrophages and dendritic cells by the bacterial cell membrane component lipopolysaccharide (LPS) 3, 4, 5. Here, LPS binds to the pattern recognition receptor Toll‐like receptor 4 on the plasma membrane of these immune cells and this triggers activation of NF‐κB and other transcription factors, which in turn result in the transcription and translation of IL‐6. As most cytokines, IL‐6 traffics from the endoplasmic reticulum (ER) to the recycling endosome (RE) through the Golgi apparatus 2, 6. REs are tubulovesicular organelles that regulate the trafficking of secretory vesicles to the plasma membrane 1, eventually resulting in the release of IL‐6 into the extracellular environment.
Of course, not only the biosynthetic transcription and translation machinery but also the secretory trafficking machinery must be capable of coping with the requirements for increased release of IL‐6 upon LPS activation. However, several pieces of evidence suggest that secretion (and not synthesis) might be limiting for cellular production of IL‐6. In the macrophage cell line RAW264.7, endogenous IL‐6 accumulates in the Golgi area within 1 h after LPS stimulation, indicating that the Golgi may act as a bottleneck limiting the secretion of newly synthesized IL‐6 6. In addition, several trafficking proteins involved in release of IL‐6 (and other cytokines) are upregulated together with IL‐6 1, such as syntaxin‐3 and vesicle‐associated membrane protein 3 (VAMP3), both soluble NSF attachment protein receptor (SNARE) proteins mediating IL‐6 secretion 6, 7, 8. Finally, the interactions of VAMP3 with syntaxin‐4 at the plasma membrane increase upon LPS activation of dendritic cells and this coincides with increased IL‐6 secretion 3. However, any quantitative data on the secretory pathway for IL‐6 or other cytokines are surprisingly lacking. In this study, we set out to fill this gap by means of quantitative microscopy. We quantified the number of IL‐6 molecules per secretory vesicle in human dendritic cells derived from blood. Surprisingly, we estimate that even under strong inflammatory conditions, potential secretory vesicles contained on average only ~ 3 IL‐6 molecules in case secretion only occurs at the ventral (glass‐adhered) membrane and 0.5 in case of completely nonpolarized secretion. However, this number varied widely among cells and donors. These low numbers suggest that the secretory pathway is not a major bottleneck for IL‐6 production, and this is supported by our finding that IL‐6 did not accumulate within the majority of dendritic cells. However, for a minor fraction of dendritic cells (~ 10%) we observed IL‐6 accumulation at the Golgi, suggesting that trafficking can be the bottleneck for some cells.
Materials and methods
Cells
Dendritic cells were derived from peripheral blood monocytes isolated from a buffy coat from healthy volunteers (informed consent obtained and according to national and institutional ethics guidelines) 9, as described 10. Cells were stimulated overnight with a final concentration of 1 μg·mL−1 LPS. Cells were transfected using the Neon Transfection system (Invitrogen, Waltham, MA, USA), as described 10. The plasmid coding for IL‐6‐GFP has been described 6 and was a gift from Jennifer Stow (Addgene, Cambridge, MA, USA Plasmid # 28088).
ELISA
Interleukin‐6 production was measured by using an ELISA kit (88‐7066‐88; eBioscience, Waltham, MA, USA) according to the manufacturer's instructions.
Immunofluorescence
Immunofluorescence labeling was performed as described 11. Primary antibodies used were mouse IgG1 anti‐CD9 clone M‐L13 (#555370; BD Biosciences, Franklin Lakes, NJ, USA), mouse ascites IgG1 against human transferrin receptor (TfR; clone b3/25; Santa Cruz Biotechnology, Dallas, TX, USA), and mouse IgG1 against GM130 (610822; BD Biosciences), all at a 1 : 100 dilution. Secondary antibodies were labeled with Alexa Fluor 647 (Life Technologies, Waltham, MA, USA) and used at a 1 : 400 dilution. F‐actin was stained with phalloidin conjugated to Alexa Fluor 647 (A22287; 1 : 400 dilution; Molecular probes, Waltham, MA, USA). For staining of endogenous IL‐6, cells were fixed with ice cold methanol for 20 min at −20 °C and blocked with 5% donkey serum in PBS. Cells were incubated overnight with mouse IgG2b against IL‐6 (sc‐130326; Santa Cruz) and rabbit IgG against VAMP3 (ab5789; Abcam, Cambridge, UK). After extensive washing, the cells were incubated with secondary antibodies conjugated to Alexa Fluor 647 (donkey‐anti‐mouse) and Alexa Fluor 488 (donkey‐anti‐rabbit). Cells were embedded in mounting medium containing 0.01% (v/v) 6‐hydroxy‐2,5,7,8‐tetramethylchroman‐2‐carboxylic acid (Trolox), 68% (v/v) glycerol, and 0.3 μg·mL−1 4′,6‐diamidino‐2‐phenylindole. The cells were imaged with a Leica SP8 confocal laser scanning microscope (Wetzlar, Germany) equipped with a 63 × 1.20 NA water immersion objective.
TIRF microscopy
Total internal reflection fluorescence (TIRF) was performed on an Olympus IX71 inverted microscope equipped with a 150 × 1.45 NA oil immersion objective and a CellTIRF illuminator (Olympus, Hamburg, Germany). Excitation light was provided with 100 mW 488 nm solid‐state laser (Olympus). Fluorescence emission was collected using an appropriate dichroic mirror (CMR‐U‐M4TIR‐SBX; Olympus) and emission band‐pass filter (FF01‐530/43‐25; Semrock, Rochester, NY, USA) with an EM‐CCD camera (C9100‐13; Hamamatsu, Hamamatsu City, Shizuoka, Japan). The sample was kept at 37 °C by a sample heater (Pecon, Erbach, Germany) and an objective heater (Tokai‐Hit, Fujinomiya‐shi, Shizuoka, Japan). Bursts were identified from time‐lapse movies of dendritic cells expressing IL‐6‐GFP I(x, y, t) by first calculating the time differences in fluorescence with (Eqn (1)):
| (1) |
By conventional blob detection on this time series ΔI(x, y, t), a list containing the coordinates and times of each fluorescence burst was then generated. We manually validated the efficiency of this semi‐automatic burst detection algorithm, and estimate that > 90% of bursts are correctly identified. To generate fluorescence intensity histograms of the bursts, we integrated peak intensities over the surface area of the detected bursts. Intensity histograms were fitted with Poisson distributions using OriginPro 2016 (OriginLab, Northampton, MA, USA).
STED microscopy
Dendritic cells were labeled with a PEGylated cholesterol analog labeled with a far‐red fluorophore 12, 13. Cells were resuspended in Live Cell Imaging Solution (Thermo Fisher, Waltham, MA, USA). 3D image stacks were recorded with a three‐dimensional super‐resolution stimulation emission depletion (STED) microscope with an isometric resolution of ~ 100 nm in all dimensions, as described 14, 15.
Flow cytometry
Dendritic cells were stained with rat IgG2a against human IL‐6 conjugated to phycoerythrin (clone MQ2‐6A3; Biolegend, San Diego, CA, USA) and with a fixable viability dye eFluor™ 780 (eBioscience, Waltham, MA, USA). Cells were measured on a MACSQuant (Miltenyi Biotec, Leiden, the Netherlands). Data were analyzed using flowjo software (Franklin Lakes, NJ, USA).
Statistical analysis
All data were analyzed using a paired two‐sided Student's t‐test (two conditions) or ANOVA with post hoc Bonferroni multiple comparison test (> 2 conditions). A value of P < 0.05 was considered statistically significant (*P < 0.05, **P < 0.01, ***P < 0.001).
Results
We first measured the secretion of IL‐6 from dendritic cells derived from monocytes isolated from blood of healthy volunteers. In resting conditions, these dendritic cells secreted on average about 0.05 fg·cell−1·h−1 of IL‐6 (Fig. 1). Given that the molecular weight of the main form of IL‐6 is 23.7 kDa 16, this equals about 1300 IL‐6 molecules·cell−1·h−1. We then stimulated the cells with LPS for 24 h. During this period, cells secrete more IL‐6 which accumulates in medium in an almost linear fashion for over 24 h 3. Overnight stimulation of the DCs with LPS increased the IL‐6 secretion on average roughly 40‐fold to ~ 46 000 molecules·cell−1·h−1 (Fig. 1). Thus, a resting dendritic cell on average releases an IL‐6 molecule approximately every 3 s. Upon LPS stimulation, this number increases to about 13 IL‐6 molecules per second.
Figure 1.
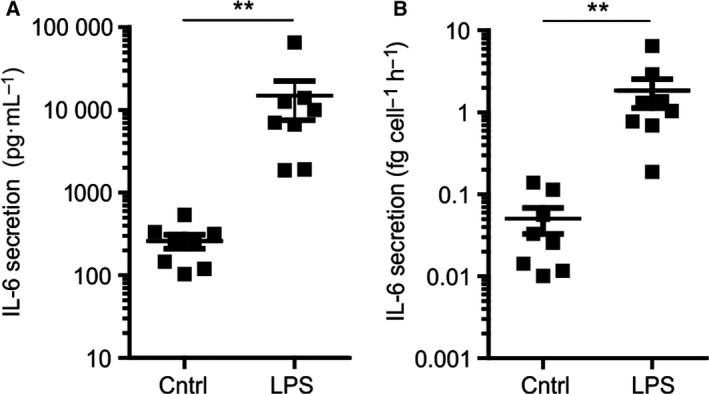
IL‐6 secretion by dendritic cells. (A) The total cellular secretion of IL‐6 by dendritic cells measured by ELISA with and without overnight stimulation with LPS. Data points: individual donors. (B) Same as panel A, but now divided through the total number of cells and the time to calculate the average IL‐6 secretion per cell per hour. Student's t‐test, **P < 0.01.
Next, we determined cellular heterogeneity in our dendritic cell populations by determining the number of cells that produced IL‐6. It is well established that even within one cell type, major differences in protein expression and cytokine secretion can be present 17, 18, 19. Therefore, we estimated the percentage of IL‐6 producing dendritic cells upon LPS stimulation by flow cytometry combined with immunolabeling of intracellular IL‐6. Only a minor population of ~ 10% of the dendritic cells showed intracellular pools of IL‐6, and this accumulation was low and only observable 4–6 h after LPS stimulation (Fig. 2A,B), indicating that most IL‐6 was secreted rapidly after synthesis. Based on immunofluorescence staining of endogenous IL‐6, IL‐6 accumulated at the Golgi region and (less) at REs (Fig. 2C), as reported previously 6. To prevent the secretion and accumulate all produced IL‐6 within the cells, we repeated the flow cytometry experiments in presence of Brefeldin A (BrefA) which prevents cytokine secretion by disrupting ER‐Golgi trafficking 20. This enabled us to estimate the percentage of cells within our population that is capable of IL‐6 secretion. BrefA treatment resulted in both a higher IL‐6 signal and a higher fraction of ~ 42% of all cells showing intracellular pools of IL‐6 (for 6 h LPS stimulation; Fig. 2). After 6 h, the intracellular accumulation decreased, possibly due to degradation. When we correct the average IL‐6 secretion rate for the fraction of IL‐6‐producing cells (~ 42% of the population; BrefA condition in Fig. 2B), we find that LPS‐stimulated cells on average secrete roughly 30 IL‐6 molecules per second. However, based on the spread of intensities of the IL‐6 signals in the flow cytometry experiments (Fig. 2A), the variation in IL‐6 production among the cell population is large and ranges for over an order of magnitude.
Figure 2.
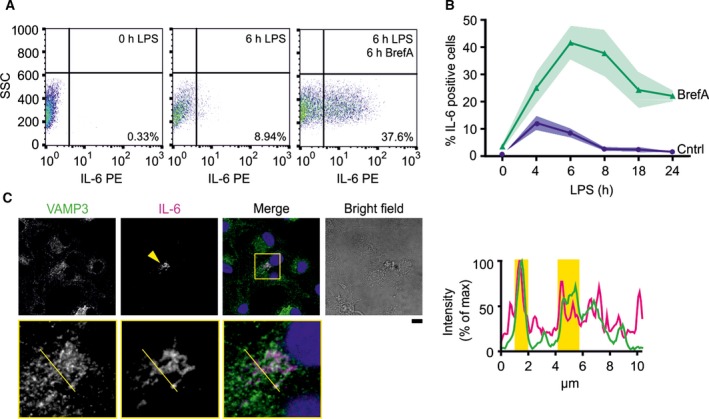
IL‐6 production by dendritic cells is heterogeneous. (A) Representative flow cytometry plots showing the distribution of intracellular IL‐6 in unstimulated cells or cells stimulated with LPS for 6 h with or without BrefA. SSC, side scatter. (B) Quantification of the percentage of IL‐6‐positive cells from panel A following LPS stimulation over time in presence (green) or absence (blue) of BrefA. Shown is mean ± SEM (≥ 3 donors). (C) Confocal images of LPS‐activated dendritic cells immunostained for the SNARE VAMP3 (green in merge) and IL‐6 (magenta). Arrowhead: cell positive for IL‐6. Yellow regions in intensity distributions: overlap of VAMP3 and IL‐6 intensities. Scale bar, 10 μm.
To obtain a rough estimate of the number of IL‐6 molecules per secretory vesicle, we estimated the rate of exocytotic events from dendritic cells. For this, we overexpressed IL‐6 C‐terminally fused to GFP (IL‐6‐GFP) from the strong cytomegalovirus promotor. This construct was used previously to study intracellular trafficking of IL‐6 in RAW264.7 macrophages 6. As reported in this study, and similar to endogenous IL‐6 (Fig. 2C), we observed accumulation of IL6‐GFP in the Golgi apparatus and REs of dendritic cells (Fig. 3). Exocytosis of vesicles containing IL‐6‐GFP was then measured by TIRF microscopy. As GFP is quenched in the acidic environment of exocytotic vesicles 21, exocytosis of IL‐6 results in a sudden ‘burst’ of fluorescence. This burst rapidly decreases in intensity as IL‐6‐GFP diffuses away and/or gets photobleached (Fig. 4A,B; Video S1). As TIRF microscopy is capable of imaging relatively thin optical sections at the surface of the coverslip (i.e., at the ventral (lower) plasma membrane) without interference from cytosolic fluorescence, it allows to record time‐lapse movies of exocytosis events, which are apparent from fluorescence bursts and this is a widely used technique to study exocytosis (reviewed in 22). Unstimulated dendritic cells displayed on average ~ 0.0013 bursts·s−1·μm−2 of IL‐6‐GFP (Fig. 4C). This rate increased on average about twofold to ~ 0.0027 bursts·s−1·μm−2 upon overnight stimulation with LPS, likely due to the increased expression of trafficking proteins 6, 8 and the rerouting of intracellular trafficking 3. These are coarse estimates, with a 10‐fold variation among cells (Fig. 4C). Moreover, the intensity distributions fitted reasonably well with a Poisson distribution with the lowest intensity peak in the histogram corresponding to a single IL‐6‐GFP molecule (Fig. 4D). Extrapolating the fit to zero fluorescence intensity allowed to estimate the fraction of vesicles not containing the IL‐6‐GFP reporter. From this fitting, we estimate that secretory vesicles contained on average about 0.7 ± 0.2 IL‐6‐GFP molecules, and that ~ 49% of the vesicles did not contain an IL‐6‐GFP molecule (Fig. 4D). Thus, this suggests that we did not detect about half of the exocytic events because these vesicles did not contain IL‐6‐GFP. Lastly, we cannot exclude that IL‐6‐GFP overexpression could overwhelm the normal secretion mechanism leading to deviations in the burst rates, although we did not observe a correlation between burst rates and expression levels of IL‐6‐GFP.
Figure 3.
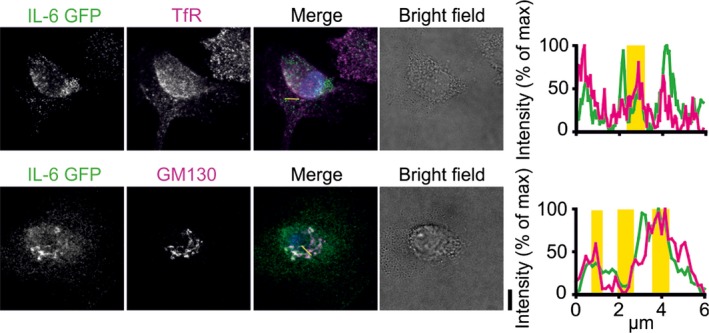
Overexpressed IL‐6‐GFP accumulates in Golgi and REs. Confocal images of dendritic cell transfected with IL‐6 fused to GFP (IL‐6‐GFP; green in merge) and immunostained for the Golgi marker GM130 or the recycling endosomal marker TfR (magenta). Yellow regions in intensity distributions: overlap of IL‐6 GFP and GM130 or TfR intensities. Scale bar, 10 μm.
Figure 4.
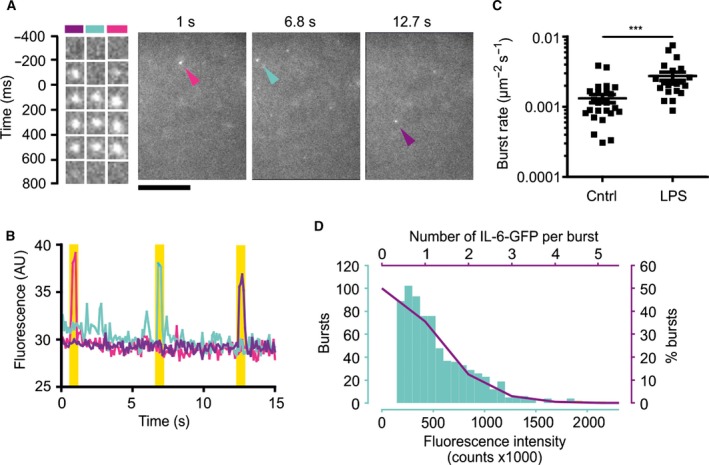
Vesicle release rate at the ventral membrane of dendritic cells. (A) Stills from time‐lapse TIRF microscopy of dendritic cell overexpressing IL‐6‐GFP. Details of three exocytosis events indicated by the arrowheads are shown. Color of the arrowheads is matched with kymographs. Kymographs are aligned to the maximum intensities of the bursts (t = 0). Scale bar, 10 μm. See also Video S1. (B) Quantification of the fluorescence signals shown in panel A over time. Yellow shaded areas: occurrence of exocytotic events. (C) IL‐6‐GFP burst rates per μm2 of imaged ventral cell surface area per second of IL‐6 GFP exocytosis. Data points show individual cells combined from three donors. (D) Blue: fluorescence intensity distribution of IL‐6‐GFP bursts for a representative donor. Purple solid line: fit with Poisson distribution with an average of 0.7 IL‐6‐GFP molecules per burst. The fit was extrapolated to zero fluorescence intensity to quantify the fraction of vesicles not containing the IL‐6‐GFP reporter (~ 49%).
Because of the limited imaging depth of TIRF microscopy, we could only measure exocytic events at the ventral membrane and not at the dorsal membrane. We recently showed that a post‐fusion complex of the SNARE VAMP3 (responsible for IL‐6 release 3, 6, 23) is present at the dorsal membrane of dendritic cells, suggesting that exocytosis does take place at this side 3. This is in line with findings in macrophages where no evidence was found for polarized secretion of IL‐6, whereas tumor necrosis factor α (TNFα) was secreted predominantly at the phagocytic cup 6. Moreover, secretion measured with TIRF microscopy is representative of the total exocytosis in adrenal chromaffin cells, and exocytosis does not differ between the ventral and dorsal membranes 24. Nevertheless, it could be possible that IL‐6 secretion in dendritic cells is (partly) polarized and has a preference for the ventral or dorsal membrane. To account for this, we determined different scenarios of fully polarized and nonpolarized secretion in our calculations and first determined the average apparent surface areas of the ventral and dorsal plasma membranes by confocal imaging. Here, we immunolabeled dendritic cells for the membrane marker CD9 (Fig 5A,B) 25, 26, 27. We then estimated the apparent total surface areas from three‐dimensional confocal z‐stacks of dendritic cells by the method of the spatial grid 28, 29. With this method, the surface area is approximated from the number of intersection points of the cell surface with a grid of virtual probes. Here, we took advantage of the convex shape of dendritic cells which means that each virtual probe only passes through the cell a single time (i.e., no internal angles > 180°). Because each probe only intersects the cell surface twice, we can estimate the apparent total surface area A app from the projected surface areas in three dimensions A XY, A ZX, and A ZY (Fig. 5C) with (Eqn (2)):
Figure 5.
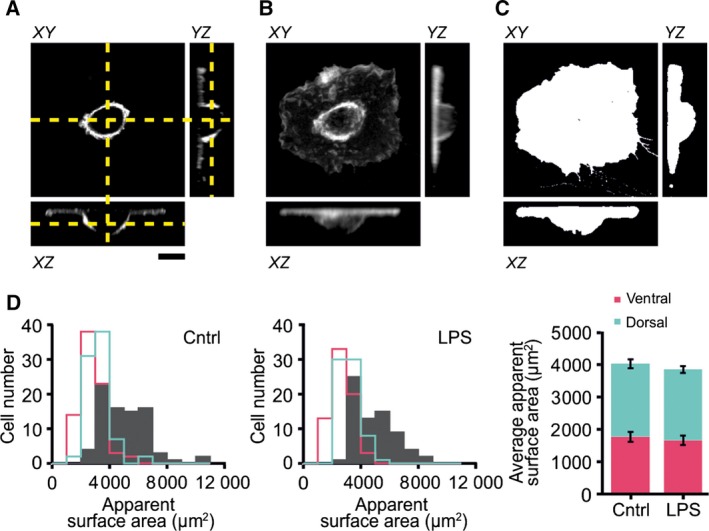
Apparent imaged surface areas of dendritic cells. (A) Confocal z‐stack of a dendritic cell adhered to a cover slip and immunolabeled for the membrane marker CD9. The yellow dashed lines indicate the positions of the monograph (XY) relative to the orthogonal projections (XZ and YZ). (B) Average intensity z‐projections from the cell in panel A. (C) Projected surface areas from the cell shown in panel A. Scale bar, 10 μm. The apparent imaged surface area from the cell in panels A–C was 2744 μm2. (D) Frequency distributions of the total (gray filled), ventral (pink), and dorsal (blue) apparent surface areas of all measured cells for the control and LPS‐stimulated conditions (combined for three donors). Bar graphs: average apparent membrane surface areas (± SEM).
| (2) |
Note that A xy is equal to the ventral (glass‐adherent) membrane surface area, and the dorsal membrane surface area can be calculated from the difference between A app and A xy. Unstimulated cells had an average total apparent surface area of approximately A app = ~ 4035 ± 277 μm2 [dorsal membrane: 2260 ± 135 μm2; ventral membrane: 1775 ± 155 μm2 (± SEM from three different donors)] and this area did not change upon stimulation with LPS (A app = 3858 ± 181 μm2; dorsal membrane: 2185 ± 110 μm2; ventral membrane: 1673 ± 143 μm2; Fig. 5D). We obtained similar results with fluorescently labeled phalloidin which stains the (cortical) actin cytoskeleton (Fig. S1A–E). Note that these values indicate the apparent surface areas as estimated from confocal microscopy, and these values will be substantially lower than the total surface area, because membrane ruffling is not accounted for. Due to the limited (i.e., diffraction‐limited) resolution of confocal microscopy, membrane curvature arising from ruffling cannot be properly resolved and this leads to an underestimation of the total membrane surface area.
To correct for this membrane ruffling, we recorded three‐dimensional super‐resolution STED microscopy image stacks of dendritic cells labeled with a fluorescent cholesterol analog 12, 13, 14, 15 (Fig. 6A). The extent of membrane ruffling was estimated from these image stacks by tracing the ventral and dorsal membranes in multiple cross‐sections (Fig. 6B). Correction factors for membrane ruffling were then calculated as the square of the ratio of the lengths of the traces from STED over the smooth plane curves from confocal microscopy (Fig. 6C). The dorsal membranes were strongly ruffled, leading to an ~ 3.6‐fold underestimation of the surface area by diffraction‐limited confocal microscopy. In contrast, the ventral membrane was only somewhat ruffled and the surface area was only underestimated by 7%. This means that the corrected average area of membrane surface of a glass‐adherent unstimulated dendritic cell is ~ 8136 μm2 for the dorsal and 1899 μm2 for the ventral membrane (Fig. 6D). For LPS‐stimulated dendritic cells, the surface areas are 7866 μm2 for the dorsal and 1789 μm2 for the ventral membrane (Fig. 6D).
Figure 6.
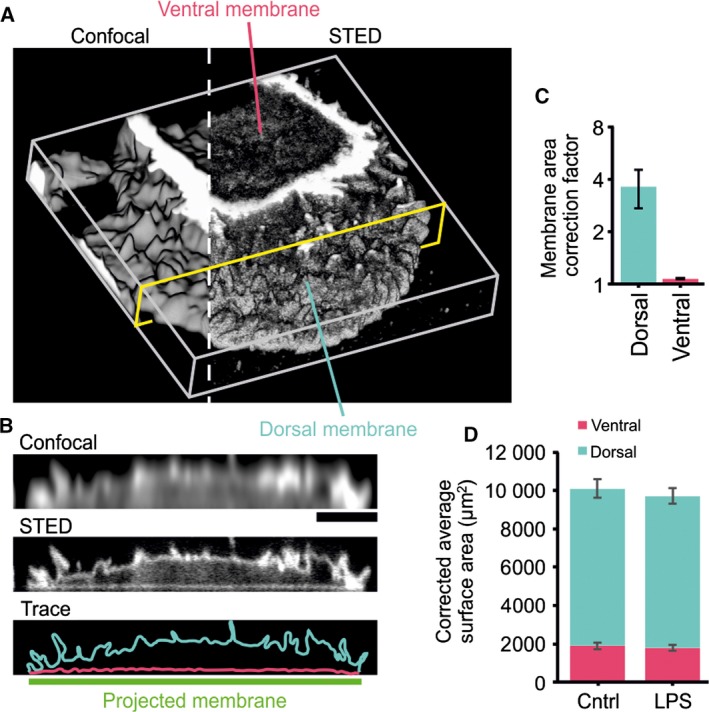
Quantification of membrane ruffling by super‐resolution microscopy. (A) Representative surface projection of a live dendritic cell labeled with a fluorescent cholesterol analog and imaged by three‐dimensional STED microscopy. Note the increased resolution of STED compared to diffraction‐limited confocal imaging. (B) Orthogonal section as indicated in yellow in panel A and traces of the dorsal and ventral membranes. Scale bar, 5 μm. (C) Correction factor to account for ruffling in the apparent membrane areas, calculated as the square of the ratios between membrane traces from STED over the smooth plane curves from confocal microscopy. (D) Average membrane areas from Fig. 5D, but now corrected for membrane ruffling.
By multiplying the burst rates per imaged surface area from the TIRF microscopy with the total surface areas from the confocal z‐stacks, we were able to obtain a rough estimate of the average burst rate per cell per second. In case of 100% polarized secretion only at the ventral membrane, the average burst rate increased from ~ 2.5 to 4.8 bursts·cell−1·s−1 upon LPS stimulation (Fig. 7A; burst rate × corrected ventral membrane surface area). In case exocytosis also occurs at the dorsal site and is completely nonpolar, the burst rates would be higher and increase from 13 to 26 bursts·cell−1 s−1 upon LPS stimulation (burst rate × corrected total membrane surface area). As we estimated (Fig 1; by ELISA) that unstimulated dendritic cells on average secrete roughly one IL‐6 molecule per 3 s, this means that on average only about 1 in 7.5 (for 100% ventral release) or 39 (nonpolar release) secretory vesicles contains an IL‐6 molecule (Fig. 7B). For LPS‐stimulated dendritic cells that secrete 13 IL‐6 molecules per second, average vesicles contain on average roughly 0.5 (for nonpolar release; half of the vesicles empty) to 3 (100% ventral) IL‐6 molecules. However, it should be considered that this is a coarse and average estimate, and because of the large variation in IL‐6 production, burst rates, and cell surface areas, this number is expected to vary substantially among cells and vesicles.
Figure 7.
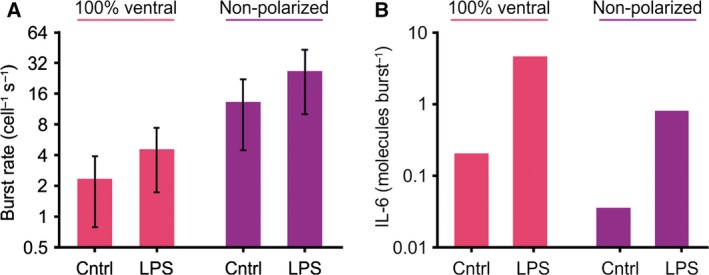
Quantitative estimation of the number of IL‐6 molecules per exocytotic event. (A) Burst rates per cell per second of IL‐6‐GFP corrected for the average total surface area of the cells assuming (left; pink) 100% secretion at the ventral membrane and (right; purple) completely nonpolarized secretion (average ± SD). (B) Estimates of the average number of IL‐6 molecules secreted per exocytotic event for 100% ventral or completely nonpolarized secretion. No error bars are shown because of the large variation in IL‐6 production, burst rates, and cell surface areas among cells, donors, and vesicles that cannot be accounted for (see main text).
Discussion
In this study, we estimated the number of IL‐6 molecules released per secretory vesicle from dendritic cells derived from human blood. We estimated that each secretory vesicle of an LPS‐stimulated monocyte‐derived dendritic cell contains on average between about ~ 0.5 and 3 molecules of IL‐6. The lower estimate is assuming completely nonpolarized secretion, as suggested by a macrophage study where there was no evidence found for polarized secretion of IL‐6 in macrophages, whereas TNFα was predominantly secreted at the nascent cup of phagosomes 6. The higher estimate is for the case that IL‐6 is exclusively released at the ventral membrane, which we consider unlikely given that we recently showed 3 the presence of VAMP3 in postfusion cis‐SNARE complexes (i.e., the SNARE for IL‐6 release 3, 6, 23) at the dorsal membrane. In the case where release of IL‐6 would be higher at the dorsal than the ventral membranes, we underestimate the rate of exocytic events and the average number of IL‐6 molecules per vesicle will be even lower.
Of course, our estimates are based on a large number of assumptions. Most importantly, we assumed that we labeled every secretory vesicle that potentially can release IL‐6 by overexpression of IL‐6‐GFP. Fitting the fluorescence intensity distributions of the GFP bursts with Poisson distribution indicated that this might not be the case, and that we miss about half of the exocytosis events because the vesicle does not carry an IL‐6‐GFP reporter protein. Because of this, the fraction of vesicles containing IL‐6 might be overestimated ~ 2‐fold accordingly. If, on the other hand, the overexpression of IL‐6‐GFP or the GFP‐tag distorts the intracellular trafficking somehow, this might lead to an under‐ or overestimation of the number of vesicles. Moreover, the large spread among cells in IL‐6 production, surface area, and burst rate may lead to large deviations in the number of IL‐6 molecules per vesicle. Thus, we fully acknowledge that our estimate can be substantially improved in future studies and it should only be regarded as a coarse approximation of the number of IL‐6 molecules per secretory vesicle.
Nevertheless, this is the first quantitative estimate of the number of molecules of a cytokine in a secretory vesicle and we believe it at least provides an order of magnitude of on average 0.1–10 molecules of IL‐6 per vesicle. This number is surprisingly low, compared to, for instance, the 1790 glutamate molecules present on average in a neurotransmitter vesicle from neurons 30 and the about 500 000 insulin molecules per vesicle from pancreatic beta cells 31, 32. Our results show that as IL‐6 does not accumulate in most cells (Fig. 2B), the exocytotic machinery is not the limiting factor for release of IL‐6, and this can assure the rapid secretion of IL‐6 following cellular activation. The low average number of IL‐6 molecules per vesicle, combined with the finding that IL‐6 does not accumulate in most cells, demonstrates that transcription and translation, and not the subsequent trafficking, are the bottleneck for IL‐6 secretion for the majority of cells. However, for the remaining minority of cells (~ 10%), IL‐6 accumulates in the Golgi showing that trafficking is the bottleneck. A quantitative understanding of cytokine production and release is essential for our understanding of immune function, and may aid in the design of new immunostimulatory or inhibitory drugs.
Author contributions
DRJV: Conceptualization, Data curation, Formal analysis, Validation, Investigation, Visualization, Methodology, Writing—original draft, Writing—review and editing. MtB: Resources, Data curation, Investigation, Writing—review and editing. AH: Resources, Data curation (STED microscopy). GvdB: Conceptualization, Software, Supervision, Funding acquisition, Methodology, Writing—original draft, Project administration, Writing—review and editing.
Supporting information
Fig. S1. Apparent surface area of dendritic cells by phalloidin staining.
Video S1. Representative time‐lapse movie of TIRF microscopy of dendritic cell expressing IL‐6‐GFP.
Acknowledgements
GvdB is the recipient of a Starting Grant from the European Research Council (ERC) under the European Union's Seventh Framework Programme (Grant Agreement Number 336479), a Career Development Award from the Human Frontier Science Program, and a grant from the Netherlands Organization for Scientific Research (NWO‐ALW VIDI 864.14.001). This work was supported by the NWO Gravitation Programme 2013 (ICI‐024.002.009).
Edited by Michael Bubb
References
- 1. Stanley AC and Lacy P (2010) Pathways for cytokine secretion. Physiology (Bethesda) 25, 218–229. [DOI] [PubMed] [Google Scholar]
- 2. Murray RZ and Stow JL (2014) Cytokine secretion in macrophages: SNAREs, Rabs, and membrane trafficking. Front Immunol 5, 538. [DOI] [PMC free article] [PubMed] [Google Scholar]
- 3. Verboogen DRJ, Mancha NG, ter Beest M and van den Bogaart G (2017) Fluorescence lifetime imaging microscopy reveals rerouting of SNARE trafficking driving dendritic cell activation. Elife 6, 1–17. [DOI] [PMC free article] [PubMed] [Google Scholar]
- 4. Kumolosasi E, Salim E, Jantan I and Ahmad W (2014) Kinetics of intracellular, extracellular and production of pro‐inflammatory cytokines in lipopolysaccharide‐ stimulated human peripheral blood mononuclear cells. Trop J Pharm Res 13, 536. [DOI] [PubMed] [Google Scholar]
- 5. Kawai T and Akira S (2005) Pathogen recognition with Toll‐like receptors. Curr Opin Immunol 17, 338–344. [DOI] [PubMed] [Google Scholar]
- 6. Manderson AP, Kay JG, Hammond LA, Brown DL and Stow JL (2007) Subcompartments of the macrophage recycling endosome direct the differential secretion of IL‐6 and TNFα J Cell Biol 178, 57–69. [DOI] [PMC free article] [PubMed] [Google Scholar]
- 7. Murray RZ, Kay JG, Sangermani DG and Stow JL (2005) A role for the phagosome in cytokine secretion. Science 310, 1492–1495. [DOI] [PubMed] [Google Scholar]
- 8. Collins LE, DeCourcey J, Rochfort KD, Kristek M and Loscher CE (2015) A role for syntaxin 3 in the secretion of IL‐6 from dendritic cells following activation of toll‐like receptors. Front Immunol 6, 1–9. [DOI] [PMC free article] [PubMed] [Google Scholar]
- 9. de Vries IJM, Eggert AAO, Scharenborg NM, Vissers JLM, Lesterhuis WJ, Boerman OC, Punt CJA, Adema GJ and Figdor CG (2002) Phenotypical and functional characterization of clinical grade dendritic cells. J Immunother 25, 429–438. [DOI] [PubMed] [Google Scholar]
- 10. Baranov MV, Ter Beest M, Reinieren‐Beeren I, Cambi A, Figdor CG and van den Bogaart G (2014) Podosomes of dendritic cells facilitate antigen sampling. J Cell Sci 127, 1052–1064. [DOI] [PMC free article] [PubMed] [Google Scholar]
- 11. Dingjan I, Verboogen DR, Paardekooper LM, Revelo NH, Sittig SP, Visser LJ, von Mollard GF, Henriet SS, Figdor CG, Ter Beest M et al (2016) Lipid peroxidation causes endosomal antigen release for cross‐presentation. Sci Rep 6, 22064. [DOI] [PMC free article] [PubMed] [Google Scholar]
- 12. Zuidscherwoude M, Dunlock V‐ME, van den Bogaart G, van Deventer SJ, van der Schaaf A, van Oostrum J, Goedhart J, In‘t Hout J, Hämmerling GJ, Tanaka S et al (2017) Tetraspanin microdomains control localized protein kinase C signaling in B cells. Sci Signal 10, eaag2755. [DOI] [PubMed] [Google Scholar]
- 13. Honigmann A, Mueller V, Ta H, Schoenle A, Sezgin E, Hell SW and Eggeling C (2014) Scanning STED‐FCS reveals spatiotemporal heterogeneity of lipid interaction in the plasma membrane of living cells. Nat Commun 5, 5412. [DOI] [PubMed] [Google Scholar]
- 14. Baranov MV, Revelo NH, Dingjan I, Maraspini R, Ter Beest M, Honigmann A and van den Bogaart G (2016) SWAP70 organizes the actin cytoskeleton and is essential for phagocytosis. Cell Rep 17, 1518–1531. [DOI] [PMC free article] [PubMed] [Google Scholar]
- 15. Harke B, Ullal CK, Keller J and Hell SW (2008) Three‐dimensional nanoscopy of colloidal crystals. Nano Lett 8, 1309–1313. [DOI] [PubMed] [Google Scholar]
- 16. Gross V, Andus T, Castell J, Vom Berg D, Heinrich PC and Gerok W (1989) O‐ and N‐glycosylation lead to different molecular mass forms of human monocyte interleukin‐6. FEBS Lett 247, 323–326. [DOI] [PubMed] [Google Scholar]
- 17. Feinerman O, Jentsch G, Tkach KE, Coward JW, Hathorn MM, Sneddon MW, Emonet T, Smith KA and Altan‐Bonnet G (2010) Single‐cell quantification of IL‐2 response by effector and regulatory T cells reveals critical plasticity in immune response. Mol Syst Biol 6, 437. [DOI] [PMC free article] [PubMed] [Google Scholar]
- 18. Shalek AK, Satija R, Adiconis X, Gertner RS, Gaublomme JT, Raychowdhury R, Schwartz S, Yosef N, Malboeuf C, Lu D et al (2013) Single‐cell transcriptomics reveals bimodality in expression and splicing in immune cells. Nature 498, 236–240. [DOI] [PMC free article] [PubMed] [Google Scholar]
- 19. Satija R and Shalek AK (2014) Heterogeneity in immune responses: from populations to single cells. Trends Immunol 35, 219–229. [DOI] [PMC free article] [PubMed] [Google Scholar]
- 20. Bueno C, Almeida J, Alguero MC, Sánchez ML, Vaquero JM, Laso FJ, San Miguel JF, Escribano L and Orfao A (2001) Flow cytometric analysis of cytokine production by normal human peripheral blood dendritic cells and monocytes: comparative analysis of different stimuli, secretion‐blocking agents and incubation periods. Cytometry 46, 33–40. [PubMed] [Google Scholar]
- 21. Miesenböck G, De Angelis DA and Rothman JE (1998) Visualizing secretion and synaptic transmission with pH‐sensitive green fluorescent proteins. Nature 394, 192–195. [DOI] [PubMed] [Google Scholar]
- 22. Burchfield JG, Lopez JA, Mele K, Vallotton P and Hughes WE (2010) Exocytotic vesicle behaviour assessed by total internal reflection fluorescence microscopy. Traffic 11, 429–439. [DOI] [PubMed] [Google Scholar]
- 23. Boddul SV, Meng J, Dolly JO and Wang J (2014) SNAP‐23 and VAMP‐3 contribute to the release of IL‐6 and TNFα from a human synovial sarcoma cell line. FEBS J 281, 750–765. [DOI] [PubMed] [Google Scholar]
- 24. Becherer U, Pasche M, Nofal S, Hof D, Matti U and Rettig J (2007) Quantifying exocytosis by combination of membrane capacitance measurements and total internal reflection fluorescence microscopy in chromaffin cells. PLoS ONE 2, e505. [DOI] [PMC free article] [PubMed] [Google Scholar]
- 25. Boucheix C, Benoit P, Frachet P, Billard M, Worthington RE, Gagnon J and Uzan G (1991) Molecular cloning of the CD9 antigen. A new family of cell surface proteins. J Biol Chem 266, 117–122. [PubMed] [Google Scholar]
- 26. Rocha‐Perugini V, González‐Granado JM, Tejera E, López‐Martín S, Yañez‐Mó M and Sánchez‐Madrid F (2014) Tetraspanins CD9 and CD151 at the immune synapse support T‐cell integrin signaling. Eur J Immunol 44, 1967–1975. [DOI] [PMC free article] [PubMed] [Google Scholar]
- 27. Reyes R, Monjas A, Yánez‐Mó M, Cardeñes B, Morlino G, Gilsanz A, Machado‐Pineda Y, Lafuente E, Monk P, Sánchez‐Madrid F et al (2015) Different states of integrin LFA‐1 aggregation are controlled through its association with tetraspanin CD9. Biochim Biophys Acta 1853, 2464–2480. [DOI] [PubMed] [Google Scholar]
- 28. Kubínová L and Janácek J (1998) Estimating surface area by the isotropic fakir method from thick slices cut in an arbitrary direction. J Microsc 191, 201–211. [DOI] [PubMed] [Google Scholar]
- 29. Howard CV and Sandau K (1992) Measuring the surface area of a cell by the method of the spatial grid with a CSLM‐a demonstration. J Microsc 165, 183–188. [DOI] [PubMed] [Google Scholar]
- 30. Takamori S, Holt M, Stenius K, Lemke EA, Grønborg M, Riedel D, Urlaub H, Schenck S, Brügger B, Ringler P et al (2006) Molecular anatomy of a trafficking organelle. Cell 127, 831–846. [DOI] [PubMed] [Google Scholar]
- 31. Michael DJ, Xiong W, Geng X, Drain P and Chow RH (2007) Human insulin vesicle dynamics during pulsatile secretion. Diabetes 56, 1277–1288. [DOI] [PubMed] [Google Scholar]
- 32. Huang L, Shen H, Atkinson MA and Kennedy RT (1995) Detection of exocytosis at individual pancreatic beta cells by amperometry at a chemically modified microelectrode. Proc Natl Acad Sci USA 92, 9608–9612. [DOI] [PMC free article] [PubMed] [Google Scholar]
Associated Data
This section collects any data citations, data availability statements, or supplementary materials included in this article.
Supplementary Materials
Fig. S1. Apparent surface area of dendritic cells by phalloidin staining.
Video S1. Representative time‐lapse movie of TIRF microscopy of dendritic cell expressing IL‐6‐GFP.