Abstract
Silver staining, which exploits the special bioaffinity and the chromogenic reduction of silver ions, is an indispensable visualization method in biology. It is a most popular method for in‐gel protein detection. However, it is limited by run‐to‐run variability, background staining, inability for protein quantification, and limited compatibility with mass spectroscopic (MS) analysis; limitations that are largely attributed to the tricky chromogenic visualization. Herein, we reported a novel water‐soluble fluorogenic Ag+ probe, the sensing mechanism of which is based on an aggregation‐induced emission (AIE) process driven by tetrazolate‐Ag+ interactions. The fluorogenic sensing can substitute the chromogenic reaction, leading to a new fluorescence silver staining method. This new staining method offers sensitive detection of total proteins in polyacrylamide gels with a broad linear dynamic range and robust operations that rival the silver nitrate stain and the best fluorescent stains.
Keywords: aggregation-induced emission, metal-ion sensor, protein detection, silver staining, tetrazolate-silver assembly
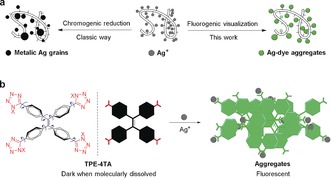
It has long been known that a number of biological structures are argyrophilic (silver loving). The use of silver stains for biological applications dates back to the 1800s. Largely using the silver‐based Golgi's method, Camillo Golgi and Santiago Cajal were able to elucidate many aspects of the nervous system and for this contribution they received the 1906 Nobel Prize in Physiology or Medicine.1 Silver staining is now an indispensable visualization method in biology and has established wide applications in histological characterization,2 diagnostic microbiology,3 karyotype analysis, and4 genomic5 and proteomic6 research. When used for the detection of proteins after electrophoresis, silver staining can detect a wide range of proteins and provides about 10–100‐fold higher sensitivity than the classic Coomassie Brilliant Blue stain. Its working principle is general. Silver ions bind to biological targets through interactions with carboxyl, amine, thiol, and other electron‐rich chemical groups.7 The detection is then achieved by reducing the silver ions into metallic silver grains, which collectively label the sample with a dark color (Figure 1 a). Since the reduction varies at the site of proteins and has no clear end points, the silver grains formed usually have a broad range of sizes, leading to varied colors in the stained proteins. As a result, the colorimetric silver stains show poor linear relationship for protein quantification. Because of the tricky reduction, silver staining is also subject to run‐to‐run variations and restricted to timing procedures for a good quality control.8 To achieve the highest sensitivity in silver stains, glutaraldehyde is frequently used in an additional sensitization step to saturate silver species on proteins; however, the glutaraldehyde cross‐links proteins covalently, leading to challenges in downstream mass spectroscopic (MS) analysis.6a Omission of the glutaraldehyde enhances MS compatibility of silver stains while drastically decreasing their detection performance. This dilemma is ultimately attributed to the chromogenic visualization in conventional silver stains.
Figure 1.

a) The classic chrome‐silver visualization (left) and proposed fluorogenic visualization (right) of proteins. b) TPE‐4TA and the Ag+ detection through a Ag+‐tetrazolate aggregation‐triggered AIE process. X can be either H or Na+. The possible tautomer 2X‐tetrazole structure (in red) is not shown for clarity.
We envisioned that a fluorogenic visualization of silver ions, as an alternative to the chromogenic step (Figure 1 a), may relieve the above‐mentioned concerns from the reduction step and rejuvenate the traditional silver staining method. Considering that fluorescent detection is fast and much more sensitive than absorption‐based method, the strategy is furthermore plausible for developing a new staining method with exceptional sensitivity. Though straightforward, no fluorescent silver stains have been reported so far. The challenge might be that this method relies on a Ag+‐specific dye that can be finely tailed for staining in complex environments (for example, in a gel). Considering the in situ grain formation in silver stains, the dye is preferably able to settle spontaneously upon Ag+ recognition in the gel, lighting up the target with a high signal to noise ratio.
Inspired by the phenomenon of aggregation‐induced emission (AIE),9 the desired fluorogenic Ag+ detection accompanied by an aggregation process can be rationally achieved. Unlike conventional dyes, a typical AIE dye has a flexible structure and emits faintly as molecules in solution. In the aggregated state, the dye emits strongly. The fluorescence in response to changes in molecular states has been explored as a general way to design fluorogenic probes for metal ions, small molecules, and enzymes.10 In this work, we designed a tetrazole‐tagged AIE luminogen, TPE‐4TA, for the fluorescent sensing of Ag+. Many 1/2H‐tetrazole compounds have been known to “precipitate” out Ag+ from a solution efficiently.11 The resulting insoluble tetrazole‐silver complexes are infinite metal‐coordination polymers, with silver atoms binding in mono‐, bi‐, or tri‐dentate formats to the N atoms of the tetrazole ring.11 For TPE‐4TA, the anion tetrazolate acts as Ag+‐specific targeting group to trigger aggregation, while the core tetraphenylethene (TPE) endows aggregation‐induced fluorescence (Figure 1 b).
TPA‐4TA (X=H) was synthesized in a 21 % total yield over three steps (Supporting Information, Figure S1). TPA‐4TA (X=H) showed modest solubility (ca. 10−4 m) in deionized water and was highly soluble (>0.05 m) in water when formulated in the salt form (X=Na+).
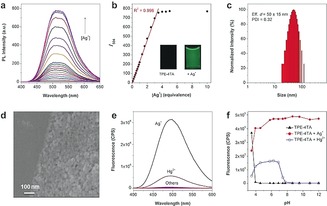
When not aggregated in aqueous solution, TPE‐4TA is non‐fluorescent because of the free rotational motion of the phenyl rings, which activates non‐radioactive pathways.9 As expected, the addition of Ag+ produced fluorescence with maximum intensity at 490–530 nm by 368 nm excitation. The turn‐on response was instantaneous. A stoichiometric study indicated that the fluorescence increased by the step‐wise addition of Ag+ (Figure 2 a). By plotting the intensity at 504 nm against the [Ag+]/[TPE‐4TA] ratio, a linear relationship with R2=0.996 was established in the range from 40 nm to 15 μm for [Ag+] (Figure 2 b). With a further increase of [Ag+], the fluorescence reached a steady plateau. The linearity and the 1:1 mole ratio of Ag+ to the tetrazolate group on approaching the plateau indicated that the sensing process correlated well with a stoichiometric metal‐organic coordination‐driven assembly.12 The limit of detection for Ag+ was estimated to be 2.3 nm, that is, 0.25 μg L−1 (S/N=3, n=12), which is about 40‐fold lower than the colorimetric method using dithizone (10 μg L−1) and is amongst that of the best fluorescence‐based methods.13
Figure 2.

Characterization of the fluorogenic aggregation process. a) Fluorescence of TPE‐4TA (5 μm) by stepwise addition of Ag+ in deionized water; b) Plot of intensity at 504 nm in (a) as a function of [Ag+]/[TPE‐4TA]. c) DLS and d) SEM characterization of the fluorescent solution. e) Fluorescence of TPE‐4TA (5 μm) mixed with metal ions (20 μm, including Na+, K+, Ca2+, Mg2+, Mn2+, Zn2+, Cu2+, Fe2+ Fe3+, Ni2+, Au+, Pb2+, Cd2+, Pd2+, and Co2+) in phosphate aqueous solution (pH 7.4). f) Fluorescence of TPE‐4TA (10 μm) at 504 nm against the pH values of the phosphate aqueous solution in the absence or presence of Ag+ or Hg2+ (10 equiv) respectively. λex=368 nm.
The fluorogenic sensing was accompanied by formation of nano‐sized aggregates. The dynamic light scattering (DLS) analysis suggested that aggregates were formed with a good batch‐to‐batch reproducibility in solutions and the size distributions varied with the mole ratio of TPE‐4TA to Ag+ (Supporting Information, Table S1). As an example, the mixture ([TPE‐4TA]=5 μm, [AgNO3]=25 μm) gave an efficient diameter of circa 50 nm (Figure 2 c). After evaporation of the solvent, nanoparticles (d=5–30 nm) were also observed under electron microscopy (Figure 2 d and the Supporting Information, Figure S4). Element mapping confirmed that the clustered nanoaggregates consisted of Ag, N, and C (Supporting Information, Figure S6). The fluorescent aggregates ([TPE‐4TA]=5 μm, [Ag+]=1–50 μm) had a negative zeta potential of −15 to −40 mV, likely owing to the anionic tetrazolate groups of TPE‐4TA being exposed at the aggregate–solution interface. The colloid gave no noticeable precipitation when stored for over three months. The aggregates have low solubility in common solvents, including DMSO, even at reflux conditions, likely because of the strong tetrazolate–silver interactions. These results supported a good colloidal stability of these fluorescent aggregates.
The fluorogenic Ag+ detection was next evaluated in the presence of interfering factors including different metal ions, pH, and common silver‐binding reagents. Most metal ions cannot turn on the fluorescence of TPE‐4TA (Figure 2 e and the Supporting Information, Figure S7). Hg2+ produced a weak fluorescent signal, which may result from a similar Hg2+‐tetrazolate coordination.11b The Ag+/Hg2+ coordination‐induced fluorogenic detection were then evaluated at different pH values (Figure 2 f). At pH 4, the tetrazole moiety with a pK a of 4–5 was mainly in the protonated form.14 The protonated TPE‐4TA likely aggregated in aqueous solution and thus elicited a blue emission peak at 470 nm. At pH 5, the probe was fully dissolved and produced no fluorescence. The Ag+‐induced fluorescence thus became significant. At pH>6, the maximum turn‐on response kept at a stable level, indicating that it offered a robust Ag+ quantification method from neutral to highly basic solutions. In the case of Hg2+ detection, the fluorogenic response was only observed within pH 5–8.
The interference tests included reagents used in silver stains and amino acids, which are reported to host Ag+ in the in‐gel staining of proteins (Supporting Information, Figure S8). All of these interfering reagents did not trigger the fluorescence turn‐on of TPE‐4TA. When Ag+ were bound to the reagents beforehand, TPE‐4TA molecules were also able to snatch (or co‐aggregated with) Ag+ from all the pre‐formed Ag+‐bound complexes included in the test and fluoresce, except from Ag+–cysteine complexes, likely because of the strong thiol–Ag+ bonding.7 The results suggested the feasibility of combining the Ag+ sensing with biological silver staining methods.
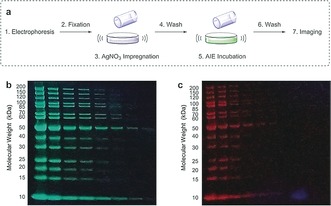
Following separation by SDS‐PAGE, we achieved an efficient fluorescent silver staining of proteins (Figure 3 a). For comparison, gels were also stained by conventional silver nitrate stain8 or SYPRO Ruby fluorescent stain.15 In the tests, a commercial protein ladder consisting of 14 proteins served as the sample. In the fluorescent silver‐AIE stain, all the protein bands were clearly visible under a UV lamp, correlating well with the bands stained by SYPRO Ruby dye (Figure 3 b). The strong green color also correlated well with that of the Ag+‐probe complexes (Supporting Information, Figure S9).
Figure 3.

a) Procedure for fluorescent silver‐AIE staining . Gels stained by b) the silver‐AIE stain and c) a SYPRO Ruby stain, imaged in parallel under 365 nm irradiation.
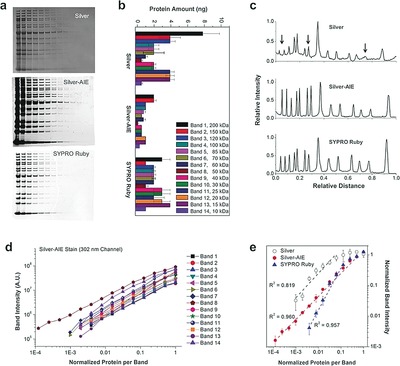
To compare the three staining methods, gels were analyzed by a gel imaging system (Supporting Information, Figure S10). Figure 4 a shows representative images, which show that the silver‐AIE stain gave a lower background than the silver nitrate stain and displayed a high contrast comparable to the SYPRO Ruby stain. Figure 4 b summarizes the lower limit of detection (LLD) for the observed proteins. The silver nitrate stain gave faintly gray bands with LLDs of about 1–10 ng band−1 as reported.8 The silver‐AIE stain showed a high resolution and in general showed 1–16‐fold lower LLDs, than the silver nitrate stain. The sensitivity is also 1–8‐fold higher than that of SYPRO Ruby stain. The detection performance is improved for the 10–40 kDa protein bands, indicating its advantages in low‐molecular weight proteins staining.
Figure 4.

Comparison of the silver nitrate, fluorescent silver‐AIE, and SYPRO Ruby staining methods. a) Representative gel images. In the lanes (from left to right), serial dilutions (2‐fold) of ladder proteins were loaded from 200–500 ng (1st lane) to 0.012–0.003 ng (15th lane). b) Lower limit of detection (n=3). c) Signal profiles of the 5th lane (10–25 ng/band) showing the differential protein detection. d) Signal intensity against the protein amount by the silver‐AIE stain (n=3). e) Signal intensity as a function of protein quantity for the band 8 protein (n=3), showing LDR of the three methods. X‐axis is the normalized amount of protein per band, where 1=200–500 ng/band.
As an example of the differential protein detection, the signal profile of the 5th lane (10–25 ng band−1) is shown in Figure 4 c. In contrast to the silver nitrate stain, which gave weak and distorted peaks, the silver‐AIE stain detected all the protein bands with a good profile contrast comparable to that of the SYPRO Ruby stain. Since these bands showed fluorescence with comparable intensity and uniformity (Figure 4 d), the silver‐AIE stain can be regarded to have minor inter‐protein variation, which is practically useful for total protein detection.
To compare the linear dynamic range (LDR) of the stains, we plotted the signal intensity against the amount of proteins for each band (Figure 4 d and the Supporting Information, Figure S11). The silver‐AIE stain gave a good and uniform linearity (similar slope) for all 14 proteins over a relatively broad range (Supporting Information, Table S2). For example, for the band 8 protein, in comparison with silver nitrate stain which gave a LDR of circa 1.5 logs (R2=0.819), the silver‐AIE stain displayed a linear range from 0.024–0.061 ng band−1 to 50–75 ng band−1), that is, a LDR of over 3.3 logs (Figure 4 e). The linearity (R2=0.960) is comparable with that of the SYPRO Ruby stain (R2=0.957, LDR from 0.78–1.96 ng band−1 to 50–75 ng band−1), indicating that the silver‐AIE stain can be used for protein quantification studies in which conventional silver stains were not recommended.6
The silver‐AIE staining method based on highly sensitive fluorogenic visualization was demonstrated to be robust with low run‐to‐run variability. In the stain, the soluble TPE‐4TA with AIE properties is non‐emissive before development and thus offered a low staining background. In contrast, the control stains required lengthy destaining steps and careful timing to prevent over‐staining and ensure the maximum sensitivity. In addition, the silver‐AIE stain avoids the use of aldehydes, which are irritants and carcinogenic, and therefore is safer than classic silver stains.
In conclusion, we report a new water‐soluble fluorogenic Ag+ probe TPE‐4TA, which enables the first practical fluorescent‐silver staining method. TPE‐4TA is a sensitive, selective and quantitative fluorescence turn‐on Ag+ probe and the detection works well in aqueous solutions. The coordination of anionic tetrazolate groups in TPE‐4TA with Ag+ results in spontaneous aggregation, which induces fluorescence of the AIE‐active probe. The fluorogenic aggregation was integrated with biological silver stains, leading to an efficient and robust fluorescent silver staining method for in‐gel protein detection. With a simple and straightforward protocol, the stain achieved up to 1–16‐fold improvement in sensitivity compared with conventional silver nitrate staining and the famous SPRYO Ruby staining, and showed good linearity over a range of over 3.3 logs for protein quantification. The novel silver staining may open a new avenue to revitalize the rich silver‐based biological techniques for the study of many other argyrophilic biological structures by fluorescent methods.
Conflict of interest
The authors declare no conflict of interest.
Supporting information
As a service to our authors and readers, this journal provides supporting information supplied by the authors. Such materials are peer reviewed and may be re‐organized for online delivery, but are not copy‐edited or typeset. Technical support issues arising from supporting information (other than missing files) should be addressed to the authors.
Supplementary
Acknowledgements
This work was partially supported by the Innovation and Technology Commission (Grant No. ITC‐CNERC14SC01), the University Grants Committee of Hong Kong (Grant No. AoE/P‐03/08), and the Research Grants Council of Hong Kong (Grant Nos. 16301614, 16305015, N_HKUST604/14 and A‐HKUST605/16). B.Z.T. is also grateful for the support from The National Science Foundation of China (21788102). S.X. is grateful for the support from the Swedish Research Council (Grant No. 2017‐06344).
S. Xie, A. Y. H. Wong, R. T. K. Kwok, Y. Li, H. Su, J. W. Y. Lam, S. Chen, B. Z. Tang, Angew. Chem. Int. Ed. 2018, 57, 5750.
Contributor Information
Prof. Dr. Sijie Chen, Email: sijie.chen@ki.se.
Prof. Dr. Ben Zhong Tang, Email: tangbenz@ust.hk.
References
- 1. Grant G., Brain Res. Rev. 2007, 55, 490–498. [DOI] [PubMed] [Google Scholar]
- 2. Uchihara T., Acta Neuropathol. 2007, 113, 483–499. [DOI] [PMC free article] [PubMed] [Google Scholar]
- 3.
- 3a. Grocott R. G., Am. J. Clin. Pathol. 1955, 25, 975–979; [DOI] [PubMed] [Google Scholar]
- 3b. Procop G. W., Haddad S., Quinn J., Wilson M. L., Henshaw N. G., Reller L. B., Artymyshyn R. L., Katanik M. T., Weinstein M. P., J. Clin. Microbiol. 2004, 42, 3333–3335. [DOI] [PMC free article] [PubMed] [Google Scholar]
- 4.
- 4a. Goodpasture C., Bloom S. E., Chromosoma 1975, 53, 37–50; [DOI] [PubMed] [Google Scholar]
- 4b. Sowmya G. V., Nahar P., Astekar M., Agarwal H., Singh M. P., Biotech. Histochem. 2017, 92, 115–121. [DOI] [PubMed] [Google Scholar]
- 5.
- 5a. Bassam B. J., Gresshoff P. M., Nat. Protoc. 2007, 2, 2649–2654. [DOI] [PubMed] [Google Scholar]
- 6.
- 6a. Chevallet M., Luche S., Rabilloud T., Nat. Protoc. 2006, 1, 1852–1858; [DOI] [PMC free article] [PubMed] [Google Scholar]
- 6b. Miller I., Crawford J., Gianazza E., Proteomics 2006, 6, 5385–5408; [DOI] [PubMed] [Google Scholar]
- 6c. Chevalier F., Proteome Sci. 2010, 8, 23; [DOI] [PMC free article] [PubMed] [Google Scholar]
- 6d. Gauci V. J., Wright E. P., Coorssen J. R., J. Chem. Biol. 2011, 4, 3–29. [DOI] [PMC free article] [PubMed] [Google Scholar]
- 7. Chernousova S., Epple M., Angew. Chem. Int. Ed. 2013, 52, 1636–1653; [DOI] [PubMed] [Google Scholar]; Angew. Chem. 2013, 125, 1678–1696. [Google Scholar]
- 8.
- 8a. Jin L. T., Hwang S. Y., Yoo G. S., Choi J. K., Electrophoresis 2004, 25, 2494–2500; [DOI] [PubMed] [Google Scholar]
- 8b. White I. R., Pickford R., Wood J., Skehel J. M., Gangadharan B., Cutler P., Electrophoresis 2004, 25, 3048–3054. [DOI] [PubMed] [Google Scholar]
- 9. Mei J., Leung N. L., Kwok R. T., Lam J. W., Tang B. Z., Chem. Rev. 2015, 115, 11718–11940. [DOI] [PubMed] [Google Scholar]
- 10.
- 10a. Chen S. J., Wang H., Hong Y. N., Tang B. Z., Mater. Horiz. 2016, 3, 283–293; [Google Scholar]
- 10b. Wang X. R., Hu J. M., Zhang G. Y., Liu S. Y., J. Am. Chem. Soc. 2014, 136, 9890–9893. [DOI] [PubMed] [Google Scholar]
- 11.
- 11a. Carlucci L., Ciani G., Proserpio D. M., Angew. Chem. Int. Ed. 1999, 38, 3488–3492; [DOI] [PubMed] [Google Scholar]; Angew. Chem. 1999, 111, 3700–3704; [Google Scholar]
- 11b. Zhang J. P., Zhang Y. B., Lin J. B., Chen X. M., Chem. Rev. 2012, 112, 1001–1033; [DOI] [PubMed] [Google Scholar]
- 11c. Lee J. H., Kang S., Lee J. Y., Jung J. H., Soft Matter 2012, 8, 6557–6563. [Google Scholar]
- 12.
- 12a. Aromí G., Barrios L. A., Roubeau O., Gamez P., Coord. Chem. Rev. 2011, 255, 485–546; [Google Scholar]
- 12b. Cook T. R., Zheng Y. R., Stang P. J., Chem. Rev. 2013, 113, 734–777. [DOI] [PMC free article] [PubMed] [Google Scholar]
- 13.
- 13a. Singha S., Kim D., Seo H., Cho S. W., Ahn K. H., Chem. Soc. Rev. 2015, 44, 4367–4399; [DOI] [PubMed] [Google Scholar]
- 13b. Neupane L. N., Oh E. T., Park H. J., Lee K. H., Anal. Chem. 2016, 88, 3333–3340; [DOI] [PubMed] [Google Scholar]
- 13c. Tao D. D., Wang Q., Yan X. S., Chen N., Li Z., Jiang Y. B., Chem. Commun. 2017, 53, 255–258; [DOI] [PubMed] [Google Scholar]
- 13d. Li Y., Yu H. J., Shao G., Gan F., J. Photochem. Photobiol. A 2015, 301, 14–19; [Google Scholar]
- 13e. Sinha N., Stegemann L., Tan T. T., Doltsinis N. L., Strassert C. A., Hahn F. E., Angew. Chem. Int. Ed. 2017, 56, 2785–2789; [DOI] [PubMed] [Google Scholar]; Angew. Chem. 2017, 129, 2829–2833. [Google Scholar]
- 14. Herr R. J., Bioorg. Med. Chem. 2002, 10, 3379–3393. [DOI] [PubMed] [Google Scholar]
- 15. Berggren K., Chernokalskaya E., Steinberg T. H., Kemper C., Lopez M. F., Diwu Z., Haugland R. P., Patton W. F., Electrophoresis 2000, 21, 2509–2521. [DOI] [PubMed] [Google Scholar]
Associated Data
This section collects any data citations, data availability statements, or supplementary materials included in this article.
Supplementary Materials
As a service to our authors and readers, this journal provides supporting information supplied by the authors. Such materials are peer reviewed and may be re‐organized for online delivery, but are not copy‐edited or typeset. Technical support issues arising from supporting information (other than missing files) should be addressed to the authors.
Supplementary


