

Summary
Objective
Epilepsy is one of the most common neurological conditions affecting about 1% of adults. Up to 40% of people with epilepsy (PWE) report recurring seizures while on medication. And optimal functioning requires good self‐management. Our objective was to evaluate a group self‐management education courses for people with epilepsy and drug‐resistant seizures by means of a multicenter, pragmatic, parallel group, randomized controlled trial.
Methods
We recruited adults with epilepsy, having ≥2 seizures in the prior 12 months, from specialist clinics. Consenting participants were randomized 1:1 to a group course or treatment as usual. The primary outcome measure was quality of life 12 months after randomization using Quality of Life 31‐P (QOLIE‐31‐P). Secondary outcome measures were seizure frequency and recency, psychological distress, impact and stigma of epilepsy, self‐mastery, medication adherence, and adverse effects. Analysis of outcomes followed the intention‐to‐treat principle using mixed‐effects regression models.
Results
We enrolled 404 participants (intervention: n = 205, control: n = 199) with 331 (82%) completing 12‐month follow‐up (intervention: n = 163, control: n = 168). Mean age was 41.7 years, ranging from 16 to 85, 54% were female and 75% were white. From the intervention arm, 73.7% attended all or some of the course. At 12‐month follow‐up, there were no statistically significant differences between trial arms in QOLIE‐31‐P (intervention mean: 67.4, standard deviation [SD]: 13.5; control mean: 69.5, SD 14.8) or in secondary outcome measures.
Significance
This is the first pragmatic trial of group education for people with poorly controlled epilepsy. Recruitment, course attendance, and follow‐up rates were higher than expected. The results show that the primary outcome and quality of life did not differ between the trial arms after 12 months. We found a high prevalence of felt‐stigma and psychological distress in this group of people with drug‐resistant seizures. To address this, social and psychological interventions require evaluation, and may be necessary before or alongside self‐management‐education courses.
Keywords: education, epilepsy, quality of life, randomized controlled trial, self‐management
1.
Key Points.
Largest randomized controlled trial (RCT) of a group course for people with chronic, drug‐resistant epilepsy achieved good participation and follow‐up
Mean quality of life (QoL) was comparatively high at baseline, 54% had anxiety and 28% depression symptoms, and 63% felt stigmatized
At 12‐month follow‐up, QoL and other outcomes were not different between the intervention and treatment‐as‐usual groups
A group course was well‐received by people with chronic, drug‐resistant epilepsy but was not sufficient to change quality of life after 12 months
1. INTRODUCTION
Epilepsy is one of the most common neurological conditions affecting about 1% of adults.1 Despite the use of drugs, about 40% of people with epilepsy (PWE) report recurring seizures.2 Recurring seizures increase the risk of injury, hospital admission, depression, and death.3, 4, 5 Seizure control depends on appropriate medication and, as in other long‐term conditions, on self‐management.6 PWE express the need for more information about their condition in order to achieve this.6, 7, 8
A 2‐day self‐management education course, “Modular Service Package Epilepsy” (MOSES), was evaluated for adults with epilepsy in German‐speaking countries, and a randomized‐controlled trial (RCT) demonstrated improved knowledge, coping, and seizure frequency after 6 months.9 It was subsequently offered to PWE in Germany, with health insurers reimbursing the cost. We know of no other epilepsy self‐management course with such widespread uptake. In the United Kingdom (UK), courses for people with other conditions such as diabetes have been tested, and are now freely accessible.10, 11
In this context, our research group responded to a commissioned call to test an English‐language version of MOSES, which we adapted for use in the UK and called it: Self‐management education for people with poorly controlled epilepsy (SMILE [UK]). German MOSES leaders trained UK Epilepsy Nurse Specialists and electroencephalography (EEG) technicians to deliver the course. We also undertook an external pilot with volunteers to test the feasibility and acceptability of delivering SMILE (UK) in the context of the National Health Service (NHS).12 This paper addresses the question: for people with poorly controlled epilepsy, does the SMILE (UK) self‐management course improve quality of life?
2. METHODS
The trial was conducted and reported in accordance with the Consolidated Standards of Reporting Trials (CONSORT) guidelines. A detailed description of the trial design, interventions, and outcome measures can be found in the published trial protocol.13 Here we provide a brief overview.
2.1. Trial design
This was a parallel arm, multicenter, randomized controlled trial (or RCT). Participants were randomly allocated to 1 of 2 trial arms: the SMILE (UK) training program plus treatment‐as‐usual (TAU) or TAU only. Assessments were performed at baseline prior to randomization, and 6‐ and 12‐months after randomization. The intervention was offered to the control group after their 12‐month assessment.
2.2. Trial setting
PWE were recruited from specialist epilepsy clinics at 8 hospitals in London and South East England between December 2013 and August 2016.
2.3. Standard protocol approvals, registrations, and patient consents
The study was approved by the National Research Ethics Service Committee London—Fulham (REC reference 12/LO/1962) and monitored by independent Data Monitoring (DMC) and Trial Steering Committees (TSC). Patients gave written informed consent to participate in the study. Trial registration: Current Controlled Trials ISRCTN57937389.
2.4. Patient recruitment
Stage 1: Neurologists sent letters to potentially eligible patients under their care informing them of the trial. Patients had 3 weeks to return an opt‐out response if they did not wish to proceed to the next stage. Stage 2: If an opt‐out slip was not received, their medical notes were reviewed by the research team to confirm eligibility. Those eligible were sent a letter from the research team inviting them to participate in the trial. Again, potential participants had 3 weeks to opt out of the next stage. Stage 3: Those who did not opt out were telephoned to discuss the trial and confirm eligibility if interested. Participants then gave written informed consent during a face‐to‐face interview with a researcher.
2.5. Eligibility criteria
Eligibility criteria were the following: aged ≥16 years, having a diagnosis of epilepsy made by a specialist for ≥1 year, prescribed antiepileptic drugs (AEDs), reporting at least 2 seizures (of any type) in the previous year, able to give informed consent, answer questionnaires in English, and attend a 2‐day course.
Patients were excluded if they only experienced psychogenic nonepileptic seizures or due to acute illness or substance misuse, serious psychiatric illness or a terminal condition, or if they were currently participating in other epilepsy‐related research.
2.6. Randomization and blinding
Randomization was provided by an online system managed by the King's Clinical Trials Unit, maintaining full allocation concealment.13, 14 Randomization occurred in blocks of 2 (1:1 intervention: control) and was stratified by treatment center. Research staff who completed follow‐up assessments and the patients’ healthcare providers were blinded to treatment allocation. Due to the nature of the intervention, participants were not blinded, although they were asked not to reveal their allocation to the researchers who completed their follow‐up assessments. Staff who were organizing the SMILE (UK) courses were not involved in data collection and were not blinded to allocation. The trial statistician remained blind until the end of the analysis, when the final parts that cannot be performed blind were completed, such as training group effects and treatment compliance.
2.7. Intervention
The intervention was a 2‐day group education course on self‐management, based on MOSES, for people with poorly controlled epilepsy, with carers also invited.9 We aimed for groups to include 8‐12 participants. The course was 16 hours over 2 consecutive days delivered by an epilepsy nurse specialist and an electroencephalography (EEG) technician. The premise of the course was to communicate information and to encourage participants to share their own experiences with others. Participants were given a workbook containing course content to use during the sessions and to take home. The course's content is presented briefly in Table 1, with further information available elsewhere.15 A fidelity implementation found that trainers within the trial delivered the intervention according to protocol, with good adherence and high competence.15
Table 1.
SMILE (UK) course content and self‐management components
| Module | Content | Self‐management component |
|---|---|---|
| Living with epilepsy | Sharing personal experience and emotions felt when living with epilepsy. How to cope with these emotions |
Addressing psychological comorbidity by discussing anger and anxiety. Increasing resilience by identifying coping strategies |
| People with epilepsy | Discussion of how common epilepsy is and about famous people who have epilepsy | Reducing stigma by discussing how common epilepsy is and the achievements of PWE |
| Basic knowledge | Causes of seizures and different seizure types | Increasing knowledge that leads to participants becoming “experts” in their epilepsy increases self‐confidence |
| Diagnosis | Investigations used to diagnose epilepsy. How to observe and document seizures to help diagnosis |
Improving seizure control. Addressing psychological comorbidity by reducing anxiety about medical procedures |
| Treatment | Overview of antiepileptic drugs, other treatments. How to take an active role in one's treatment |
Improving seizure control. Preventing/reducing risk of injury. Improving medication adherence. Addressing psychological comorbidity by understanding medication adverse effects and increasing self‐confidence in future discussions with healthcare professionals |
| Self‐control | Identifying auras and triggers. How to avoid triggers. Methods to reduce seizures |
Improving seizure control. Preventing/reducing risk of injury. Addressing psychological comorbidity by improving seizure control |
| Prognosis | Chances of achieving seizure freedom and stopping medication. Other options if seizure freedom is not achieved | Reducing stigma by discussing what can still be achieved if not seizure‐free |
| Personal and social life | Sharing how epilepsy affects personal and professional relationships. How to improve self‐esteem and develop contacts. Explaining epilepsy to others. Recommendations for hobbies, sports, independent living. Regulations about driving and employment |
Preventing/reducing risk of injury. Addressing psychological comorbidity by improving self‐esteem and identifying own qualities and weaknesses, how to seek psychological support, problem solving to pursue active lifestyle and live independently. Reducing stigma by reducing unnecessary restrictions on activities, creating and maintaining social contacts, reducing isolation, legislation and entitlements for disabilities |
| Epilepsy network | Information about available resources, user groups, charities, and psychological support | Reducing stigma by identifying support groups and organizations |
2.8. Measures
Clinical and psychosocial data were collected face‐to‐face at baseline prior to randomization. At baseline and at 12 months after randomization, primary and all secondary outcome measures were assessed. A postal 6‐month follow‐up assessment included a subset of the outcome measures. Full details of all the measures taken can be found in the published protocol13 and Table S1. The time points were selected to assess long‐term effectiveness of the course, in terms of scientific findings, and to assess the relative benefit in the context of commissioning healthcare.
2.8.1. Primary outcome
The primary outcome was epilepsy‐specific quality of life (QoL) 12 months after randomization. Because the MOSES trial had no effect on a generic QoL measure,9 a health‐specific scale was chosen, QOLIE‐31‐P (Quality of Life in Epilepsy‐3116 with added Patient‐specific weightings).17 This scale had the benefit of introducing patient's scoring of how aspects of QoL distressed them, thus adding more weight to the elements impacting their perception of QoL. In addition, the mean unadjusted total score was calculated by removing the patient weights (total QOLIE‐31), which permitted comparison with prior studies. The total score is out of a maximum of 100, where high scores mean good QoL.
2.8.2. Secondary outcomes
These comprised seizure frequency scales,3, 18 seizure recency (number of days since last seizure), Hospital Anxiety and Depression Scale (HADS)19 for psychological distress (anxiety and depression), Impact of Epilepsy,20, 21 Stigma of Epilepsy,22 Medication Adherence,23 medication adverse effects extracted from the QOLIE‐31‐P,17 and Self‐Mastery and Control.24 Only, the QOLIE‐31‐P, seizure frequency and recency, and Impact of Epilepsy were completed at the 6‐month follow‐up.
2.9. Sample size
The sample size calculation is explained in full in the published protocol and analysis plan.13, 14 The original calculation required a total of N = 428 participants to be randomized, providing 91.3% power to detect an effect size of d = 0.4 on the QOLIE‐31‐P scale at 12 months, assuming an attrition rate of 25%.
2.10. Statistical analyses
A detailed statistical analysis plan (SAP) was written, discussed by the DMC and signed off by the TSC prior to database lock.14
All outcomes were analyzed using the intention‐to‐treat (ITT) approach. Multiple imputation by chained equations (MICE) was used to impute missing outcome variables at all time points to produce inferences valid under the detected missing‐at‐random data generating process. This was necessary because treatment compliance within the intervention arm, defined as attending the beginning and end of each day of the course, was found to be predictive of missing primary outcome data according to a chi‐square test (P < .001). Univariable logistic regression was used to detect whether any baseline variables predicted missingness. Being male, education to degree level (vs no formal qualifications) and having no other significant medical conditions (vs having a psychiatric condition) were associated with completion of primary outcome data at 12 months. Treatment compliance (in the intervention arm) and baseline predictors of missingness were therefore included in the imputation step of the MICE procedure as fixed effects, as well as: measures of the outcome at all time points; training group in the SMILE (UK) arm; and all the variables forming the analysis model. This ensured that the imputation model was more general than the analysis model.
The analysis model for the primary outcome was a linear mixed model. It consisted of the dependent variable QOLIE‐31‐P at 12 months, with fixed explanatory variables: trial arm (SMILE [UK] vs TAU), using TAU as the reference category; randomization stratifier (dummy variable for treatment center); and baseline QOLIE‐31‐P. Random effects were included for the training group in the SMILE (UK) arm to account for shared group experiences. We generated 100 imputed datasets and combined analysis results according to Rubin's rules.25 Standardized treatment effect estimates, which are more appropriate for comparisons, were also calculated by dividing the estimated difference by the standard deviation of baseline QOLIE‐31‐P.
Secondary outcomes were analyzed following a similar approach, again using multiple imputation to allow for the detected missing‐at‐random process. For QOLIE‐31‐P at 6 months and other continuous secondary outcome variables, linear mixed‐effects models were used and standardized effects were calculated.
At each time point (baseline, 6 and 12 months), seizure recency was measured in terms of the number of days since last recalled seizure. This was converted into a proportion of time by dividing the number of seizure‐free days over the maximum number of seizure‐free days possible for that time point (1, 1.5, and 2 years), plus a recall bias period of 6 months: 548 days; 730 days; and 913 days, respectively. This proportion was then transformed into a continuous variable using the logit transformation and analyzed in the same way as the other continuous variables.
The 2 seizure frequency variables, Baker18 (<1 vs ≥1 seizure per month) and Thapar3 (0‐3 seizures, 4‐6 seizures, 7‐9 seizures, or 10+ seizures in a year), were analyzed as binary and ordinal outcomes, respectively, using a logistic mixed‐effects model and an ordinal logistic mixed‐effects model. To aid interpretation, the estimated treatment effects were exponentiated to produce odd‐ratios. Although both seizure frequency variables were measured at 6 months and included in the imputation step for the 12‐month outcomes, they were not analyzed separately as secondary outcomes because there was not a corresponding baseline measure for number of seizures in the last 6 months.
A complier average causal effect (CACE) analysis was carried out for the primary outcome to assess the efficacy of SMILE (UK) in the presence of noncompliance. For this, compliance with SMILE (UK) was again defined as full receipt (attending all 4 sessions) vs non‐full receipt, irrespective of treatment allocation. Statistical analyses were performed using Stata version 14.0.
3. RESULTS
3.1. Description of trial participants
Figure 1 provides a CONSORT diagram for this trial. From those eligible in the final stage (n = 1088), 37.4% consented into the study with 37.1% being randomized. Once actual follow‐up rates were established, the sample size requirement was updated to N = 400 using an attrition rate of 20%. Twelve‐month follow‐ups proved to be more successful than anticipated. At 12‐month, 81.9% of participants remained in the study (Intervention: 79.5%; TAU: 84.4%). Baseline data have been reported in full26 and are presented in Table 2. Compared to the UK population, more participants lived in deprived areas, but the characteristics of the 2 trial arms, including gender, were well balanced (Table 2). Baseline mean QOLIE‐31‐P score was 66.0, with a wide range of 24.8‐98.5. The mean unadjusted QOLIE‐31 score was 62.0, ranging from 24.5 to 97.6.
Figure 1.
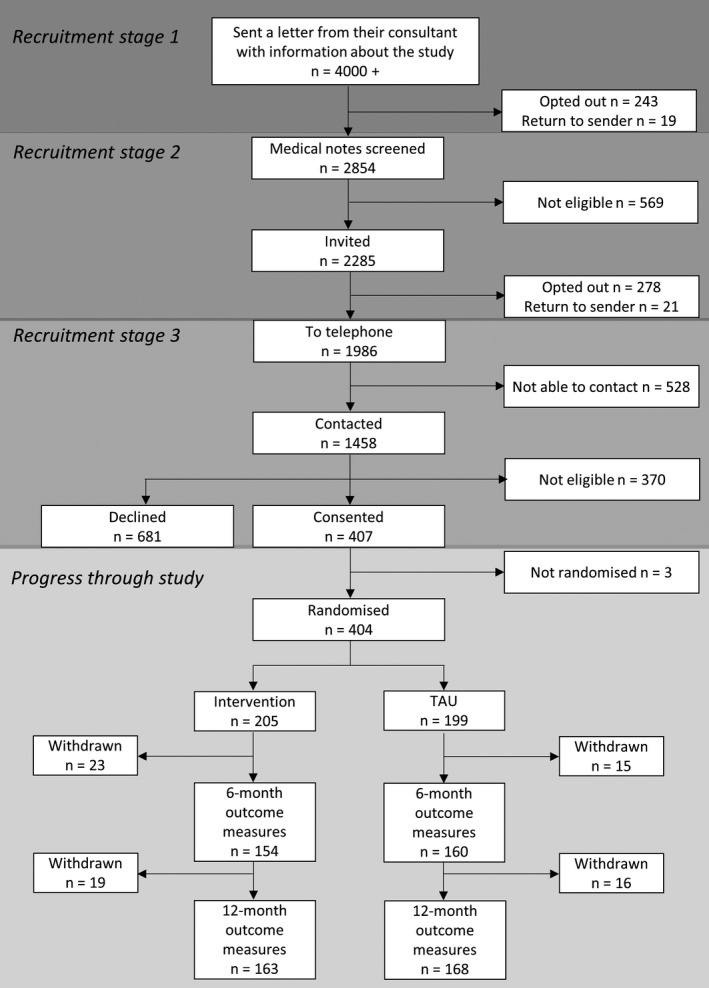
CONSORT diagram of participant recruitment and retention in the trial. Recruitment occurred through 3 stages, the first 2 requiring patients to opt out in order to not progress through the pathway. The third stage involved researchers contacting patients who did not opt out at stages 1 and 2. Three participants who consented were not randomized, in error. At the 6‐month follow‐up, missing outcome data occurred due to participants either not wanting to continue and formally withdrawing (n = 23 intervention; n = 15 TAU) or being presumed lost to follow‐up, that is, not returning postal questionnaires and being unreachable. Some of these participants who were presumed lost to follow‐up remained in the study and later participated in the 12‐month follow‐up. All participants not completing outcome data at the 12‐month follow‐up were considered withdrawals (n = 19 intervention; n = 16 TAU), that is, this included participants not wanting to continue and those lost‐to‐follow‐up
Table 2.
Baseline characteristics and outcome measures
| Variable | Level | Intervention n = 205 | TAU n = 199 | Total n = 404 |
|---|---|---|---|---|
| Age, mean (SD) [range] | Years | 42.5 (14.3) [16, 85] | 40.8 (14.0) [17, 82] | 41.7 (14.1) [16, 85] |
| Sex, n (%) | Female | 115 (56.1) | 104 (52.3) | 219 (54.2) |
| Male | 90 (43.9) | 95 (47.7) | 185 (45.8) | |
| Ethnicity, n (%) | White | 160 (78.0) | 144 (72.4) | 304 (75.2) |
| Mixed | 19 (9.3) | 21 (10.6) | 40 (9.9) | |
| Black | 16 (7.8) | 17 (8.5) | 33 (8.2) | |
| Asian | 7 (3.4) | 11 (5.5) | 18 (4.5) | |
| Other | 3 (1.5) | 6 (3.0) | 9 (2.2) | |
| IMD quintiles, n (%) | 1 (least deprived) | 20 (9.8) | 19 (9.5) | 39 (9.7) |
| 2 | 27 (13.2) | 29 (14.6) | 56 (13.9) | |
| 3 | 33 (16.1) | 31 (15.6) | 64 (15.8) | |
| 4 | 70 (34.1) | 66 (33.2) | 136 (33.7) | |
| 5 (most deprived) | 55 (26.8) | 54 (27.1) | 109 (27.0) | |
| Highest level of education, n (%) | No formal qualifications | 31 (15.1) | 30 (15.1) | 61 (15.1) |
| Secondary level | 69 (33.7) | 62 (31.2) | 131 (32.4) | |
| Postsecondary education | 44 (21.5) | 41 (20.6) | 85 (21.0) | |
| Bachelor's degree and higher | 61 (29.8) | 66 (33.2) | 127 (31.4) | |
| Living arrangements, n (%) | Living with others | 159 (77.6) | 146 (73.4) | 305 (75.5) |
| Living alone | 43 (21.0) | 52 (26.1) | 95 (23.5) | |
| Other arrangements | 3 (1.5) | 1 (0.5) | 4 (1.0) | |
| Marital status, n (%) | Single | 81 (39.7) | 95 (48.0) | 176 (43.8) |
| With partner, not cohabiting | 23 (11.3) | 21 (10.6) | 44 (10.9) | |
| Married/living with partner | 83 (40.7) | 70 (35.4) | 153 (38.1) | |
| Divorced/widowed | 17 (8.3) | 12 (6.1) | 29 (7.2) | |
| Employment, n (%) | Employed full‐time | 42 (20.5) | 46 (23.1) | 88 (21.8) |
| Employed part‐time | 22 (10.7) | 31 (15.6) | 53 (13.1) | |
| Self‐employed | 15 (7.3) | 13 (6.5) | 28 (6.9) | |
| Other | 32 (15.6) | 26 (13.1) | 58 (14.3) | |
| Unemployed | 94 (45.9) | 83 (41.7) | 177 (43.8) | |
| Clinical details | ||||
| Diagnosis of epilepsy, median (IQR) [range] | Number of years | 20 (8, 32) [1, 66] | 18 (8, 32) [1, 64] | 18 (8, 32) [1, 66] |
| Comorbidity, n (%) | None | 101 (49.3) | 118 (59.3) | 219 (54.2) |
| Another medical condition | 71 (34.6) | 61 (30.7) | 132 (32.7) | |
| Psychiatric condition | 10 (4.9) | 10 (5.0) | 20 (5.0) | |
| Both medical and psychiatric | 23 (11.2) | 10 (5.0) | 33 (8.2) | |
| Outcome measures | ||||
| QOLIE‐31‐P, mean (SD) [range] (higher score reflects greater QoL) | Total score | 65.2 (14.1) [30.0, 91.6] | 66.9 (14.2) [24.8, 98.5] | 66.0 (14.2) [24.8, 98.5] |
| QOLIE‐31, mean (SD) [range] (higher score reflects greater QoL) | Total score | 60.9 (15.6) [24.5, 93.7] | 63.1 (15.7) [24.7, 97.6] | 62.0 (15.6) [24.5, 97.6] |
| Seizure frequency in last 12 months, (Thapar) n (%) | 0‐3 times | 19 (9.3) | 30 (15.1) | 49 (12.1) |
| 4‐6 times | 29 (14.1) | 22 (11.1) | 51 (12.6) | |
| 7‐9 times | 15 (7.3) | 9 (4.5) | 24 (5.9) | |
| 10+ times | 142 (69.3) | 138 (69.3) | 280 (69.3) | |
| Seizure frequency in last 12 months, (Baker) n (%) | <1 per month | 52 (26.1) | 58 (29.6) | 110 (27.8) |
| ≥1 per month | 147 (73.9) | 138 (70.4) | 285 (72.2) | |
| Seizure recency in last 12 months, median (IQR) [range] | Days since last recalled seizure | 33 (19, 64) [1, 351] | 34 (17, 63) [3, 457] | 34 (18, 63) [1, 457] |
| Impact of epilepsy, mean (SD) [range] (higher score reflects less impact) | Total score | 24.4 (8.0) [10, 40] | 24.4 (8.1) [10, 40] | 24.4 (8.0) [10, 40] |
| Medication adherence, median (IQR) [range] (higher score reflects greater adherence) | Total score | 46.7 (43.3, 48.9) [16.7, 50.0] | 46.7 (43.3, 48.9) [26.7, 50.0] | 46.7 (43.3, 48.9) [16.7, 50.0] |
| Medication adverse effects, median (IQR) [range] (higher score reflects less adverse effects) | Total score | 7 (5, 10) [2, 10] | 7 (4, 10) [2, 10] | 7 (5, 10) [2, 10] |
| Anxiety (HADS‐A), mean (SD) [range] (higher score reflects more anxiety symptoms) | Total score | 9.0 (5.0) [0, 21] | 7.8 (4.8) [0, 21] | 8.4 (4.9) [0, 21] |
| Anxiety categories (HADS‐A) n (%) | Normal: 0‐7 | 83 (40.7) | 104 (52.3) | 187 (46.4) |
| Borderline: 8‐10 | 44 (21.6) | 35 (17.6) | 79 (19.6) | |
| Case: 11‐21 | 77 (37.7) | 60 (30.2) | 137 (34.0) | |
| Depression (HADS‐D), mean (SD) [range] (higher score reflects more depression symptoms) | Total score | 5.5 (3.9) [0, 18] | 5.0 (3.9) [0, 16] | 5.3 (3.9) [0, 18] |
| Depression categories (HADS‐D), n (%) | Normal: 0‐7 | 144 (70.6) | 146 (73.4) | 290 (72.0) |
| Borderline: 8‐10 | 37 (18.1) | 34 (17.1) | 71 (17.6) | |
| Case: 11‐21 | 23 (11.3) | 19 (9.5) | 42 (10.4) | |
| Stigma, median (IQR) [range] (higher score reflects greater stigma) | Total score | 1 (0, 4) [0, 9] | 2 (0, 4) [0, 9] | 1 (0, 4) [0, 9] |
| Stigma categories, n (%) | Not stigmatized: 0 | 76 (37.4) | 72 (36.4) | 148 (36.9) |
| Mild‐moderate: 1‐6 | 100 (49.3) | 103 (52.0) | 203 (50.6) | |
| Highly stigmatized: 7‐9 | 27 (13.3) | 23 (11.6) | 50 (12.5) | |
| Self‐mastery, mean (SD) [range] (higher score reflects more control) | Total score | 13.9 (3.4) [6, 23] | 14.3 (3.3) [6, 24] | 14.1 (3.3) [6, 24] |
IMD, Index of Multiple Deprivation indicates the level of deprivation according to the participant's postcode. National data are tabulated by the Office of National Statistics in the UK and distributed into quintiles, from lowest to highest levels of deprivation (Department for Communities and Local Government. English indices of deprivation 2010, 2010). A normally distributed population would have equal quintile groups, that is, 20% of participants within each group.
3.2. Intervention delivery and receipt, and retention of participants
Eighteen 2‐day courses were delivered and the mean group size was 8 (range 5‐14). The course was divided into 4 half‐day sessions, with 61.5% of participants attending all sessions, 12.3% attending 1‐3, and 26% attending none (Table S2). Reasons for not attending are detailed in Table S3. Eighty‐two percent of participants completed the 12‐month follow‐up assessment. Reasons for withdrawal are listed in Table 3. Three participants from the TAU group inadvertently attended the course prior to their 12‐month follow‐up due to administrative errors.
Table 3.
Reasons for withdrawal
| Reasons | Intervention n = 42 | TAU n = 31 |
|---|---|---|
| Adverse event, unrelated to intervention | 1 | 0 |
| Not interested in course | 0 | 1 |
| No longer wanted to complete assessments | 7 | 9 |
| No longer has diagnosis of epilepsy | 1 | 0 |
| Unable to contact participant | 32 | 21 |
| Unknown | 1 | 0 |
3.3. Adverse events
There were no adverse events related to the intervention (Table S4).
3.4. Study outcomes
3.4.1. Primary outcome: quality of life
The ITT analysis did not detect an effect of the intervention on total QOLIE‐31‐P scores (Cohen's d = −0.05; P = .564) at 12 months (Table 4). Thus, the intervention could not be shown to be effective. The CACE analysis, which defined 126 participants from the SMILE (UK) arm and 3 participants from the TAU arm as “full treatment compliers,” estimated an effect in the same direction and which also was not statistically significant (P = .528). Thus, there was also no evidence to suggest that the intervention was efficacious when fully adhered to.
Table 4.
Results of formal trial arm comparisons of primary and secondary outcomes
| Outcome | 6‐month follow‐up | 12‐month follow‐up | ||||||
|---|---|---|---|---|---|---|---|---|
| SMILE (UK) | TAU | Estimated difference between SMILE (UK) and TAU (95% CI) | Standardized treatment effect estimate, P‐value | SMILE (UK) | TAU | Estimated difference between SMILE (UK) and TAU (95% CI) | Standardized treatment effect estimate, P‐value | |
| QOLIE‐31‐P, mean (SD) [range] |
[n = 153] 66.3 (13.0) [34.2, 92.8] |
[n = 160] 65.5 (14.0) [27.3, 94.7] |
1.70 (−0.87, 4.26) |
0.12 P = .195 |
[n = 163] 67.4 (13.5) [25.1, 95.4] |
[n = 168] 69.5 (14.8) [26.4, 93.8] |
−0.72 (−3.19, 1.74) |
−0.05 P = .564a |
| Impact of epilepsy, mean (SD) [range] |
[n = 153] 25.1 (7.3) [10, 40] |
[n = 155] 24.8 (8.2) [10, 40] |
−0.35 (−1.83, 1.13) |
−0.04 P = .640 |
[n = 162] 25.4 (7.9) [10, 40] |
[n = 166] 26.0 (8.7) [10, 40] |
−0.96 (−2.30, 0.38) |
−0.12 P = .159 |
| Medication adherence, median (IQR) [range] | – | – | – | – |
[n = 162] 47.8 (45.6, 48.9) [27.8, 50.0] |
[n = 165] 47.8 (45.6, 48.9) [35.6, 50.0] |
−0.02 (−0.74, 0.71) |
0.00 P = .964 |
| Medication adverse effects, median (IQR) [range] |
[n = 159] 7 (5, 10) [2, 10] |
[n = 310] 7 (5, 10) [2, 10] |
0.03 (−0.56, 0.62) |
0.01 P = .923 |
[n = 163] 7 (5, 10) [2, 10] |
[n = 168] 8 (6, 10) [2, 10] |
−0.41 (−0.97, 0.15) |
−0.15 P = .151 |
| HADS‐anxiety, mean (SD) [range] | – | – | – | – |
[n = 162] 8.1 (4.6) [0, 20] |
[n = 167] 7.6 (4.3) [0, 20] |
−0.04 (−0.83, 0.74) |
−0.01 P = .917 |
| HADS‐depression, mean (SD) [range] | – | – | – | – |
[n = 162] 5.7 (4.1) [0, 20] |
[n = 167] 5.7 (4.3) [0, 18] |
−0.33 (−1.14, 0.49) |
−0.08 P = .432 |
| Stigma of epilepsy, median (IQR) [range] | – | – | – | – |
[n = 161] 2 (0, 4) [0, 9] |
[n = 167] 1 (0, 4) [0, 9] |
0.14 (−0.39, 0.66) |
0.05 P = .606 |
| Self‐mastery and control, mean (SD) [range] | – | – | – | – |
[n = 162] 14.5 (3.4) [7, 24] |
[n = 167] 14.6 (3.5) [6, 24] |
−0.16 (−0.94, 0.62) |
−0.05 P = .687 |
| Seizure frequency (Baker's) n (%) | [n = 160] | [n = 168] | ||||||
| <1 per month | 66 (41.2) | 73 (43.5) | ||||||
| ≥1 per month | – | – | – | – | 94 (58.8) | 95 (56.5) | b−0.02 (−0.63, 0.58) |
c0.98 P = .939 |
| Seizure frequency (Thapar's) n (%) | [n = 161] | [n = 168] | ||||||
| 0‐3 times | 23 (14.3) | 40 (23.8) | ||||||
| 4‐6 times | 23 (14.3) | 14 (8.3) | ||||||
| 7‐9 times | 10 (6.2) | 6 (3.6) | ||||||
| 10+ times | – | – | – | – | 105 (65.2) | 108 (64.3) | b0.11 (−0.43, 0.65) |
c1.12 P = .691 |
| Seizure recency (% time seizure‐free), median (IQR) [range] | [n = 134] @@ 2.3 (1.0, 7.7) [0.1, 74.8] | [n = 146] @@2.7 (0.8, 9.5) [0.1, 64.5] | b−0.19 (−0.60, 0.22) |
−0.16 P = .371 |
[n = 161] 1.2 (0.3, 7.3) [0.1, 77.3] |
[n = 164] 1.6 (0.4, 13.4) [0.1, 89.4] |
b−0.31 (−0.70, 0.09) |
−0.26 P = .129 |
QOLIE‐31‐P at 12‐month follow‐up is the primary outcome.
Estimated treatment effects are on the logit scale.
Standardized treatment effects are odds ratios.
3.4.2. Secondary outcomes
There was no statistically significant difference between SMILE (UK) and TAU according to the secondary outcome measures, including anxiety and depression scores. All effect sizes were around ± 0.2 SD or less, indicating small differences.27 All results are presented in Table 4. A paper reporting health economic outcomes will be published subsequently.
4. DISCUSSION
4.1. Summary of findings
We adapted a 2‐day, group self‐management course developed for German speakers, trained facilitators to deliver it in the context of the NHS and piloted the course with volunteers.12 Neurologists invited PWE who attended clinics during the prior year to a trial of the course, and 37% of those eligible consented. Twelve months after recruitment, 82% completed outcome assessments. Despite indications that treatment fidelity was high,15 QoL was not changed significantly by the intervention, nor were other outcomes, including psychological symptoms.
4.2. Strengths
This is the largest RCT conducted thus far on a discrete self‐management education course for people with epilepsy.28 We successfully recruited our required sample size and had high follow‐up rates14 indicating that our results were not underpowered.
We recruited a large group of adults with poorly controlled epilepsy from routine specialist clinics, in a metropolitan area, featuring multiethnicity, high resident turnover, and social deprivation. Our recruitment and retention rates were relatively high, compared to trials with volunteer groups, with limited ethnic variation and little social deprivation.28 Therefore bias was reduced, and our evidence can be generalized to similar populations in resource‐rich countries.
The course required people with chronic, drug‐resistant seizures to spend time and effort in completing assessments and travel to attend the course. Relatively high response and retention rates suggest that the intervention was not only acceptable but also attractive to PWE. Findings from an accompanying process evaluation with in‐depth interviews with participants who completed SMILE (UK) support this interpretation.29 In the UK, self‐management courses have been evaluated for type 1 diabetes, and are offered freely to service users with diabetes in the same region.10, 11 Recruitment to the diabetes trial and to the evidence‐based courses was 17% and 27%, respectively.10, 11 In comparison, recruitment to the SMILE (UK) trial was 37%, and of those randomized to the intervention 72% attended at least 2 of 4 sessions. Thus 27% of PWE attended the course, even though this was an untested research context.
4.3. Limitations
The main outcome variable stipulated by our funder was QoL, and we chose an epilepsy‐specific measure. A recent review found that QoL improved in some self‐management interventions, specifically when psychological co‐morbidity was addressed.30 A global review of resource‐rich and resource‐poor countries was published and reported that the mean QOLIE‐31 score was 60 for all PWE.31 In UK primary care, a longitudinal study in 2014 found a mean score of 70.32 However, 60% of PWE in primary care do not have recurring seizures.2 In contrast, all the PWE recruited to our trial had frequent seizures, managed by specialists, and their baseline mean QOLIE‐31 score was 62. Given the severity of their condition, this score may be near a ceiling for such patients, and therefore difficult to change. In addition, our group of PWE have lived with epilepsy for a median of 18 years, and a 2‐day course may have come too late in their illness trajectory to effect significant and long‐lasting change.
Travel to the course and anxiety about meeting others were barriers that prevented some from enrolling in the trial or attending the intervention. This could be mitigated by offering other types of telephone‐ or Internet‐based interventions; however, they have their own disadvantages. Some participants reported difficulties in reading the workbook and following aspects of the course. A web‐based program would likely to be challenging for them. Regardless of the method used to deliver an intervention, a group course does reduce the isolation and sense of stigma that PWE feel.29
In general, recall of information and events decrease over time. Recurring seizures and depression additionally may reduce recall among PWE.33 We did not assess memory impairment in our group, not wanting to add to the assessment length, exclude patients based on this, or deter patients by additional testing. However, in our process evaluation, we found that some participants described difficulties remembering the course and doing things in everyday life.29 In the context of the group's characteristics and the complex process of changing,6 it is possible that aspects of QoL and other outcomes could improve immediately after a course, but not be maintained 6 or 12 months later.
4.4. Interpretation
The result of our RCT is compatible with the null hypothesis that a 2‐day course is no more effective in changing QoL than usual medical care for PWE with persistent seizures who see specialists. Not all interventions that show promise in early efficacy trials are supported by subsequent pragmatic late phase trials. In the UK, the National Institute of Health Research (NIHR) Health Technology Assessment program is the major funder of pragmatic trials, and over two thirds of such trials have negative findings.34 This is more common for complex interventions than for drug trials.34 Reasons that positive findings in exploratory studies cannot be replicated in late phase trials include the following: differences in design, including not randomizing patients in small studies, outcome measures, and primary endpoints; initial false‐positive results, for example, due to bias and imbalance in study arms; and false‐negative results in late phase trials, when the target study population is different, for example, people with poorly controlled epilepsy may require different or more intense intervention to benefit.34
Complete seizure freedom is a known contributor to QoL. Not observing a decrease in seizures following the intervention may explain the lack of change in QoL. However, using our baseline data, we found that seizure frequency was only weakly associated with QoL. We found psychological distress was most associated with lower QoL in our group of PWE.26 There is no literature evidence to suggest that a solely educational intervention has ever changed QoL after 12 months in people with epilepsy.28 In previous trials participants have been followed for no longer than 6 months, and results were negative for total mean QoL changes, including in the MOSES trial.9, 28 One trial in a resource‐poor country with 144 participants at the 6‐month follow‐up reported that QoL did change significantly.35 However, baseline mean QoL score in the intervention group was about 10 points lower than is usual in resource‐rich countries. So, low scores at baseline may have provided more scope for improvement. In addition, that intervention consisted of 5 components, including a course, plus regular one‐to‐one advice and monitoring.35 A review of interventions for long‐term conditions generally has emphasized the importance of integrating and reinforcing self‐management education, with other, preferably routine, advice and monitoring.8 This integration and reinforcement has been described in 2 epilepsy trials; the second one included a course plus nurse‐led monitoring.35, 36
In the MOSES trial, participants were recruited by advertising; there was no minimum seizure requirement to participate, 42% had no seizure in the prior 6 months, and there was less comorbidity (MOSES: 35% vs SMILE [UK]: 50%). Analyses were carried out based on a per protocol approach to target efficacy. However, this approach no longer retains the benefits of randomization and raises the possibility of selection bias. Consistent with this, the median duration of epilepsy was significantly lower in the MOSES intervention arm once noncompleters were dropped from the trial sample (MOSES control: 18.2 years, MOSES intervention: 13.5 years, P = .034).9 Six months after a course, people with less frequent seizures, shorter epilepsy duration, and less comorbidity were, and may generally be, more likely to remember epilepsy‐related information, increase their sense of control, and by better self‐management, reduce the frequency of their seizures.9
At baseline, seizure frequency of SMILE (UK) participants was higher than in MOSES, with 70% experiencing ≥10 seizures per year. Psychological symptoms were reported frequently, with 54% reporting current anxiety symptoms and 28% reporting current depression symptoms at borderline or case‐level. There was much variation in QoL scores from 24.5 to 97.6, and it was most strongly associated with presence or absence of psychological symptoms.26 This has also been reported elsewhere.31, 37
Nevertheless, despite their psychosocial distress and difficulties with travel for those with frequent seizures, 74% of those randomized attended all or some of the course. Our analysis of baseline measures also found that 63% of participants felt stigmatized, a concept which describes feelings of shame. When a subgroup of participants were interviewed after the intervention, they said that they valued sharing their experiences with people like them; feeling “less alone” improved their self‐acceptance and confidence to talk about and manage their epilepsy subsequently.29 In other stigmatized conditions, there has been more research on interventions designed specifically to address stigma.38, 39 Our findings support the idea that working in groups promotes individual self‐confidence to manage their condition, which may be a precursor to self‐mastery.6, 38, 39 Participants suggested that such groups should be provided early on in epilepsy.
4.5. Implications for research
In the evaluation of stand‐alone education courses for PWE, on the basis of this RCT and a literature review,28 QoL is not an appropriate outcome to measure the benefits of an educational course. An important feature of PWE and persistent seizures is the high prevalence of psychological distress, which is also a major correlate of QoL. A few small trials suggest that cognitive behavioral therapy or acceptance and commitment therapy might improve outcomes, including QoL.28 High quality trials of psychological treatments for PWE are a priority in the future.
An important feature in epilepsy is the stigma that a high proportion of PWE feel. Future evaluations may well benefit from looking at the evidence on complex interventions for other stigmatized, long‐term conditions.38, 39 This might lead to testing group interventions for PWE, to evaluate whether self‐esteem and self‐mastery can be improved by sharing feelings and experiences in groups preferably early on after diagnosis.
As a way to increase participation and to offer continued education, use of digital tools and booster sessions, in person or via telephone, could mitigate the effects of transportation issues and memory difficulties.35, 36 However, if self‐management interventions are to combat social isolation and stigma, some element of face‐to‐face sharing is beneficial.
4.6. Implications for health care
Our findings suggest that clinicians in the UK, in common with those in other countries, either do not diagnose or do not have the capacity to effectively treat the psychological impairment that frequently accompanies epilepsy, and this is associated with lower QoL. Luoni has suggested a “diagnostic gap” in depression for PWE.37 There may be an even larger gap in the diagnosis/management of anxiety symptoms.40 A brief symptom questionnaire could help to identify psychological comorbidity in routine care. This is important as depression is associated with poor drug‐adherence, poor epilepsy control, and risk of premature death.3, 4, 5
When clinicians invite PWE who have attended routine clinics to participate in group courses, a relatively large proportion attend and report that courses help redress their sense of being alone and low self‐confidence. In the absence of courses, clinicians could encourage PWE to join user self‐help groups, and explicitly endorse the value of such groups in consultations with patients.
PWE may need to cope with cognitive issues, including memory impairment, psychological distress, and social stigma. Because of this, their health care will most optimally include a biopsychosocial approach such as the following: (1) courses with digital offerings, divided into sessions which could be repeated, and which may target cognitive ability levels, assessed in advance; (2) psychological interventions; and (3) peer‐group work provided in person, by phone, or through social media.23, 41 Despite being difficult to test, multifaceted interventions are most likely to help people improve self‐management of chronic conditions.6, 8 More research is needed, as poor epilepsy control is associated with more health service use and a higher incidence of premature death.1, 2 In England, the epilepsy death rate is rising, and compared to people with epilepsy living in the least‐deprived areas, those living in the most‐deprived areas experience a death rate 3 times as high.1, 42 It is therefore vital to improve on health care for people with epilepsy.28
DISCLOSURE
The authors have no conflicts of interest to disclose. We confirm that we have read the Journal's position on issues involved in ethical publication and affirm that this report is consistent with those guidelines.
Supporting information
ACKNOWLEDGMENTS
Thanks to members of the Trial Steering Committee (Anne Rogers [chair], Howard A. Ring, Phil Smith, Henry Smithson, Ajay Thapar, Marie Edgar), the Data Monitoring Committee (Gene Feder [chair], Adrian Mander, and Mark Manford). We thank the study Principal Investigators (Matthew Walker, Dora Lozsadi, Bridget MacDonald, Jennifer Quirk, Robert S. Delamont, Michalis Koutroumanidis, Lina Nashef, Nandini Mullatti, Asra Siddiqui, Hannah Cock, Fergus Rugg‐Gun, Dominic Heaney, John Duncan, Robert Elwes, and Ray Chaudhuri), MOSES experts (Dieter Dennig, Margarete Pfafflin, and Rupprecht Thorbecke), the SMILE (UK) facilitators (Devi Amin, Tony Hollands, Cathy Queally, Sally‐Ann Remnant, Jennifer Nightingale, Peter Muthiniji, Lee Drummond, Nancy Richardson, Telma Neves, Sandra Chinyere, and Marisa Pina) and their mentor Franz Brunnhuber, and the research team (Alison McKinlay, Sarah Feehan, and Carly Pearson).
This research was independent and funded by the National Institute for Health Research (Health Technology Assessment, 09/165/01—Self‐Management education for adults with poorly controlled epILEpsy [SMILE] A Randomized Controlled Trial). SJCT was (in part) supported by the National Institute for Health Research (NIHR) Collaboration for Leadership in Applied Health Research and Care (CLAHRC) North Thames at Bart's Health NHS Trust. This report also represents independent research part‐funded by the National Institute for Health Research (NIHR) Maudsley Biomedical Research Unit at the South London and Maudsley NHS Foundation Trust and King's College London (LR, SL, and LHG). Support for recruitment was obtained from the NIHR Clinical Research Network South London. Funds were obtained for printing workbooks for the SMILE (UK) course from Sanofi, with no input on the content. The views and opinions expressed herein are those of the authors and do not necessarily reflect those of the HTA programme, NIHR, NHS, or the Department of Health and Social Care.
Ridsdale L, Wojewodka G, Robinson EJ, et al. The effectiveness of a group self‐management education courses for adults with poorly controlled epilepsy, SMILE (UK): A randomized controlled trial. Epilepsia. 2018;59:1048–1061. https://doi.org/10.1111/epi.14073
L. Ridsdale and G. Wojewodka are co‐first authors.
L. Ridsdale is a chief investigator.
S. Landau and L. H. Goldstein are co‐senior authors.
REFERENCES
- 1. Ridsdale L, Charlton J, Ashworth M, et al. Epilepsy mortality and risk factors for death in epilepsy: a population‐based study. Br J Gen Pract. 2011;61:e271–8. [DOI] [PMC free article] [PubMed] [Google Scholar]
- 2. Moran NF, Poole K, Bell G, et al. Epilepsy in the United Kingdom: seizure frequency and severity, anti‐epileptic drug utilization and impact on life in 1652 people with epilepsy. Seizure. 2004;13:425–33. [DOI] [PubMed] [Google Scholar]
- 3. Thapar A, Kerr M, Harold G. Stress, anxiety, depression, and epilepsy: investigating the relationship between psychological factors and seizures. Epilepsy Behav. 2009;14:134–40. [DOI] [PubMed] [Google Scholar]
- 4. Ettinger AB, Good MB, Manjunath R, et al. The relationship of depression to antiepileptic drug adherence and quality of life in epilepsy. Epilepsy Behav. 2014;36:138–43. [DOI] [PubMed] [Google Scholar]
- 5. Ridsdale L. Avoiding premature death in epilepsy. BMJ. 2015;350:h718. [DOI] [PubMed] [Google Scholar]
- 6. Lorig KR, Holman H. Self‐management education: history, definition, outcomes, and mechanisms. Ann Behav Med. 2003;26:1–7. [DOI] [PubMed] [Google Scholar]
- 7. Prinjha S, Chapple A, Herxheimer A, et al. Many people with epilepsy want to know more: a qualitative study. Fam Pract. 2005;22:435–41. [DOI] [PubMed] [Google Scholar]
- 8. Taylor SJC, Pinnock H, Epiphaniou E, et al. A rapid synthesis of the evidence on interventions supporting self‐management for people with long‐term conditions: PRISMS – Practical systematic Review of Self‐Management Support for long‐term conditions. Southampton, UK: NIHR Journals Library; 2014. [PubMed] [Google Scholar]
- 9. May TW, Pfafflin M. The efficacy of an educational treatment program for patients with epilepsy (MOSES): results of a controlled, randomized study. Modular Service Package Epilepsy. Epilepsia. 2002;43:539–49. [DOI] [PubMed] [Google Scholar]
- 10. DAFNE Study Group . Training in flexible, intensive insulin management to enable dietary freedom in people with type 1 diabetes: dose adjustment for normal eating (DAFNE) randomised controlled trial. BMJ. 2002;325:746–9. [DOI] [PMC free article] [PubMed] [Google Scholar]
- 11. Harris SM, Shah P, Mulnier H, et al. Factors influencing attendance at structured education for Type 1 diabetes in south London. Diabet Med. 2017;34:828–33. [DOI] [PubMed] [Google Scholar]
- 12. Laybourne AH, Morgan M, Watkins SH, et al. Self‐management for people with poorly controlled epilepsy: participants’ views of the UK Self‐Management in epILEpsy (SMILE) program. Epilepsy Behav. 2015;52:159–64. [DOI] [PubMed] [Google Scholar]
- 13. Kralj‐Hans I, Goldstein LH, Noble AJ, et al. Self‐management education for adults with poorly controlled epILEpsy (SMILE (UK)): a randomised controlled trial protocol. BMC Neurol. 2014;14:69. [DOI] [PMC free article] [PubMed] [Google Scholar]
- 14. Magill N, Ridsdale L, Goldstein LH, et al. Self‐management education for adults with poorly controlled epilepsy (SMILE (UK)): statistical, economic and qualitative analysis plan for a randomised controlled trial. Trials. 2015;16:269. [DOI] [PMC free article] [PubMed] [Google Scholar]
- 15. Wojewodka G, Hurley S, Taylor SJC, et al. Implementation fidelity of a self‐management course for epilepsy: method and assessment. BMC Med Res Methodol. 2017;17:100. [DOI] [PMC free article] [PubMed] [Google Scholar]
- 16. Cramer JA, Perrine K, Devinsky O, et al. Development and cross‐cultural translations of a 31‐item quality of life in epilepsy inventory. Epilepsia. 1998;39:81–8. [DOI] [PubMed] [Google Scholar]
- 17. Cramer JA, Van Hammee G, Group NS . Maintenance of improvement in health‐related quality of life during long‐term treatment with levetiracetam. Epilepsy Behav. 2003;4:118–23. [DOI] [PubMed] [Google Scholar]
- 18. Baker GA, Jacoby A, Buck D, et al. Quality of life of people with epilepsy: a European study. Epilepsia. 1997;38:353–62. [DOI] [PubMed] [Google Scholar]
- 19. Zigmond AS, Snaith RP. The hospital anxiety and depression scale. Acta Psychiatr Scand. 1983;67:361–70. [DOI] [PubMed] [Google Scholar]
- 20. Jacoby A, Baker G, Smith D, et al. Measuring the impact of epilepsy: the development of a novel scale. Epilepsy Res. 1993;16:83–8. [DOI] [PubMed] [Google Scholar]
- 21. Crossley J, Jacoby A, Baker GA. The reliability and validity of the Revised Liverpool Impact of Epilepsy Scale for use in people with new‐onset epilepsy. Epilepsy Behav. 2013;26:175–81. [DOI] [PubMed] [Google Scholar]
- 22. Jacoby A. Felt versus enacted stigma: a concept revisited. Evidence from a study of people with epilepsy in remission. Soc Sci Med. 1994;38:269–74. [DOI] [PubMed] [Google Scholar]
- 23. DiIorio C, Shafer PO, Letz R, et al. Project EASE: a study to test a psychosocial model of epilepsy medication management. Epilepsy Behav. 2004;5:926–36. [DOI] [PubMed] [Google Scholar]
- 24. Wagner AK, Keller SD, Kosinski M, et al. Advances in methods for assessing the impact of epilepsy and antiepileptic drug therapy on patients’ health‐related quality of life. Qual Life Res. 1995;4:115–34. [DOI] [PubMed] [Google Scholar]
- 25. Little RJA, Rubin DB, Little RJA, et al. Missing data in experiments statistical analysis with missing data. Hoboken, NJ: John Wiley & Sons, Inc.; 2002. [Google Scholar]
- 26. Ridsdale L, Wojewodka G, Robinson E, et al. Characteristics associated with quality of life among people with drug‐resistant epilepsy. J Neurol. 2017;264:1174–84. [DOI] [PMC free article] [PubMed] [Google Scholar]
- 27. Cohen J. Statistical power analysis for the behavioral sciences. Hillsdale, NJ: Eribaum; 1988. [Google Scholar]
- 28. Smith A, McKinlay A, Wojewodka G, et al. A systematic review and narrative synthesis of group self‐management interventions for adults with epilepsy. BMC Neurol. 2017;17:114. [DOI] [PMC free article] [PubMed] [Google Scholar]
- 29. Ridsdale L, Philpott SJ, Krooupa AM, et al. People with epilepsy obtain added value from education in groups: results of a qualitative study. Eur J Neurol. 2017;24:609–16. [DOI] [PMC free article] [PubMed] [Google Scholar]
- 30. Michaelis R, Tang V, Wagner JL, et al. Psychological treatments for people with epilepsy. Cochrane Database Syst Rev. 2017;10:CD012081. [DOI] [PMC free article] [PubMed] [Google Scholar]
- 31. Saadi A, Patenaude B, Mateen FJ. Quality of life in epilepsy‐31 inventory (QOLIE‐31) scores: a global comparison. Epilepsy Behav. 2016;65:13–7. [DOI] [PubMed] [Google Scholar]
- 32. Peters M, Crocker H, Dummett S, et al. Change in health status in long‐term conditions over a one year period: a cohort survey using patient‐reported outcome measures. Health Qual Life Outcomes. 2014;12:123. [DOI] [PMC free article] [PubMed] [Google Scholar]
- 33. Zeman A, Kapur N, Jones‐Gotman M. Epilepsy and memory. Oxford, UK: Oxford University Press; 2012. [Google Scholar]
- 34. Crawford MJ, Barnicot K, Patterson S, et al. Negative results in phase III trials of complex interventions: cause for concern or just good science? Br J Psychiatry. 2016;209:6–8. [DOI] [PubMed] [Google Scholar]
- 35. Losada‐Camacho M, Guerrero‐Pabon MF, Garcia‐Delgado P, et al. Impact of a pharmaceutical care programme on health‐related quality of life among women with epilepsy: a randomised controlled trial (IPHIWWE study). Health Qual Life Outcomes. 2014;12:162. [DOI] [PMC free article] [PubMed] [Google Scholar]
- 36. Helde G, Bovim G, Brathen G, et al. A structured, nurse‐led intervention program improves quality of life in patients with epilepsy: a randomized, controlled trial. Epilepsy Behav. 2005;7:451–7. [DOI] [PubMed] [Google Scholar]
- 37. Luoni C, Bisulli F, Canevini MP, et al. Determinants of health‐related quality of life in pharmacoresistant epilepsy: results from a large multicenter study of consecutively enrolled patients using validated quantitative assessments. Epilepsia. 2011;52:2181–91. [DOI] [PubMed] [Google Scholar]
- 38. Stangl AL, Lloyd JK, Brady LM, et al. A systematic review of interventions to reduce HIV‐related stigma and discrimination from 2002 to 2013: how far have we come? J Int AIDS Soc. 2013;16:18734. [DOI] [PMC free article] [PubMed] [Google Scholar]
- 39. Thornicroft G, Mehta N, Clement S, et al. Evidence for effective interventions to reduce mental‐health‐related stigma and discrimination. Lancet. 2016;387:1123–32. [DOI] [PubMed] [Google Scholar]
- 40. Scott AJ, Sharpe L, Hunt C, et al. Anxiety and depressive disorders in people with epilepsy: a meta‐analysis. Epilepsia. 2017;58:973–82. [DOI] [PubMed] [Google Scholar]
- 41. Fraser RT, Johnson EK, Miller JW, et al. Managing epilepsy well: self‐management needs assessment. Epilepsy Behav. 2011;20:291–8. [DOI] [PubMed] [Google Scholar]
- 42. National Neurology Intelligence Network and National End of Life Care Intelligence Network PHE . Deaths associated with neurological conditions in England 2001 to 2014: Data Analysis Report, 2018. [cited 2018 Mar 15]. Available from https://www.gov.uk/government/publications/deaths-associated-with-neurological-conditions
Associated Data
This section collects any data citations, data availability statements, or supplementary materials included in this article.
Supplementary Materials