Abstract
Accurate non-invasive assessment of tissue elasticity in vivo is required for early diagnostics of many tissue abnormalities. We have developed a focused air-pulse system that produces a low-pressure and short-duration air stream, which can be used to excite transient surface waves (SWs) in soft tissues. System characteristics were studied using a high-resolution analog pressure transducer to describe the excitation pressure. Results indicate that the excitation pressure provided by the air-pulse system can be easily controlled by the air source pressure, the angle of delivery, and the distance between the tissue surface and the port of the air-pulse system. Furthermore, we integrated this focused air-pulse system with phase-sensitive optical coherence tomography (PhS-OCT) to make non-contact measurements of tissue elasticity. The PhS-OCT system is used to assess the group velocity of SW propagation, which can be used to determine Young’s modulus. Pilot experiments were performed on gelatin phantoms with different concentrations (10%, 12% and 14% w/w). The results demonstrate the feasibility of using this focused air-pulse system combined with PhS-OCT to estimate tissue elasticity. This easily controlled non-contact technique is potentially useful to study the biomechanical properties of ocular and other tissues in vivo.
1. Introduction
Non-invasive assessment of tissue elasticity in vivo is a challenging problem of great clinical importance as the structural properties are often changed by disease. Biophysical properties of tissue (e.g. stiffness and deformation resistance) are important in several degenerative ocular diseases such as glaucoma and keratoconus, where abnormalities result in profound changes in the structural integrity and physiological function of the eye [1]. Accurate determination of Young’s modulus in tissues can help with clinical diagnosis and interpretation of various diseases. For example, it is well known that tumorigenesis involves significant changes in tissue stiffness on macro- and microscopic scales [2]. Multiple methods exist to measure the biophysical properties of tissues (e.g. elasticity) at several scales: from ultrasonic and magnetic resonance imaging at the organ level [3, 4], to atomic force microscopy at the cellular level [5]. Recently, a method for measurements of tissue elasticity based on optical coherence tomography (OCT) imaging has been established [6]. This approach has the advantage of high spatial and temporal resolution combined with non-invasive assessment.
OCT-based elasticity measurements rely on high-resolution imaging of tissue followed by the mechanical excitation and subsequent measurement of tissue deformation. This approach typically requires two subsystems: an excitation system that can be used to mechanically interrogate the tissue, and an OCT system that is sensitive enough to detect the mechanical response of tissue. Phase-resolved methods based on the processing of complex OCT signal have been developed with the capability to detect nanometer-scale changes of optical path length [7, 8]. This is sufficient for the detection of micron and sub-micron-level structural changes in tissue.
The excitation systems can be classified as static/quasi-static excitation or dynamic excitation, and corresponding algorithms of quantifying elasticity are utilized [9]. Liang et al applied a mechanical wave drive to vibrate a sample stage and compress the tissue against a fixed optically transparent window with step or sinusoidal movement [10]. This dynamic system allows the quantification of Young’s modulus of tissue based on a Voigt body model. However, the excitation method in this technique is a significant limitation for in vivo applications. With a similar algorithm to quantify Young’s modulus, Liang et al utilized acoustic radiation force for internal dynamic excitation [11]. This method avoids the direct contact with the tissue surface, but the acoustic excitation waves require water for acoustic coupling between transducer and tissue. Li et al used a custom-built shaker to generate an impulse mechanical stimulus which excites surface waves (SWs) in tissue [12]. The velocity of the induced SWs at different frequencies is related to the Young’s modulus of tissue at the corresponding depth. However, the contact between the shaker and the tissue surface may cause injury to delicate soft tissues, e.g. ocular or injured tissues. Relying on the direct relationship between the group velocity of surface acoustic waves (SAWs) and Young’s modulus, Li et al used a pulsed laser to induce SAWs in tissue [13]. Although this application of photothermal effect makes the excitation method non-contact and non-invasive, the efficiency of light absorption and the safe level of heat generated inside the tissue limit the amplitude of induced waves. Thus, a non-contact, safe, and easy-to-control stimulus is required for OCT-based elasticity measurement of soft tissues in vivo.
Existing approaches for the measurement of biophysical properties of ocular tissue are based upon large magnitude global deformations of the eye. Commercially available instruments such as the Ocular Response Analyzer (Reichert, Arlington, WA) as well as other experimental approaches [14, 15] deform the cornea by more than 1.5–2 mm. This results in gross shape deformation of the globe with movement of the lens and iris, and retropulsion of the eye globe into the skull. A more spatially and temporally discrete method of tissue excitation could better isolate the observed deformation dynamics to the structure of interest.
To meet this demand, we have developed a focused air-pulse system capable of inducing SWs by applying a low-pressure and short-duration air stream on the surface of soft tissues. In this letter, we describe the major characteristics of the focused air-pulse system and demonstrate the feasibility of combining the focused air-pulse system with phase-sensitive OCT (PhS-OCT) to estimate Young’s modulus of various samples.
2. Materials and methods
2.1. Focused air-pulse system and PhS-OCT system
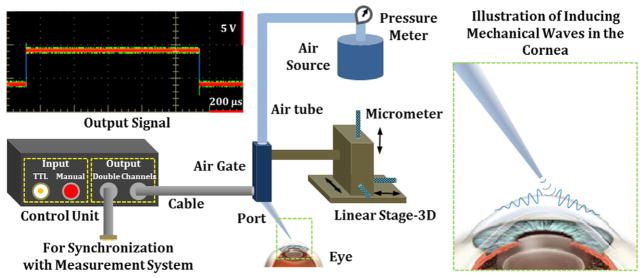
Figure 1 shows a schematic diagram of the focused air-pulse system with the illustration of inducing mechanical waves in the cornea. The custom-built air-pulse system relies on an air gate and a circuit as a control unit to provide an air stream with a (programmed) duration of ≤1 ms. A TTL input channel and an extra channel for signal output from the control unit allow proper synchronization with the measurement system. The air source with a pressure meter offers known initial air pressure to the system. The output of the air-pulse system is through a port with a diameter of 0.15 mm. A 3D-linear micrometer stage is used to precisely position the port for localized air-pulse excitation. As air is used to induce deformation on the surface of tissue, this excitation system can be treated as a non-contact stimulation method.
Figure 1.
Schematic diagram of the focused air-pulse system with the illustration of inducing mechanical waves in the cornea.
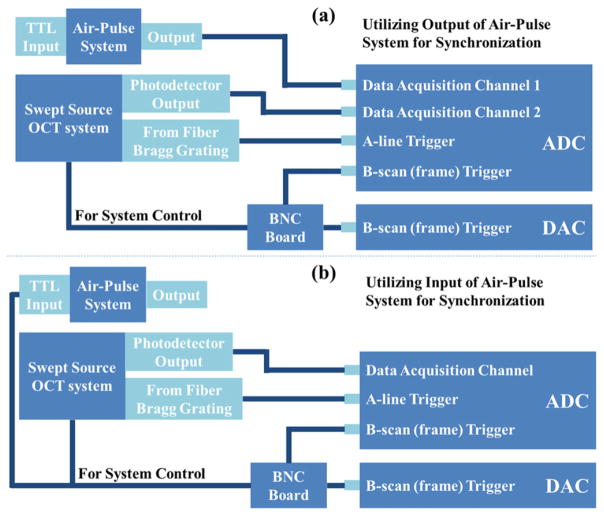
A phase-sensitive swept-source OCT system was utilized for the measurement of the SWs induced by the air-pulse system. The OCT system is described in detail in our previous work [16–18]. The A-line rate of our system can reach 30 kHz with a time resolution of approximately 33 μs for the monitoring of SWs. The phase stability of the system is measured to be 16 mrad, which corresponds to the detectable displacement of ~3 nm. For OCT imaging, the ADC digitizes the signal of interference fringes from the balanced photodetector with two triggering signals; one is the trigger for the A-line, and the other is for the B-scan (frame). Two methods for the synchronization between the OCT and air-pulse systems are illustrated in figure 2. One way is to record the output signal from the air-pulse system through another channel of the ADC, as shown in figure 2(a), so we can get the exact time of the air gate opening and the status of SWs on the tissue surface in parallel. The other way is to utilize the B-scan triggering signal as the input for the air-pulse system, shown in figure 2(b). In this case, the time of opening the air gate is the same as the start of each frame of OCT.
Figure 2.
Illustration of the synchronization between the air-pulse system and PhS-OCT system through (a) the output signal of the air-pulse system and (b) the input signal of the air-pulse system.
2.2. Gelatin phantom
Tissue-mimicking gelatin phantoms were made with mixes of gelatin powder and distilled water in different weight ratios. Three concentrations (10%, 12%, and 14% w/w) were utilized in the experiments. Phantoms were made in the shape of cylinders with a thickness of approximately 3 mm. Three samples for each concentration were used in experiments for statistical purposes. The gelatin phantoms were assumed to be isotropic homogeneous elastic materials for the estimation of elasticity.
2.3. Experimental methods
A high-resolution analog pressure transducer (ATM 1ST, Process Measurement and Controls) was used to characterize the excitation pressure of the air-pulse system. The transducer output signal was monitored by an oscilloscope and the pressure values were calculated from the amplitude of signal. The signal noise was also assessed for the analysis of the results. The excitation pressure was measured with the change of (1) the air source pressure from 0 to ~414 kPa, (2) the angle of delivery from 0° to 90° relative to the transducer surface normal, and (3) the distance up to 20 mm between the tip of the port and the transducer membrane. During the measurement of any of these three variables, the other two variables were properly controlled in the experiments. Each reported value is the average of multiple measurements.
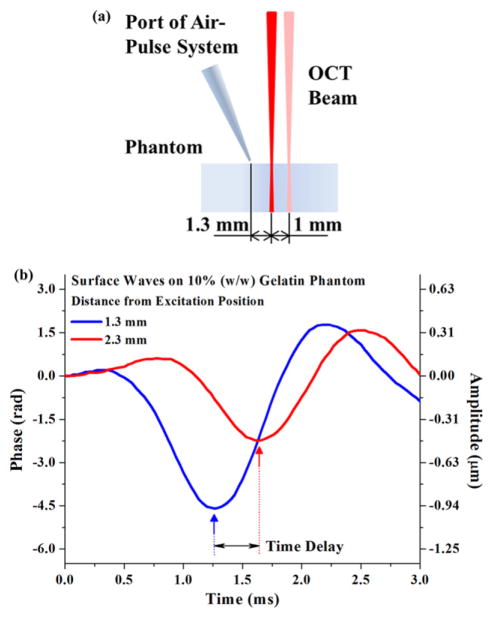
The excitation and measurement of SWs are illustrated in figure 3(a). During the experiments, the angle of the air stream direction to the phantom surface normal was ~34°, and the distance from the port tip to the phantom surface was ~200 μm. The pressure from the air source was kept as ~138 kPa. This setup produced a localized excitation pressure of ~12 Pa on the phantom surface. Two measurement points were used to record the time delay formed by the SWs propagating between these two positions, as shown in figure 3(b). M-mode imaging was performed over time at both measurement points and repeated three times for statistical purposes.
Figure 3.
(a) Illustration of the SW excitation and measurement positions on gelatin phantom; (b) typical SWs detected in 10% gelatin phantom measured 1 mm apart.
The group velocity of SWs was calculated as ratio of the 1 mm distance between the measurement points and the detected time delay. Young’s modulus (E) of gelatin phantoms can be quantified based on the SW group velocity (Cg) with the relationship approximated as [19]
where ν is Poisson’s ratio, and ρ is the mass density of the medium. In our calculations, we used ν = 0.5 and ρ = 1000 kg m−3 [20].
3. Results and discussion
3.1. Characterization of air-pulse excitation pressure
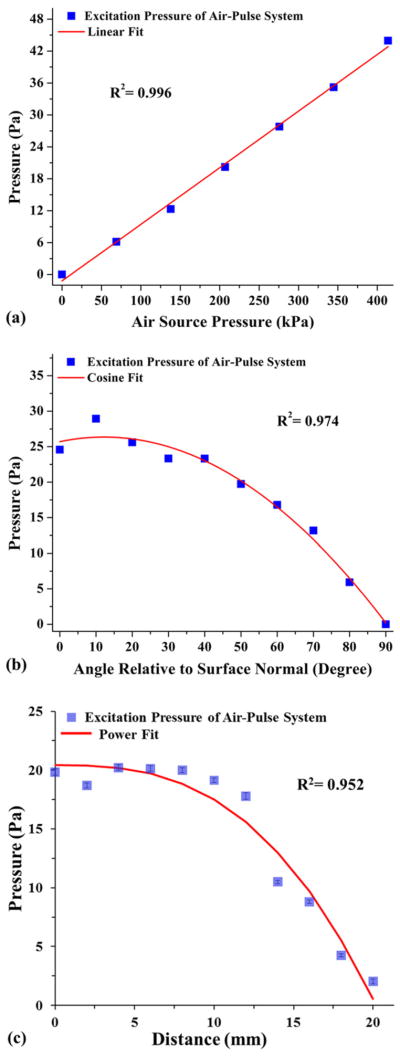
Figure 4 shows typical characterization results. The excitation pressure increases linearly with the increase of air source pressure, as shown in figure 4(a). The slope of the increase is calculated to be ~1.1 × 10⁻⁴. From figure 4(b), it can be seen that, as the excitation angle of incidence relative to the surface normal increases, the measured excitation pressure decreases with a cosine function. Figure 4(c) describes the effect of changing excitation distance on the excitation pressure. There is little decrease in the observed excitation pressure over the first 10 mm. The standard deviation of the pressure values is smaller than the standard deviation of the noise of the transducer signal, indicating that the excitation pressure remains stable over a distance of 10 mm. Over the next 10 mm, due to the dispersion of the air stream, the excitation pressure significantly decreases. These major characteristics of the excitation pressure demonstrate that the amplitude of the air-pulse-induced SWs in tissue can be well predicated and easy to control based on the air source pressure, angle of delivery and distance of excitation. As the magnitude of deformation plays an important role in affecting the delicate soft tissues, compared with other excitation methods [9–13], the focused air-pulse system can provide a safer and more rapid process for the adjustment to a proper amplitude of excitation under in vivo conditions.
Figure 4.
Relationship between the excitation pressure of the air-pulse system and (a) the air source pressure, (b) the angle of delivery relative to the transducer surface normal, and (c) the distance between the port tip and the transducer membrane.
3.2. Elasticity measurement of gelatin phantoms
The values of SW group velocity for gelatin phantoms of different concentrations are shown in figure 5. It is clear that higher velocity of SWs is observed in phantoms with higher concentration. Young’s moduli of the gelatin phantoms, calculated from the velocity values, are shown in figure 6 and table 1. It can be seen that, with the increase of gelatin concentration, Young’s moduli of the phantoms increase. The estimated elasticity agrees well with our previous results from the measurement of Young’s modulus using a uniaxial testing system [16]. The differences observed may be caused by the variations in the gelatin samples tested, e.g. concentration, hydration, etc. These results demonstrate that our focused air-pulse system can be combined with PhS-OCT to estimate the elasticity of the medium.
Figure 5.
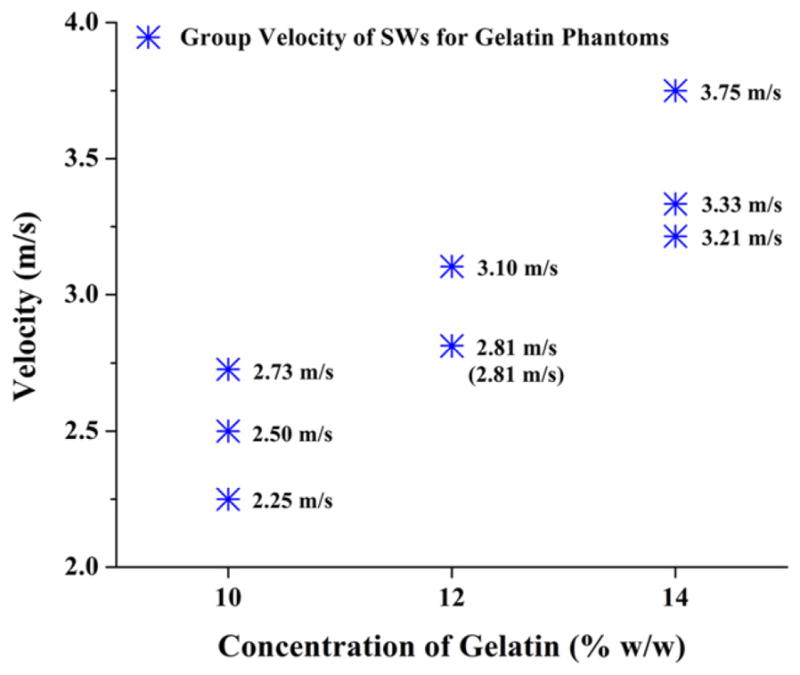
Group velocity values of SWs for gelatin phantoms of different concentrations; three samples were involved for each concentration and are represented by the stars.
Figure 6.
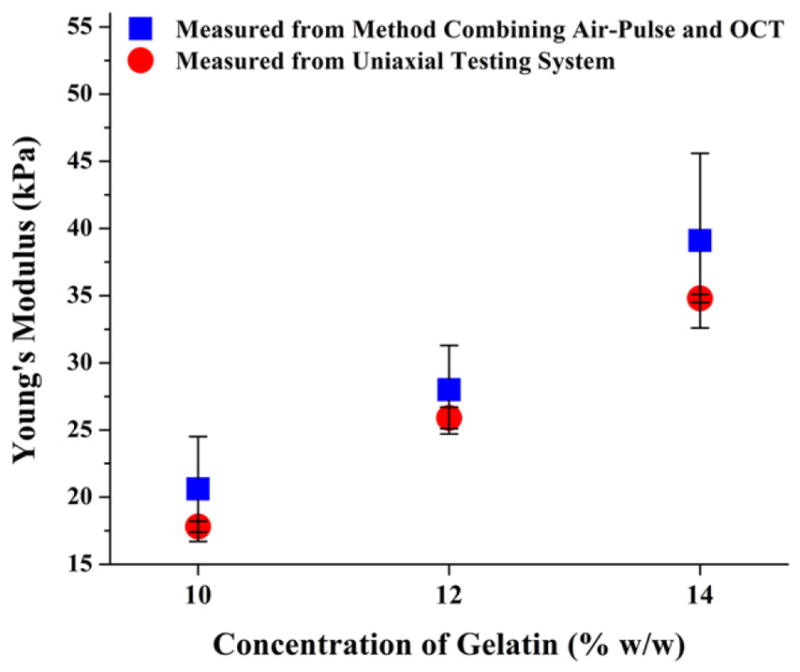
Estimated Young’s moduli for gelatin phantoms using the method combining the air-pulse system and PhS-OCT, n = 3; comparison with the results measured from uniaxial test [16].
Table 1.
Comparison between Young’s moduli of gelatin phantoms measured from method combining air-pulse and OCT and from uniaxial test.
| Concentration of gelatin (w/w) (%) | Young’s modulus, combining air-pulse and OCT (kPa) | Young’s modulus, uniaxial test [16] (kPa) |
|---|---|---|
| 10 | 20.6 ± 3.9 | 17.8 ± 0.4 |
| 12 | 28.0 ± 3.3 | 25.9 ± 0.8 |
| 14 | 39.1 ± 6.5 | 34.8 ± 0.3 |
The highest measurable Young modulus of this technique depends on the highest velocity of SWs the OCT system can resolve, which, for swept-source OCT (SSOCT), is limited by the scanning rate of the laser source. For our current system and experimental setup (30 kHz A-line rate and 1 mm distance between measurement points), the top SW velocity we can measure is approximately 30 m s−1. It has been reported that the A-line speed of an SSOCT system can reach over 100 kHz [21]. Future studies will extend the measurable range of elasticity by increasing SSOCT imaging speed.
Recently, we have demonstrated that the combination of an air-pulse system and PhS-OCT can be used to differentiate soft-tissue tumors from normal tissues based on the estimation of their elasticity [22]. The ease of stimulus control and benefits of a non-contact, non-invasive tissue excitation suggest that this approach provides a feasible method to study the biomechanical properties of cornea in vivo. Because the cornea is a laminar anisotropic material [23], the basic algorithm used here to quantify sample elasticity may not be applicable. We are developing more sophisticated reconstructive methods to quantify the elasticity of cornea that will take into account the anisotropy, laminar structure and surface geometry.
4. Conclusions
We have developed a focused air-pulse system that provides localized excitation of SWs in soft tissues with a low-pressure and short-duration air stream. Results of our experiments on tissue-mimicking gelatin phantoms indicate that the combination of this focused air-pulse system and PhS-OCT can be utilized to estimate Young’s modulus. The mechanical excitation with this non-contact, non-invasive and easy-to-control stimulus makes the technique potentially suitable to study the biomechanical properties of ocular and other tissues in vivo.
Acknowledgments
The authors would like to thank Dr Stepan A Baranov (Bioptigen) for the software support. This study was supported by NIH grant 1R01EY022362 and Federal Target Program ‘Scientific and Scientific–Pedagogical Personnel of Innovative Russia’ for 2009–13 grant 14.B37.21.1238.
References
- 1.Shah S, Laiquzzaman M, Bhojwani R, Mantry S, Cunliffe I. Assessment of the biomechanical properties of the cornea with the ocular response analyzer in normal and keratoconic eyes. Invest Ophthalmol Vis Sci. 2007;48:3026–31. doi: 10.1167/iovs.04-0694. [DOI] [PubMed] [Google Scholar]
- 2.Paszek MJ, et al. Tensional homeostasis and the malignant phenotype. Cancer Cell. 2005;8:241–54. doi: 10.1016/j.ccr.2005.08.010. [DOI] [PubMed] [Google Scholar]
- 3.Ophir J, Cespedes I, Garra B, Ponnekanti H, Huang Y, Maklad N. Elastography: ultrasonic imaging of tissue strain and elastic modulus in vivo. Eur J Ultrasound. 1996;3:49–70. [Google Scholar]
- 4.Sinkus R, Tanter M, Catheline S, Lorenzen J, Kuhl C, Sondermann E, Fink M. Imaging anisotropic and viscous properties of breast tissue by magnetic resonance-elastography. Magn Reson Med. 2005;53:372–87. doi: 10.1002/mrm.20355. [DOI] [PubMed] [Google Scholar]
- 5.Dimitriadis EK, Horkay F, Maresca J, Kachar B, Chadwick RS. Determination of elastic moduli of thin layers of soft material using the atomic force microscope. Biophys J. 2002;82:2798–810. doi: 10.1016/S0006-3495(02)75620-8. [DOI] [PMC free article] [PubMed] [Google Scholar]
- 6.Schmitt J. OCT elastography: imaging microscopic deformation andstrain of tissue. Opt Express. 1998;3:199–211. doi: 10.1364/oe.3.000199. [DOI] [PubMed] [Google Scholar]
- 7.Manapuram RK, Baranov SA, Manne VGR, Sudheendran N, Mashiatulla M, Aglyamov S, Emelianov S, Larin KV. Assessment of wave propagation on surfaces of crystalline lens with phase sensitive optical coherence tomography. Laser Phys Lett. 2011;8:164–8. [Google Scholar]
- 8.Wang RK, Kirkpatrick S, Hinds M. Phase-sensitive optical coherence elastography for mapping tissue microstrains in real time. Appl Phys Lett. 2007;90:164105. [Google Scholar]
- 9.Sun C, Standish B, Yang VXD. Optical coherence elastography: current status and future applications. J Biomed Opt. 2011;16:043001. doi: 10.1117/1.3560294. [DOI] [PubMed] [Google Scholar]
- 10.Liang X, Oldenburg AL, Crecea V, Chaney EJ, Boppart SA. Optical micro-scale mapping of dynamic biomechanical tissue properties. Opt Express. 2008;16:11052–65. doi: 10.1364/oe.16.011052. [DOI] [PMC free article] [PubMed] [Google Scholar]
- 11.Liang X, Orescanin M, Toohey K, Insana M, Boppart S. Acoustomotive optical coherence elastography for measuring material mechanical properties. Opt Lett. 2009;34:2894–6. doi: 10.1364/OL.34.002894. [DOI] [PMC free article] [PubMed] [Google Scholar]
- 12.Li C, Guan G, Reif R, Huang Z, Wang RK. Determining elastic properties of skin by measuring surface waves from an impulse mechanical stimulus using phase-sensitive optical coherence tomography. J R Soc Interface. 2012;9:831–41. doi: 10.1098/rsif.2011.0583. [DOI] [PMC free article] [PubMed] [Google Scholar]
- 13.Li C, Guan G, Huang Z, Johnstone M, Wang RK. Noncontact all-optical measurement of corneal elasticity. Opt Lett. 2012;37:1625–7. doi: 10.1364/OL.37.001625. [DOI] [PubMed] [Google Scholar]
- 14.Alonso-Caneiro D, Karnowski K, Kaluzny BJ, Kowalczyk A, Wojtkowski M. Assessment of corneal dynamics with high-speed swept source optical coherence tomography combined with an air puff system. Opt Express. 2011;19:14188–99. doi: 10.1364/OE.19.014188. [DOI] [PubMed] [Google Scholar]
- 15.Dorronsoro C, Pascual D, Pérez-Merino P, Kling S, Marcos S. Dynamic OCT measurement of corneal deformation by an air puff in normal and cross-linked corneas. Biomed Opt Express. 2012;3:473–87. doi: 10.1364/BOE.3.000473. [DOI] [PMC free article] [PubMed] [Google Scholar]
- 16.Manapuram R, Aglyamov S, Menodiado FM, Mashiatulla M, Wang S, Baranov SA, Li J, Emelianov S, Larin KV. Estimation of shear wave velocity in gelatin phantoms utilizing PhS-SSOCT. Laser Phys. 2012;22:1439–44. [Google Scholar]
- 17.Manapuram RK, Aglyamov SR, Monediado FM, Mashiatulla M, Li J, Emelianov SY, Larin KV. In vivo estimation of elastic wave parameters using phase-stabilized swept source optical coherence elastography. J Biomed Opt. 2012;17:100501. doi: 10.1117/1.JBO.17.10.100501. [DOI] [PMC free article] [PubMed] [Google Scholar]
- 18.Manapuram RK, Manne VGR, Larin KV. Development of phase-stabilized swept-source OCT for the ultrasensitive quantification of microbubbles. Laser Phys. 2008;18:1080–6. [Google Scholar]
- 19.Doyle JF. Wave Propagation in Structures: Spectral Analysis Using Fast Discrete Fourier Transform. New York: Springer-Verlag; 1997. [Google Scholar]
- 20.Zhang X, Qiang B, Greenleaf J. Comparison of the surface wave method and the indentation method for measuring the elasticity of gelatin phantoms of different concentrations. Ultrasonics. 2011;51:157–64. doi: 10.1016/j.ultras.2010.07.005. [DOI] [PMC free article] [PubMed] [Google Scholar]
- 21.Totsuka K, Isamoto K, Sakai T, Suzuki T, Morosawa A, Chong C. 140 kHz Optical Coherence Tomography Imaging by MEMS Scanner Based Swept Source Laser. Washington, DC: Optical Society of America; 2010. BTuD108p. [Google Scholar]
- 22.Wang S, Li J, Manapuram RK, Menodiado FM, Ingram DR, Twa MD, Lazar AJ, Lev DC, Pollock RE, Larin KV. Noncontact measurement of elasticity for the detection of soft-tissue tumors using phase-sensitive optical coherence tomography combined with a focused air-puff system. Opt Lett. 2012;37:5184–6. doi: 10.1364/OL.37.005184. [DOI] [PMC free article] [PubMed] [Google Scholar]
- 23.Li L-Y, Tighe B. The anisotropic material constitutive models for the human cornea. J Struct Biol. 2006;153:223–30. doi: 10.1016/j.jsb.2005.10.014. [DOI] [PubMed] [Google Scholar]


