

Abstract
Background
Auditory hallucinations, a hallmark symptom of psychosis, are experienced by most people with a diagnosis of schizophrenia at some point in their illness. Auditory hallucinations can be understood as a failure in predictive coding, whereby abnormalities in sensory/perceptual processing combine with biased cognitive processes to result in a dampening of normal prediction error signaling.
Method
In this paper, we used a roving mismatch negativity (MMN) paradigm to optimize evaluation of prediction error signaling and short-term neuroplasticity in 30 people with schizophrenia (n=16 with and n=14 without recent auditory hallucinations) and 20 healthy comparison participants.
Results
The recent hallucinations group exhibited an abnormal roving MMN profile [F(2,27)=3.98, p=0.03], significantly reduced prediction error signaling [t(28)=−2.25, p=0.03], and a trend for diminished short-term neuroplasticity [t(28)=1.80, p=0.08]. There were no statistically significant differences between the healthy comparison group and the combined schizophrenia group on any of the roving MMN indices.
Conclusions
These findings are consistent with a predictive coding account of hallucinations in schizophrenia, which posits reduced prediction error signaling in those who are prone to hallucinations. These results also suggest that plasticity-mediated formation and online updating of predictive coding models may also be disrupted in individuals with recent hallucinations.
1. Introduction
Hallucinations refer to a false perception in one or more of the sensory modalities that occur during wakefulness and in the absence of external stimulation. Auditory hallucinations are a hallmark symptom of psychosis and are experienced by at least 70% of individuals with a diagnosis of schizophrenia at some point in their illness (Bauer et al., 2011; Mueser, Bellack, & Brady, 1990). Various explanatory models of auditory hallucinations have been put forth, and these models vary in terms of their relative emphasis on sensory/perceptual processes versus cognitive processes, such as self-monitoring. For example, some suggest that abnormalities in basic perceptual processing contribute to hallucinatory experiences (McKay, 2000; Mclachlan, Phillips, Rossell, & Wilson, 2013). Individuals with schizophrenia show marked impairments on perception tasks (Hugdahl et al., 2012; Javitt, 2009a, 2009b). Consistent with the perceptual account, perceptual processing impairment has been associated with presence and severity of hallucinations (McKay, 2000; Mclachlan et al., 2013), and imaging studies provide evidence for abnormal activation of primary auditory cortex and regions involved in speech perception in individuals who experience auditory hallucinations (Kompus, Westerhausen, & Hugdahl, 2011) (Jardri, Pouchet, Pins, & Thomas, 2011). Further evidence can be gleaned from Kenneth Hugdahl’s seminal dichotic listening studies that demonstrate a reduction of the normal right ear advantage in people with persistent auditory hallucinations, indicating abnormalities in left hemisphere functioning including lateralization of speech and language perception (Green, Hugdahl, & Mitchell, 1994; Hugdahl et al., 2008, 2012; Ocklenburg, Westerhausen, Hirnstein, & Hugdahl, 2013).
Another account suggests that failures in self-monitoring may underlie hallucinatory experiences, such that self-generated actions (e.g., inner or sub-vocal speech) are erroneously attributed to an external source (Bentall, Baker, & Havers, 1991). The self-monitoring account is supported by reduced performance on source monitoring tasks in schizophrenia, particularly among individuals with hallucinations (Waters, Woodward, Allen, Aleman, & Sommer, 2012), as well as a tendency in schizophrenia to attribute causality of events to external sources (i.e., externalizing bias of attributional style) (Baker & Morrison, 1998).
One way to integrate perceptual and cognitive accounts of hallucinations is with a predictive coding framework. Predictive coding is a hierarchical information processing model which posits that bottom-up perceptual signals interact with higher-order cognitive processes in a dynamic, iterative fashion to generate expectations about the environment and to compare incoming stimuli with these expectations (Fletcher & Frith, 2009; Nazimek, Hunter, & Woodruff, 2012). According to this model, stimuli that match predictions are suppressed, whereas stimuli that are unexpected or discrepant with prior expectations trigger a mismatch signal, the “prediction error”. The prediction error serves as a signal that the prediction model has failed (e.g., the environment has changed) and requires updating in order to accommodate the discrepant stimuli (i.e., to minimize future prediction errors).
In individuals prone to hallucinations, it is hypothesized that perceptual processing abnormalities combine with biased or erroneous expectations about the environment and result in a dampening of prediction error signaling (Horga, Schatz, Abi-Dargham, & Peterson, 2014; Nazimek et al., 2012; Northoff & Qin, 2011). Incoming sensory input, which is attributable to excessive or aberrant sensory cortex activation rather than to external stimulation, is consistent with prior expectations and fails to trigger a normal prediction error signal. Thus, a false perception occurs because the sensory cortex erroneously anticipates a perceptual event. Nazimek and colleagues posit that, as a result of predictive coding failure “auditory hallucinations are sometimes interpreted by the sufferer as generated by an external agency not because they are misattributed in the first place, but because they have the acoustic qualities of real percepts.” (Nazimek et al., 2012, p.804)
Mismatch negativity (MMN) can be used to examine predictive coding. MMN is an event-related potential (ERP) component that occurs in response to an unexpected event in the context of a repeating stimulus train (Luck, 2005). ERPs to a repeated, high probability stimulus (i.e., the “standard”) are subtracted from ERPs to an unexpected, low probability stimulus (i.e., the “deviant”), yielding a difference wave. The MMN is a large negative deflection in the difference wave that peaks at about 100-250ms after stimulus onset, and it is maximal at frontocentral scalp sites (Garrido, Kilner, Stephan, & Friston, 2009; Luck, 2005; Todd, Harms, Schall, & Michie, 2013), reflecting generators in the prefrontal and primary auditory cortex (Frodl-Bauch, Kathmann, Möller, & Hegerl, 1997; Garrido, Kilner, Stephan, et al., 2009; Park et al., 2002). MMN can be elicited by a variety of stimuli; however, auditory MMN has been studied most extensively in schizophrenia (Zion-Golumbic et al., 2007).
In a typical auditory MMN paradigm, a sequence is presented to the subject that consists of repeated presentations of a standard tone that is occasionally interrupted by the presentation of a deviant tone that differs from the standard in some respect (e.g., pitch, intensity, duration). The MMN is hypothesized to reflect a prediction error signal: the properties of the deviant stimulus do not match the predictive model formed by the train of preceding standards, thus the model must be updated in order to improve predictive accuracy (Todd et al., 2013).
The auditory MMN paradigm can be optimized to evaluate prediction errors by manipulating the number of repetitions of the standard tone in a series, and also by not using the same standard and the deviant tones throughout the session (Baldeweg, 2007). This type of paradigm is called a “roving MMN”. In this modified MMN paradigm, a series of standards is presented, followed by a deviant, as in a typical MMN. However, the deviant tone is then presented repeatedly, becoming the new standard. This new standard sequence is subsequently interrupted by a new deviant, and the process repeats. The number of standard presentations in the sequence is varied throughout the task. As the number of standards in a row increases, the amplitude of the ERP becomes more positive (called “repetition positivity”). Repetition positivity is hypothesized to reflect stimulus-specific adaptation of neuronal activity to the standard stimulus, a form of short-term neuroplasticity (Baldeweg, 2007; Garrido, Kilner, Kiebel, et al., 2009; Garrido, Kilner, Stephan, et al., 2009). Likewise, response to the deviant and the resultant MMN becomes increasingly negative as the number of standards preceding it increases (Baldeweg, Klugman, Gruzelier, & Hirsch, 2004). This increase in MMN amplitude reflects the discrepancy between the expected tone and the actual tone, that is, the prediction error (Todd & Robinson, 2010). The increase in MMN with increasing number of standard tones is referred to as the memory trace effect (Baldeweg & Hirsch, 2015; Baldeweg et al., 2004; Todd et al., 2013). To our knowledge, no previous study has examined associations between prediction errors as measured by roving MMN and auditory hallucinations. A few studies have reported associations between indices from traditional MMN paradigms and hallucinations. For example, Fisher and colleagues report a significant reduction in MMN amplitude in schizophrenia participants with persistent auditory hallucinations compared to those without (Fisher, Labelle, & Knott, 2008), as well as associations between MMN amplitude and state and trait measures of hallucination severity (Fisher, Grant, et al., 2012; Fisher, Labelle, & Knott, 2012; Fisher, Smith, Labelle, & Knott, 2014).
The aim of this study was to use roving MMN to optimize evaluation of predictive coding in people with schizophrenia and healthy comparison participants, and to test whether predictive coding differs in schizophrenia participants with recent auditory hallucinations compared to those without. Given the well-documented MMN abnormalities in schizophrenia (Umbricht & Krljes, 2005), we hypothesized that the schizophrenia group would show reductions across various MMN indices, including MMN amplitude, repetition positivity, and the memory trace effect compared to the healthy comparison group. Furthermore, within the schizophrenia group, we predicted that the auditory hallucinations group would evidence greater abnormalities in the memory trace effect (reflecting prediction error signaling) compared to the no hallucinations group.
2. Method
2.1. Participants
Thirty individuals with a diagnosis of schizophrenia or schizoaffective disorder (depressed type) and twenty non-psychiatric controls participated in this study. The patient participants were recruited from local outpatient mental health clinics and board and care facilities, and the control participants were recruited from the community via newspaper and internet advertisements.
Inclusion criteria for the patient participants were: 1) a DSM-IV (American Psychiatric Association, 1994) diagnosis of schizophrenia or schizoaffective disorder, depressed subtype based on SCID-I/P interview (First & Gibbon, 2004), 2) age 18–60 years, and 3) clinical stability, as indicated by stable outpatient status and no antipsychotic medication changes in the month prior to testing. For the control participants, inclusion criteria were: 1) no history of a DSM-IV diagnosis of recurrent major depressive disorder, bipolar affective disorder, or schizophrenia-spectrum disorder (including schizoid, schizotypal, paranoid, and avoidant personality disorder), 2) no history of schizophrenia-spectrum disorder among first-degree relatives, and 3) age 18-60 years. Exclusion criteria for all participants were: 1) evidence of a neurological disorder or head injury resulting in loss of consciousness, and 2) current alcohol or substance abuse or dependence. Demographic and clinical characteristics for the sample can be found in Table 1.
Table 1.
Clinical and demographic information by group
| Sz-H (n=16) n (%) |
Sz-NH (n=14) n (%) |
HC (n=20) n (%) |
Sz vs. HC χ2 (df), p |
Sz-H vs. Sz-NH χ2 (df), p |
|
|---|---|---|---|---|---|
| Gender | 11 male (69%) | 7 male (50%) | 10 male (50.0%) | χ2(1)=0.49, p=0.49 | χ2(1)=1.09, p=0.30 |
| Hispanic ethnicity | 2 (12.5%) | 3 (21.4%) | 5 (25.0%) | χ2(1)=0.52, p=0.47 | χ2(1)=0.43, p=0.51 |
| Race | χ2(3)=7.03, p=0.07 | χ2(3)=2.42, p=0.49 | |||
| Caucasian | 6 (37.5%) | 8 (57.1%) | 11 (55.0%) | ||
| African American | 9 (56.3%) | 4 (28.6%) | 3 (15.0%) | ||
| Asian | 1 (6.2%) | 2 (14.3%) | 4 (20.0%) | ||
| Other | 0 (0.0%) | 0 (0.0%) | 2 (10.0%) | ||
| Mean (s.d.) | Mean (s.d.) | Mean (s.d.) | t (df), p | t (df), p | |
|
|
|||||
| Age (years) | 51.13 (10.23) | 47.29 (12.70) | 49.58 (8.99) | t(48)=0.08, p=0.93 | t(28)=0.92, p=0.37 |
| Personal education (years) | 13.13 (1.55) | 13.00 (1.78) | 14.70 (1.78) | t(48)=3.34, p<0.01 | t(28)=0.21, p=0.83 |
| Parental education (years) | 13.29 (3.95) | 12.75 (2.38) | 13.22 (3.99) | t(48)=0.12, p=0.90 | t(28)=0.45, p=0.66 |
| BPRS total | 50.50 (10.78) | 37.29 (7.08) | – | – | t(28)=3.90, p<0.01 |
| Positive symptoms factor | 2.89 (0.86) | 1.61 (0.51) | – | – | t(28)=4.86, p<0.01 |
| Negative symptoms factor | 2.29 (0.93) | 1.40 (0.42) | – | – | t(28)=3.29, p<0.01 |
| Agitation/Mania symptoms factor | 1.29 (0.55) | 1.35 (0.37) | – | – | t(28)=0.31, p=0.76 |
| Depressive/Anxious symptoms factor | 2.08 (0.87) | 1.54 (0.49) | – | – | t(28)=2.05, p=0.05 |
Note: Sz, schizophrenia group; Sz-H, hallucinations group; Sz-NH, no hallucinations group; HC, healthy comparison group.
Current (i.e., within the two week period prior to testing) psychiatric symptoms were assessed by trained raters with the 24-item Brief Psychiatric Rating Scale (BPRS) (Lukoff, Nuechterlein, & Ventura, 1986). Recent auditory hallucinations were indicated by a score of 4 or greater on the BPRS hallucinations item (i.e., clinically-significant hallucinatory experiences). Based on this cross-sectional assessment, sixteen of the patient participants were rated as experiencing recent auditory hallucinations (Sz-H), and 14 as not (Sz-NH). Based on the SCID interview, 11 of the 14 Sz-NH participants had experienced clinically-significant auditory hallucinations in the past.
Each clinical rater achieved a median Intraclass Correlation Coefficient (ICC) of 0.80 or higher across all BPRS and Role Functioning Scale (RFS) items compared with the criterion ratings and participated in a quality assurance program (Ventura, Green, Shaner, & Liberman, 1993). For the SCID, clinical raters demonstrated an overall kappa coefficient, kappa sensitivity, and kappa specificity of 0.75 or greater, and a diagnostic accuracy kappa coefficient of 0.85 or greater.
2.2. Procedures
2.2.1. Mismatch Negativity EEG Paradigm, Roving Version
This roving MMN paradigm consisted of five blocks (each block 5 min 17s in duration), each separated by a 30s break. Tones, varied between 700-1200 Hz, were presented binaurally to participants through insert earphones (ER-2, Etymotic Research, Inc., Elk Grove Village, IL) at 80 dB (5ms rise time) for 50 or 100ms, with an SOA of 400ms. Subjects were instructed to ignore the tones while they performed a distractor task and maintained visual fixation on a central cross on a computer screen. A total of 3,960 tone stimuli were presented over the course of the experiment. There were three possible stimuli sequences: a standard tone was presented in a series of 3, 8, or 33 repetitions followed by a deviant tone that differed from the standard in pitch (by 100Hz to 300Hz) and duration (50ms or 100ms). The deviant tone was then presented in a series of 3, 8, or 33 repetitions, effectively becoming the new standard in the series. The number of repetitions of the standard in a series (i.e., 3, 8, or 33) was randomly alternated over the course of each block. Across the five blocks, there were a total of 270 trials for the 3rd repetition of the standard (i.e., Standard3), 180 trials for Standard8, and 90 trials for Standard33. There were 90 trials for deviants in each of the three sequence conditions (i.e., Deviant3, Deviant8, Deviant33).
Average amplitudes between 100-200ms to the standards, deviants, and the difference between the two were measured at electrode Fz. Response to the standards were calculated for each of the three sequence conditions: mean amplitude to the 3rd standard (i.e., Standard3), the 8th standard (i.e., Standard8), and the 33rd standard (i.e., Standard33) in the sequence. Likewise, response to the deviants were calculated as the mean amplitude to the deviant presented after the 3rd standard (i.e., Deviant3), after the 8th standard (i.e., standard (i.e., Deviant8), and the 33rd Deviant33). The MMN difference wave for each sequence condition was calculated by subtracting the response to the standard from the response to the deviant (e.g., MMN3 = Deviant3 – Standard3). Repetition positivity, the index of short-term neuroplasticity, was calculated as the change in amplitude to the standard tone across the three sequence conditions (i.e., Standard33 – Standard3). A similar method was used to calculate the memory trace, the prediction error signaling index (i.e., MMN33 – MMN3) (Baldeweg & Hirsch, 2015; Baldeweg et al., 2004).
To direct attention away from the auditory stimuli, we employed a distractor task that involved discrimination of tactile vibration patterns. In each MMN block, a gamepad, which was equipped with a vibration motor (Sony Play Station 3 Dual Shock® controller), emitted three different vibration patterns in a pseudorandom sequence. Two of the vibration patterns occurred with a high probability, and another occurred with a low probability. Subjects were instructed to hold the gamepad and to press a button following presentation of the low-probability target vibration pattern.
EEG was recorded using a BioSemi ActiveTwo system (BioSemi B.V., Amsterdam, Netherlands) with sintered Ag/AgCl active electrodes and 64 channel electrode caps. Two electrodes, placed above and below the left eye, were used to measure vertical electrooculography, and two electrodes, placed at the outer canthus of each eye, were used to measure horizontal electrooculography. Additional electrodes were placed on the left and right mastoid, and on the tip of the nose. Each active electrode was measured online with respect to a common mode sense electrode during data collection, forming a monopolar channel. Data were re-referenced offline to linked mastoids. Continuously recorded EEG was digitized at 1024 Hz and subsequently processed offline. Ocular correction was performed on continuous data using Gratton et al.’s regression algorithm (Gratton, Coles, & Donchin, 1983). Stimulus-locked epochs (500ms) were baseline corrected (100ms), filtered between 0.5-20 Hz, and then artifact rejection was performed (±70μV). Trials were averaged to derive the ERP waveforms.
2.2.2. Perception and Cognition
2.2.2.1. Tone Matching Test
Auditory perception was assessed using a performance-based tone matching task(Leitman et al., 2010). The task consisted of 100ms tones in series, with a 500 ms inter-tone interval. Auditory stimuli were presented using earphones at an intensity of 75 dB in a quiet testing room. For each tone pair, the tones were either identical or differed in frequency by specified amounts in each block (2.5%, 5%, 10%, 20%, or 50% difference; range 400Hz to 3000Hz). In each block, half of the tone pairs were identical and half were dissimilar. Subject were asked to press a key on a computer keyboard to indicate whether the pitch was the same or different for the tone pair. Tones were presented over five blocks, each containing 26 pairs of tones. The variable of interest for this task was total accuracy across all blocks.
2.2.1.2. MATRICS Consensus Cognitive Battery
Performance across seven cognitive domains were assessed using the MATRICS Consensus Cognitive Battery (MCCB) (Nuechterlein & Green, 2006). The domains assessed include: speed of processing, attention/vigilance, working memory, visual learning, verbal learning, reasoning and problem solving, and social cognition. Raw scores for each MCCB test were converted to age- and gender-corrected T-scores using the MCCB scoring program (mean=50, s.d.=10). The variable of interest was the overall composite score.
2.3.3. Community Functioning
Community functioning in the schizophrenia participants was assessed with the Role Functioning Scale (RFS) (Goodman, Sewell, Cooley, & Leavitt, 1993). Trained raters assigned scores for four subscales (work, independent living, family relations, and social functioning) based on a semi-structured interview with the participant. Ratings for each subscale range from 1 (severely impaired functioning) to 7 (optimal functioning), yielding a total score ranging from 4-28. Anchors describe the quality and quantity of functioning for each point.
2.4. Data analysis plan
The groups were compared on the demographic, clinical, cognitive, and variables using χ2 and independent sample t-tests. The primary auditory processing variables were MMN amplitude (i.e., MMN3, MMN8, MMN33), repetition positivity (i.e., Standard33-Standard3), the memory trace effect (i.e., MMN33-MMN3), and tone matching test performance (i.e., TMT total score). MMN amplitude across the three sequence conditions was examined using repeated measures ANOVA. The remaining auditory processing variables were examined with independent sample t-tests. For all analyses, we conducted an initial set of tests that compared the Sz and HC groups, followed by a second set of tests that compared the Sz-H and Sz-NH groups.
3. Results
Descriptive data for the demographic, clinical, and study variables are presented in Tables 1 and 2. The three groups were well matched on demographic variables such as age, gender, race, ethnicity, and parental education. As is typical in studies of schizophrenia, the level of personal education was lower in the Sz group compared to the HC group. The index of general cognitive performance, the MCCB overall composite score, was significantly lower in the Sz group compared to HC. However, there was no significant difference in MCCB performance between the Sz-H and Sz-NH groups. Compared to the Sz-NH group, the Sz-H group exhibited more severe levels of psychiatric symptoms and poorer role functioning in the work domain.
Table 2.
Descriptive statistics
| Sz-H (n=16) |
Sz-NH (n=14) |
HC (n=18) |
Sz vs. HC | Sz-H vs. Sz-NH | |
|---|---|---|---|---|---|
| Mean (s.d.) | Mean (s.d.) | Mean (s.d.) | F or t (df), p | F or t (df), p | |
| MMN3 | −0.93 (1.65) | 0.49 (1.86) | −0.43 (0.84) | ||
| MMN8 | −0.33 (1.90) | −0.91 (1.29) | −0.41 (1.04) | ||
| MMN33 | −1.09 (2.26) | −2.13 (2.61) | −2.68 (1.50) | ||
| Effect of sequence condition: F(2,45)=15.27, p<0.001 |
Effect of sequence condition: F(2,27)=3.41, p=0.05 |
||||
| Effect of group: F(1,46)=4.30, p=0.31 |
Effect of group: F(1,28)=0.02, p=0.90 |
||||
| Group x sequence condition: F(2,45)=2.65, p=0.08 |
Group x sequence condition: F(2,27)=3.98, p=0.03 |
||||
| Repetition positivity | 0.27 (1.83) | 1.39 (1.55) | 1.09 (1.18) | t(46)=0.63, p=0.53 | t(28)=1.80, p=0.08 |
| Memory trace effect | −0.16 (2.77) | −2.62 (3.23) | −2.25 (1.84) | t(46)=-1.13, p=0.26 | t(28)=-2.25, p=0.03 |
| Tone Matching Test | 104.00 (13.14) | 96.00 (19.18) | 107.35 (14.91) | t(48)=1.55, p=0.13 | t(28)=-1.35, p=0.19 |
| MCCB OCS | 35.38 (12.63) | 38.29 (16.60) | 47.05 (14.70) | t(46)=2.47, p=0.02 | t(28)=0.54, p=0.59 |
| RFS Work | 2.38 (1.54) | 3.50 (1.65) | – | – | t(28)=1.90, p=0.07 |
| RFS Independent Living | 4.44 (1.62) | 4.57 (1.74) | – | – | t(28)=0.22, p=0.83 |
| RFS Family | 5.25 (1.39) | 4.71 (1.94) | – | – | t(28)=-0.87 p=0.39 |
| RFS Social | 3.94 (1.89) | 4.50 (1.34) | – | – | t(28)=0.91, p=0.37 |
| RFS Total score | 16.00 (1.54) | 17.29 (4.60) | – | – | t(28)=0.80, p=0.43 |
Note: Sz-H, hallucinations group; Sz-NH, no hallucinations group; HC, healthy comparison group; MMN, mismatch negativity; MCCB OCS, MATRICS Consensus Cognitive Battery overall composite score; RFS, Role Functioning Scale.
Two HC participants were missing MMN data due to excessive artifacts. Grand averaged MMN waveforms and topographic maps across the three sequence conditions for each group are presented in Figure 1. Average ERPs to the standard and deviants across the three sequence conditions for each group are presented in Figure 2. For the schizophrenia group, the mean number of included trials after artifact rejection were 223.47 (s.d.=39.92) for Standard3, 149.87 (s.d.=26.07) for Standard8, 74.47 (s.d.=13.19) for Standard33, 73.60 (s.d.=13.22) for Deviant3, 71.67 (s.d.=14.05) for Deviant8, and 73.60 (s.d.=13.73) for Deviant33. For the healthy comparison sample, the mean number of included trials after artifact rejection were 246.22 (s.d.=13.09) for Standard3, 162.78 (s.d.=9.97) for Standard8, 82.06 (s.d.=4.05) for Standard33, 81.28 (s.d.=4.91) for Deviant3, 78.67 (s.d.=4.97) for Deviant8, and 80.33 (s.d.=4.93) for Deviant33. n the healthy comparison group, MMN amplitude significantly differed from zero in the MMN3 and MMN33 sequence conditions [t’s<−2.12, p’s<0.05; Cohen’s d=0.50 and 1.79 respectively], and there was a trend-level difference for MMN8 [t=−1.17; p=0.11; Cohen’s d=0.39]. In the schizophrenia group, MMN amplitude differed from zero in the MMN8 and MMN33 sequence conditions [t’s<−2.01, p’s<0.05, Cohen’s d=0.37 and 0.67 respectively], but not for MMN3 [t=−0.78, p=0.44, Cohen’s d=0.14].
Figure 1.
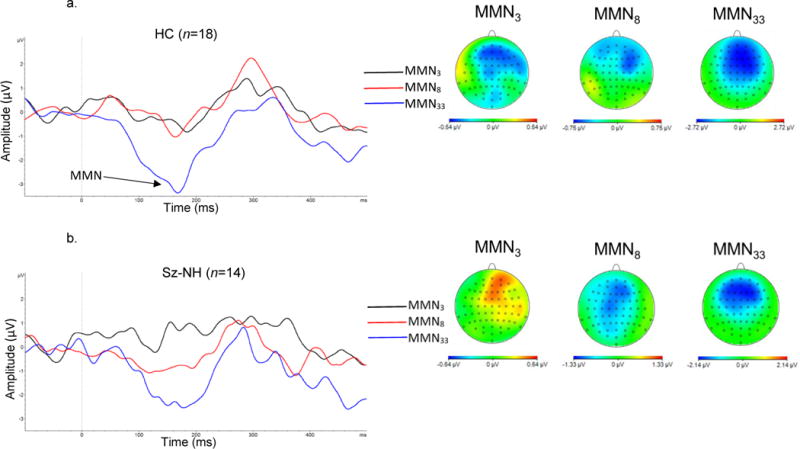

MMN mean amplitude (electrode Fz) and topographic maps for a) healthy comparison subjects (HC), b) schizophrenia – hallucinations group (Sz-NH), and c) schizophrenia – no hallucinations group (Sz-H).
Figure 2.


Mean amplitude and 95%CI to standard and deviant tones in a) healthy comparison subjects (HC), b) schizophrenia – hallucinations group (Sz-NH), and c) schizophrenia – no hallucinations group (Sz-H).
A 3 (sequence condition) × 2 (group) RM ANOVA was conducted to compare MMN amplitude across the three sequence conditions in the Sz and HC groups. This analysis revealed a main effect of sequence condition [F(2,45)=15.27, p<0.001, partial η2=0.40]. Follow-up paired t-tests indicated MMN33 amplitude was significantly greater than MMN3 amplitude [mean difference=1.66, s.d.=1.90, 95%CI: 0.40, 0.85, t(47)=4.14, p<0.001] and MMN8 amplitude [mean difference=1.46, s.e.=0.29, 95%CI: 0.87, 2.05, t(47)=4.98, p<0.001]. A trend for a group × sequence condition interaction effect [F(2,45)=2.65, p=0.08, partial η2=0.11] was also evident. This effect was attributable to the tendency for greater MMN33 amplitude in HC compared to Sz [mean difference=−1.10, s.e.=0.64, 95%CI: −2.39, 0.19, t(46)= −1.72, p=0.09]. The main effect of group was not significant [F(1,46)=4.30, p=0.31, partial η2=0.02].
A second 3 (sequence condition) × 2 (group) RM ANOVA was carried out to compare MMN amplitude in the Sz-H and Sz-NH groups. As above, this analysis revealed a main effect of sequence condition [F(2,27)=3.41, p=0.05, partial η2=0.20], where MMN33 amplitude was significantly greater than MMN3 amplitude [mean difference=1.31, s.e.=0.58, 95%CI: 0.12, 2.50, t(29)=2.25, p=0.03] and MMN8 amplitude [mean difference=0.98, s.e.=0.40, 95%CI: 0.16, 1.79, t(29)=2.44, p=0.02]. In addition, there was a significant group by sequence condition interaction [F(2,27)=3.98, p=0.03, partial η2=0.23]. The Sz-NH group evidenced a linear increase in MMN amplitude across the three sequence conditions [F(1,13)=9.23, p=0.01, partial η2=0.42]. In contrast, the Sz-H group showed no statistically significant difference in MMN amplitude across the three sequence conditions [F(2,14)=1.71, p=0.22, partial η2=0.20]. The main effect of group was not significant [F(1,28)=0.02, p=0.90, partial η2=0.001].
Next, we compared repetition positivity, the index of short-term plasticity, across groups. There was no statistically significant difference between the Sz and HC [mean difference=0.29, s.e.=0.47, 95%CI: −0.65, 1.24, t(46)=0.63, p=0.53]. However, within the Sz group there was a tendency for reduced short-term plasticity in Sz-H compared to Sz-NH [mean difference=1.12, s.e.=0.62, 95%CI: −0.16, 2.40, t(28)=1.80, p=0.08]. Similarly, the memory trace effect, the prediction error signaling index, did not significantly differ between Sz and HC [mean difference=−0.94, s.e.=0.83, 95%CI: −2.60, 0.73, t(46)= −1.13, p=0.26]. However, within the Sz group, prediction error signaling was significantly reduced in Sz-H compared to Sz-NH [mean difference=−2.46, s.e.=1.10, 95%CI: −4.71, −0.22, t(28)= −2.25, p=0.03].
Auditory perception, as assessed by the tone matching test, did not significantly differ between Sz and HC [mean difference=7.08, s.e.=4.58, 95%CI: −2.12, 16.29, t(48)=1.55, p=0.13]. Further, it did not significantly differ between Sz-H and Sz-NH [mean difference=−8.00, s.e.=6.09, 95%CI: −20.61, 4.61, t(28)= −1.35, p=0.19].
As mentioned, the Sz-H group differed from the Sz-NH on severity of psychiatric symptoms and on one aspect of role functioning (RFS work). However, within the Sz group BPRS total score and the RFS work score were not significantly correlated with repetition positivity [r’s<|0.14|, p’s>0.46] or the memory trace effect [r’s<|0.12|, p’s>0.54]. Moreover, when BPRS total score and RFS work were included as covariates in analyses comparing the Sz-H and Sz-NH groups, the results did not appreciably change1.
4. Discussion
In this study, we utilized a roving MMN paradigm to investigate prediction error signaling and short-term plasticity in adults with schizophrenia (with and without recent auditory hallucinations) and those without mental illness. Consistent with predictions, the presence of recent clinically-significant auditory hallucinations was associated with an abnormal roving MMN profile. Compared to non-hallucinators, hallucinators failed to show a normal linear increase in negativity across the three sequence conditions. The hallucinations group also showed reduced prediction error signaling, as indicated by a diminished memory trace effect. There was also a tendency for lessened short-term plasticity in the hallucinations group, as indicated by reduced repetition positivity to the standard stimuli. Contrary to predictions, no statistically significant differences were observed between the combined schizophrenia group and the healthy adults on roving MMN amplitude across the three sequence conditions, or for the prediction error signaling and short-term plasticity indices.
In our analyses, we considered and ruled-out potential alternative explanations for the finding between hallucinating and non-hallucinating patients on the roving MMN indices. The hallucinations group had more symptoms and lower occupational functioning, suggesting greater severity of illness. However, the differences between the hallucinations and no hallucinations groups on the roving MMN indices were not explained by these variables. The correlations between various roving MMN indices and symptom ratings and occupational functioning were low, and the findings did not change when these two variables were included as covariates. Moreover, the findings are unlikely to reflect a generalized cognitive deficit, as the two schizophrenia groups did not significantly differ on the MCCB overall composite score. Likewise, abnormal MMN performance in the hallucinations group cannot be attributed to impairment in pitch discrimination ability, as tone matching performance did not significantly differ across the patient groups – in fact, the hallucinations group had slightly better tone matching performance than the no hallucinations group.
These findings are consistent with the predictive coding account of auditory hallucinations in schizophrenia. This account posits that sensory and perceptual processing abnormalities interact with biased expectations about the environment, resulting in a dampening of normal prediction error signaling and an increased likelihood of experiencing a false perception (Horga, Schatz, Abi-Dargham, & Peterson, 2014; Nazimek et al., 2012; Northoff & Qin, 2011). In this study, the subgroup of patients with clinically-significant recent auditory hallucinations exhibited significantly reduced prediction error signaling compared to those without recent auditory hallucinations. Our analyses also suggest a trend for reduced short-term neuroplasticity in the recent hallucinations group. These results suggest that, beyond diminished prediction error signaling, plasticity-mediated formation and online updating of predictive coding models may be disrupted in individuals with recent hallucinations.
Notably, nearly all the patient participants in the no hallucinations group had experienced clinically-significant hallucinations at some point during their illness course, but not recently. Thus, the observed associations between auditory hallucinations, prediction error signaling, and short-term neuroplasticity do not reflect long-term stable factors (e.g., a trait-like vulnerability for hallucinations). Longitudinal research investigating the temporal associations between the roving MMN indices and state changes in hallucinatory experiences (e.g., recurrence vs. remittance of hallucinations, changes in severity of hallucinations over time) could answer questions surrounding short- vs. long-term stability of the effects more directly.
In this roving paradigm, markedly diminished amplitude was observed in the MMN3 and MMN8 sequence conditions compared to MMN33. This pattern was observed in both the schizophrenia sample and the healthy comparison group. This suggests that the expectancy for the standard was not fully established after 3 or 8 presentations, whereas violations of the predictive coding model when the expectation was well-established (i.e., after 33 presentations of the standard) yielded a large prediction error response.
Although reduced amplitude of the MMN in schizophrenia is a well-established finding that we failed to replicate in this study (Umbricht & Krljes, 2005), it is possible that this is related to the parameters of the modified paradigm. For example, MMN amplitude might be somewhat diminished in the roving paradigm due to a smaller number of standard repetitions in some sequence conditions compared to the number of standard repetitions in a traditional MMN paradigm. Moreover, in a traditional MMN paradigm, the standard stimulus remains the same throughout the session, whereas the standard is constantly changing in a roving paradigm. In addition, relatively small sample sizes may have limited our power to detect patient-control differences. The results of this study suggest that assessment of the presence and severity of recent hallucinations is an important consideration for future studies utilizing this modified MMN paradigm in clinical research.
In conclusion, using an optimized MMN paradigm (i.e., roving MMN) to investigate predictive coding, we observed an abnormal performance profile and diminished prediction error signaling in individuals with a diagnosis of schizophrenia with recent hallucinations compared to those without. In addition, there was a tendency for reduced short-term neuroplasticity in the hallucinations group compared to the no hallucinations group. These results are consistent with a predictive coding account of hallucinations in schizophrenia.
Footnotes
MMN RM ANCOVA sequence (MMN3, MMN8, MMN33) × group (Sz-H, Sz-NH) interaction: F(2,25)=4.09, p=0.03, partial η2=0.25. Repetition positivity ANCOVA effect of group (Sz-H, Sz-NH): F(1,26)=4.04, p=0.06, partial η2=0.13. Memory trace ANCOVA effect of group (Sz-H, Sz-NH): F(1,26)=5.36, p=.03, partial η2=0.17.
References
- American Psychiatric Association. Diagnostic and statistical manual of mental disorders. 4th. Washington, DC: American Psychiatric Association; 1994. (DSM-IV) [Google Scholar]
- Baker CA, Morrison AP. Cognitive processes in auditory hallucinations: attributional biases and metacognition. Psychological Medicine. 1998;28(5):1199–208. doi: 10.1017/s0033291798007314. [DOI] [PubMed] [Google Scholar]
- Baldeweg T. ERP Repetition Effects and Mismatch Negativity Generation A Predictive Coding Perspective. ERP Repetition Ef Fects and Mismatch Negativity Generation Journal of Psychophysiology. 2007;21 http://doi.org/10.1027/0269-8803.21.34.204. [Google Scholar]
- Baldeweg T, Hirsch SR. Mismatch negativity indexes illness-specific impairments of cortical plasticity in schizophrenia: a comparison with bipolar disorder and Alzheimer’s disease. International Journal of Psychophysiology. 2015;95(2):145–155. doi: 10.1016/j.ijpsycho.2014.03.008. http://doi.org/10.1016/j.ijpsycho.2014.03.008. [DOI] [PubMed] [Google Scholar]
- Baldeweg T, Klugman A, Gruzelier J, Hirsch SR. Mismatch negativity potentials and cognitive impairment in schizophrenia. Schizophrenia Research. 2004;69(2–3):203–217. doi: 10.1016/j.schres.2003.09.009. http://doi.org/10.1016/j.schres.2003.09.009. [DOI] [PubMed] [Google Scholar]
- Bauer SM, Schanda H, Karakula H, Olajossy-Hilkesberger L, Rudaleviciene P, Okribelashvili N, Stompe T. Culture and the prevalence of hallucinations in schizophrenia. Comprehensive Psychiatry. 2011;52(3):319–25. doi: 10.1016/j.comppsych.2010.06.008. http://doi.org/10.1016/j.comppsych.2010.06.008. [DOI] [PubMed] [Google Scholar]
- Bentall RP, Baker GA, Havers S. Reality monitoring and psychotic hallucinations. British Journal of Clinical Psychology. 1991;30(3):213–222. doi: 10.1111/j.2044-8260.1991.tb00939.x. http://doi.org/10.1111/j.2044-8260.1991.tb00939.x. [DOI] [PubMed] [Google Scholar]
- First M, Gibbon M. The Structured Clinical Interview for DSM-IV Axis I Disorders (SCID-I) and the Structured Clinical Interview for DSM-IV Axis II Disorders (SCID-II) 2004 [Google Scholar]
- Fisher DJ, Grant B, Smith DM, Borracci G, Labelle A, Knott VJ. Nicotine and the hallucinating brain: Effects on mismatch negativity (MMN) in schizophrenia. Psychiatry Research. 2012;196(2–3):181–187. doi: 10.1016/j.psychres.2012.01.026. http://doi.org/10.1016/j.psychres.2012.01.026. [DOI] [PubMed] [Google Scholar]
- Fisher DJ, Labelle A, Knott VJ. The right profile: Mismatch negativity in schizophrenia with and without auditory hallucinations as measured by a multi-feature paradigm. Clinical Neurophysiology. 2008;119(4):909–921. doi: 10.1016/j.clinph.2007.12.005. http://doi.org/10.1016/j.clinph.2007.12.005. [DOI] [PubMed] [Google Scholar]
- Fisher DJ, Labelle A, Knott VJ. Alterations of mismatch negativity (MMN) in schizophrenia patients with auditory hallucinations experiencing acute exacerbation of illness. Schizophrenia Research. 2012;139(1–3):237–245. doi: 10.1016/j.schres.2012.06.004. http://doi.org/10.1016/j.schres.2012.06.004. [DOI] [PubMed] [Google Scholar]
- Fisher DJ, Smith DM, Labelle A, Knott VJ. Attenuation of mismatch negativity (MMN) and novelty P300 in schizophrenia patients with auditory hallucinations experiencing acute exacerbation of illness. Biological Psychology. 2014;100(1):43–49. doi: 10.1016/j.biopsycho.2014.05.005. http://doi.org/10.1016/j.biopsycho.2014.05.005. [DOI] [PubMed] [Google Scholar]
- Fletcher PC, Frith CD. Perceiving is believing: a Bayesian approach to explaining the positive symptoms of schizophrenia. Nature Reviews Neuroscience. 2009;10(1):48–58. doi: 10.1038/nrn2536. http://doi.org/10.1038/nrn2536. [DOI] [PubMed] [Google Scholar]
- Frodl-Bauch T, Kathmann N, Möller HJ, Hegerl U. Dipole localization and test-retest reliability of frequency and duration mismatch negativity generator processes. Brain Topography. 1997;10(1):3–8. doi: 10.1023/a:1022214905452. [DOI] [PubMed] [Google Scholar]
- Garrido MI, Kilner JM, Kiebel SJ, Stephan KE, Baldeweg T, Friston KJ. Repetition suppression and plasticity in the human brain. NeuroImage. 2009;48(1):269–79. doi: 10.1016/j.neuroimage.2009.06.034. http://doi.org/10.1016/j.neuroimage.2009.06.034. [DOI] [PMC free article] [PubMed] [Google Scholar]
- Garrido MI, Kilner JM, Stephan KE, Friston KJ. The mismatch negativity: a review of underlying mechanisms. Clinical Neurophysiology : Official Journal of the International Federation of Clinical Neurophysiology. 2009;120(3):453–63. doi: 10.1016/j.clinph.2008.11.029. http://doi.org/10.1016/j.clinph.2008.11.029. [DOI] [PMC free article] [PubMed] [Google Scholar]
- Goodman SH, Sewell DR, Cooley EL, Leavitt N. Assessing levels of adaptive functioning: the Role Functioning Scale. Community Mental Health Journal. 1993;29(2):119–131. doi: 10.1007/BF00756338. [DOI] [PubMed] [Google Scholar]
- Green MF, Hugdahl K, Mitchell S. Dichotic listening during auditory hallucinations in patients with schizophrenia. American Journal of Psychiatry. 1994;151(3):357–362. doi: 10.1176/ajp.151.3.357. http://doi.org/10.1176/ajp.151.3.357. [DOI] [PubMed] [Google Scholar]
- Horga G, Schatz KC, Abi-Dargham A, Peterson BS. Deficits in Predictive Coding Underlie Hallucinations in Schizophrenia. Journal of Neuroscience. 2014;34(24):8072–8082. doi: 10.1523/JNEUROSCI.0200-14.2014. http://doi.org/10.1523/JNEUROSCI.0200-14.2014. [DOI] [PMC free article] [PubMed] [Google Scholar]
- Hugdahl K, Løberg EM, Jørgensen Ha, Lundervold A, Lund A, Green MF, Rund BB. Left hemisphere lateralisation of auditory hallucinations in schizophrenia: a dichotic listening study. Cognitive Neuropsychiatry. 2008;13(2):166–79. doi: 10.1080/13546800801906808. http://doi.org/10.1080/13546800801906808. [DOI] [PubMed] [Google Scholar]
- Hugdahl K, Løberg EMM, Falkenberg LE, Johnsen E, Kompus K, Kroken RA, Özgören M. Auditory verbal hallucinations in schizophrenia as aberrant lateralized speech perception: Evidence from dichotic listening. Schizophrenia Research. 2012;140(1–3):59–64. doi: 10.1016/j.schres.2012.06.019. http://doi.org/10.1016/j.schres.2012.06.019. [DOI] [PubMed] [Google Scholar]
- Jardri R, Pouchet A, Pins D, Thomas P. Cortical Activations During Auditory Verbal Hallucinations in Schizophrenia: A Coordinate-Based Meta-Analysis. American Journal of Psychiatry. 2011;168(1):73–81. doi: 10.1176/appi.ajp.2010.09101522. http://doi.org/10.1176/appi.ajp.2010.09101522. [DOI] [PubMed] [Google Scholar]
- Javitt DC. Sensory Processing in Schizophrenia: Neither Simple nor Intact. Schizophrenia Bulletin. 2009a;35(6):1059–1064. doi: 10.1093/schbul/sbp110. http://doi.org/10.1093/schbul/sbp110. [DOI] [PMC free article] [PubMed] [Google Scholar]
- Javitt DC. When Doors of Perception Close: Bottom-up Models of Disrupted Cognition in Schizophrenia. Annual Review of Clinical Psychology. 2009b;5(1):249–275. doi: 10.1146/annurev.clinpsy.032408.153502. http://doi.org/10.1146/annurev.clinpsy.032408.153502. [DOI] [PMC free article] [PubMed] [Google Scholar]
- Kompus K, Westerhausen R, Hugdahl K. The “paradoxical” engagement of the primary auditory cortex in patients with auditory verbal hallucinations: A meta-analysis of functional neuroimaging studies. Neuropsychologia. 2011;49(12):3361–3369. doi: 10.1016/j.neuropsychologia.2011.08.010. http://doi.org/10.1016/j.neuropsychologia.2011.08.010. [DOI] [PubMed] [Google Scholar]
- Leitman DI, Laukka P, Juslin PN, Saccente E, Butler P, Javitt DC. Getting the cue: sensory contributions to auditory emotion recognition impairments in schizophrenia. Schizophrenia Bulletin. 2010;36(3):545–56. doi: 10.1093/schbul/sbn115. http://doi.org/10.1093/schbul/sbn115. [DOI] [PMC free article] [PubMed] [Google Scholar]
- Luck SJ, Steven J. An introduction to the event-related potential technique 2005 [Google Scholar]
- Lukoff D, Nuechterlein KH, Ventura J. Manual for the expanded brief psychiatric rating scale. Schizophrenia Bulletin. 1986;12(4):594–602. [Google Scholar]
- McKay CM. Central Auditory Processing in Patients With Auditory Hallucinations. American Journal of Psychiatry. 2000;157(5):759–766. doi: 10.1176/appi.ajp.157.5.759. http://doi.org/10.1176/appi.ajp.157.5.759. [DOI] [PubMed] [Google Scholar]
- Mclachlan NM, Phillips DS, Rossell SL, Wilson SJ. Auditory processing and hallucinations in schizophrenia. 2013 doi: 10.1016/j.schres.2013.08.039. http://doi.org/10.1016/j.schres.2013.08.039. [DOI] [PubMed]
- Mueser KT, Bellack AS, Brady EU. Hallucinations in schizophrenia. Acta Psychiatrica Scandinavica. 1990;82(1):26–9. doi: 10.1111/j.1600-0447.1990.tb01350.x. [DOI] [PubMed] [Google Scholar]
- Nazimek JM, Hunter MD, Woodruff PWR. Auditory hallucinations: Expectation-perception model. Medical Hypotheses. 2012;78(6):802–810. doi: 10.1016/j.mehy.2012.03.014. http://doi.org/10.1016/j.mehy.2012.03.014. [DOI] [PubMed] [Google Scholar]
- Northoff G, Qin P. How can the brain’s resting state activity generate hallucinations? A “resting state hypothesis” of auditory verbal hallucinations. Schizophrenia Research. 2011;127(1):202–214. doi: 10.1016/j.schres.2010.11.009. http://doi.org/10.1016/j.schres.2010.11.009. [DOI] [PubMed] [Google Scholar]
- Nuechterlein K, Green M. MCCB: matrics consensus cognitive battery. Los Angeles: MATRICS Assessment; 2006. [Google Scholar]
- Ocklenburg S, Westerhausen R, Hirnstein M, Hugdahl K. Auditory Hallucinations and Reduced Language Lateralization in Schizophrenia: A Meta-analysis of Dichotic Listening Studies. Journal of the International Neuropsychological Society. 2013;19:410–418. doi: 10.1017/S1355617712001476. http://doi.org/10.1017/S1355617712001476. [DOI] [PubMed] [Google Scholar]
- Park HJ, Kwon JS, Youn T, Pae JS, Kim JJ, Kim MS, Ha KS. Statistical parametric mapping of LORETA using high density EEG and individual MRI: Application to mismatch negativities in Schizophrenia. Human Brain Mapping. 2002;17(3):168–178. doi: 10.1002/hbm.10059. http://doi.org/10.1002/hbm.10059. [DOI] [PMC free article] [PubMed] [Google Scholar]
- Todd J, Harms L, Schall U, Michie PT. Mismatch negativity: Translating the potential. Frontiers in Psychiatry. 2013 Dec;4:1–22. doi: 10.3389/fpsyt.2013.00171. http://doi.org/10.3389/fpsyt.2013.00171. [DOI] [PMC free article] [PubMed] [Google Scholar]
- Todd J, Robinson J. The use of conditional inference to reduce prediction error—A mismatch negativity (MMN) study. Neuropsychologia. 2010;48(10):3009–3018. doi: 10.1016/j.neuropsychologia.2010.06.009. http://doi.org/10.1016/j.neuropsychologia.2010.06.009. [DOI] [PubMed] [Google Scholar]
- Umbricht D, Krljes S. Mismatch negativity in schizophrenia: a meta-analysis. Schizophrenia Research. 2005;76(1):1–23. doi: 10.1016/j.schres.2004.12.002. http://doi.org/10.1016/j.schres.2004.12.002. [DOI] [PubMed] [Google Scholar]
- Ventura J, Green MF, Shaner A, Liberman RP. Training and quality assurance with the Brief Psychiatric Rating Scale: “The drift busters”. International Journal of Methods in Psychiatric Research. 1993;3(4):221–244. [Google Scholar]
- Waters F, Woodward T, Allen P, Aleman A, Sommer I. Self-recognition Deficits in Schizophrenia Patients With Auditory Hallucinations: A Meta-analysis of the Literature. Schizophrenia Bulletin. 2012;38(4):741–750. doi: 10.1093/schbul/sbq144. http://doi.org/10.1093/schbul/sbq144. [DOI] [PMC free article] [PubMed] [Google Scholar]
- Zion-Golumbic E, Deouell LY, Whalen DH, Bentin S, Green M, Dehaene S, Light G. Representation of harmonic frequencies in auditory memory: A mismatch negativity study. Psychophysiology. 2007;44(5):671–679. doi: 10.1111/j.1469-8986.2007.00554.x. http://doi.org/10.1111/j.1469-8986.2007.00554.x. [DOI] [PubMed] [Google Scholar]