

Abstract
Neuropilins (NRP1 and NRP2) are co-receptors for heparin-binding growth factors and class 3 semaphorins. Different isoforms of NRP1 and NRP2 are produced by alternative splicing. We found that in non–small cell lung cancer (NSCLC) cell lines, transforming growth factor–β (TGFβ) signaling preferentially increased the abundance of NRP2b. NRP2b and NRP2a differ only in their carboxyl-terminal regions. Although the presence of NRP2b inhibited cultured cell proliferation and primary tumor growth, NRP2b enhanced cellular migration, invasion into Matrigel, and tumorsphere formation in cultured cells in response to TGFβ signaling and promoted metastasis in xenograft mouse models. These effects of overexpressed NRP2b contrast with the effects of overexpressed NRP2a. Hepatocyte growth factor (HGF)–induced phosphorylation of the kinase AKT was specifically promoted by NRP2b, whereas inhibiting the HGF receptor MET attenuated NRP2b-dependent cell migration. Unlike NRP2a, NRP2b did not bind the PDZ domain scaffolding protein GAIP carboxyl terminus–interacting protein (GIPC1) and only weakly recruited phosphatase and tensin homolog (PTEN), potentially explaining the difference between NRP2b-mediated and NRP2a-mediated effects. Analysis of NSCLC patient tumors showed that NRP2b abundance correlated with that of the immune cell checkpoint receptor ligand PD-L1 as well as with epithelial-to-mesenchymal transition (EMT) phenotypes in the tumors, acquired resistance to epidermal growth factor receptor (EGFR) inhibitors, disease progression, and poor survival in patients. NRP2b knockdown attenuated the acquisition of resistance to the EGFR inhibitor gefitinib in cultured NSCLC cells. Thus, in NSCLC, NRP2b contributed to the oncogenic response to TGFβ and correlated with tumor progression in patients.
INTRODUCTION
Lung cancer currently accounts for one-fifth of cancer deaths worldwide and is the leading cause of cancer deaths in the United States (1). The disease would be eminently more treatable if not for its propensity to invade, metastasize, and become drug-resistant. In part, these malignant properties are driven by the epithelial-to-mesenchymal transition (EMT) and the proliferation of associated cancer stem cells (CSCs) (2, 3). One of the most important physiologic EMT inducers is transforming growth factor–β (TGFβ), along with other growth factors and cytokines secreted by the tumor microenvironment. In solid tumors, CSCs have mixed epithelial-mesenchymal features, with the EMT program providing a mechanism by which cells acquire stem-like properties (4). The incidence of EMT in lung cancer is frequently underestimated. Although widespread E-cadherin loss, a marker of complete EMT, occurs in ~10% of non–small cell lung cancers (NSCLCs) (5), most of the tumors have EMT features when one uses less stringent criteria (6). In breast cancer, a partial EMT phenotype, marked by coexpression of epithelial and mesenchymal markers, is sufficient to facilitate invasion and vascular dissemination of tumor cells (7).
Semaphorin 3F (SEMA3F), a ligand for the receptor neuropilin 2 (NRP2), was identified from a recurrent chromosome 3p deletion in lung cancer (8, 9). SEMA3F has potent tumor suppressor activity, and its down-regulation in lung cancer cell lines involves the transcription factor ZEB1 (8, 10–13). Reexpression of SEMA3F causes decreased integrin activation and integrin-linked kinase activity, along with decreased phosphorylation of extracellular signal–regulated kinase (ERK), protein kinase B (PKB/AKT), and signal transducer and activator of transcription 3 (STAT3)(10, 14). In contrast to SEMA3F down-regulation, the two human NRPs (NRP1 and NRP2) are often up-regulated in tumors that associate with poor patient prognosis [reviewed in (15)]. In addition to serving as high-affinity receptors for SEMA3 ligands, both NRP1 and NRP2 were identified as co-receptors for vascular endothelial growth factor (VEGF) isoforms containing a heparin-binding domain (9, 16). Other heparin-binding growth factors, including hepatocyte growth factor (HGF), placental growth factor, fibroblast growth factor (FGF), platelet-derived growth factor (PDGF), and TGFβ, also interact with one or both NRPs (15).
We previously reported that NRP2 was up-regulated during TGFβ-mediated EMT in NSCLC cell lines and that NRP2 knockdown inhibited TGFβ-mediated responses, including invasive tumor growth (17). Notably, nearly all reported NRP2 studies have involved the prototype NRP2a isoform, which is closely related throughout its entirety to NRP1. NRP2b is a largely uninvestigated, alternatively spliced isoform that diverges from NRP2a in its C-terminal 93 amino acids. Here, we found that NRP2 up-regulation by TGFβ preferentially involves NRP2b and that NRP2b had distinct functions compared with those of the “canonical” isoform NRP2a. Our results indicate that the relatively unknown NRP2b plays a critical role in protumorigenic TGFβ-mediated responses in lung cancer cells and may promote lung cancer progression.
RESULTS
NRP2 up-regulation by TGFβ preferentially involves the NRP2b isoform
On Western blots of NSCLC cell lines probed with NRP2 antibody, the corresponding protein was frequently observed to migrate as a double band, as shown for H1975 and A549 (Fig. 1A). In other cell lines, such as H358, the NRP2 signal was diffused, consistent with glycosylation. One possible explanation for the NRP2 doublet was the differences between alternatively spliced isoforms. Originally described at the mRNA level, the NRP2b isoform is predicted to be 30 amino acids shorter than NRP2a (18, 19). However, the function of NRP2b has not been previously reported. Although the overall structure of the two isoforms is similar (Fig. 1B), NRP2b diverges markedly in its C-terminal 93 amino acids. An alignment of NRP2b and NRP2a cytoplasmic domains showed that only 4 of 43 amino acids are identical, whereas NRP2a and NRP1 share 54% identity in this region (fig. S1A). Nevertheless, the divergent C terminus of NRP2b is highly conserved among vertebrates, as exemplified by the cytoplasmic domain (fig. S1B). Moreover, there is no corresponding “b-like” isoform of NRP1 in the databases, suggesting that NRP2b has a unique biological function.
Fig. 1. NRP2b is differentially induced by TGFβ.
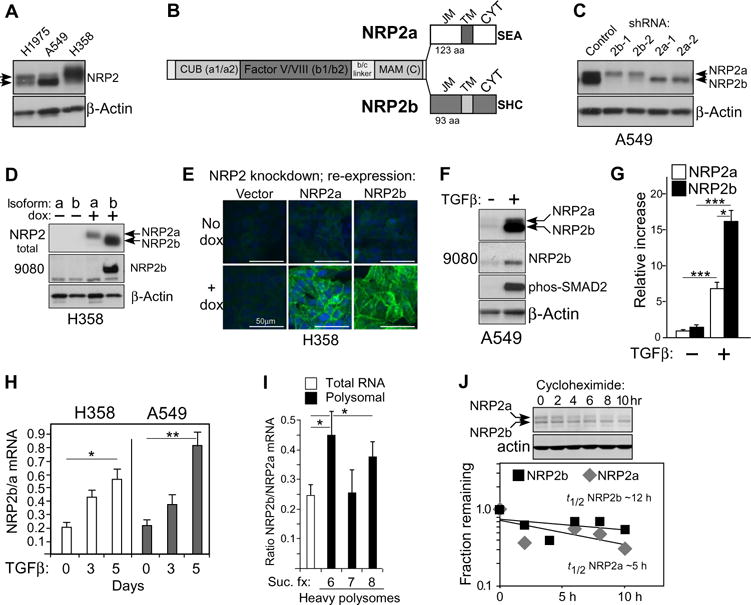
(A) Western blot of cell lysates from indicated NSCLC cell lines probed for NRP2 and actin; arrowheads indicate double band. A549 cells were pretreated with TGFβ for 24 hours. (B) Diagram of NRP2a and NRP2b isoforms indicating shared extracellular domains [CUB (a1/a2), Factor V/VIII (b1/b2), and MAM (c)] and C-terminal sequences comprising the juxtamembrane (JM), transmembrane (TM), and cytoplasmic (CYT) domains. Three C-terminal amino acids of each isoform are indicated. (C) A549 cells stably transfected with isoform-specific shRNAs were analyzed by Western blot for NRP2; actin confirmed equal loading. Bands corresponding to NRP2a and NRP2b are indicated. (D) H358 cells expressing dox-inducible shRNA-resistant isoforms were analyzed by Western blot for total NRP2 and for NRP2b using the b-specific antibody 9080. (E) Confocal immunofluorescence microscopy of H358 cells expressing dox-inducible NRP2 isoforms. Fixed cells were stained with an antibody recognizing NRP2 (green); nuclei were counterstained with 4′,6-diamidino-2-phenylindole (DAPI, blue). Scale bars, 50 μm. (F) Western blot of A549 cells treated with TGFβ (5 ng/ml; 24 hours) using indicated antibodies. (G) Quantitation of isoform-specific bands from (F). Densitometric values were processed by ImageJ and normalized to the control NRP2a band. Data are means ± SEM from n = 4 experiments; *P ≤ 0.05, ***P ≤ 0.001, one- or two-sample t tests on a log scale. (H) Quantitative RT-PCR for NRP2 isoforms in the indicated cell lines after a time course of TGFβ exposure. The NRP2b/NRP2a ratio is plotted versus time. Data are means ± SEM from n = 3 experiments; *P ≤ 0.05, **P ≤ 0.01, two-sample t test analyzed on a log scale. (I) Quantitative RT-PCR for NRP2b/NRP2a ratio in total and polyribosome-bound RNA from sucrose gradient fractions (Suc. fx.) from H358 cells after 24 hours of TGFβ exposure. Data are means ± SEM from n = 3 experiments; *P ≤ 0.05, two-tailed t test analyzed on a log scale. (J) Reanalysis of a previously published Western blot for A549 cells after 24 hours TGFβ ± cycloheximide (17). Top: Cycloheximide decay time course. Bottom: Densitometric analysis of NRP2a (top) and NRP2b (bottom) bands, plotted separately. The fractions remaining were used to calculate the approximate t1/2 for each isoform.
To determine whether the faster migrating band represented NRP2b, two independent short hairpin RNAs (shRNAs) were developed for each isoform and stably transfected into recipient cells. Atthem RNA level, each shRNA specifically inhibited its intended target (fig. S2). At the protein level, NRP2b knockdown substantially reduced the faster migrating band, whereas shRNAs targeting NRP2a eliminated the larger isoform, confirming their identities (Fig. 1C). However, each of the four shRNAs, which target unrelated sequences, reproducibly affected the non-targeted isoform. This might occur if NRP2a and NRP2b formed hetero-dimers (see below) and if the knockdown of one isoform affected the stability of the other. Additional verification of the migration differences was obtained by ectopic expression of each isoform in cells with knockdown of endogenous total NRP2 (Fig. 1D); similar findings were obtained in an independent cell line (fig. S2C). We also developed a rabbit polyclonal antibody (9080) using unique peptides from the NRP2b cytoplasmic domain (fig. S3). This antibody recognized ectopic and endogenous NRP2b with no reactivity against overexpressed NRP2a (Fig. 1D and fig. S3B). Using cell lines with endogenous total NRP2 knockdown and ectopic expression of each isoform, immunofluorescence staining demonstrated that both isoforms were expressed at the cell surface (Fig. 1E). Thus, the divergent C terminus of NRP2b does not impair plasma membrane localization. Last, using total NRP2 and NRP2b-specific antisera, TGFβ treatment of A549 cells was found to predominantly up-regulateNRP2b (Fig. 1, F and G).
Densitometry indicated that the increase in NRP2b after short-term TGFβ exposure in A549 cells was 11-fold, whereas the increase in NRP2a was significantly less (about six fold; Fig. 1G). Using isoform-specific primers and real-time reverse transcription polymerase chain reaction (RT-PCR), TGFβ stimulation caused a time-dependent relative increase in NRP2b mRNA expression (Fig. 1H). In addition, compared to total RNA, NRP2b message was preferentially enriched on two of three heavy polysome fractions (Fig. 1I). Furthermore, the protein half-life of NRP2b was ~12 hours compared to ~5 hours for NRP2a (Fig. 1J). Thus, the increase in NRP2b protein by TGFβ may be accounted for by changes in splicing, polyribosome loading, and protein stability.
TGFβ-mediated migration and invasion is NRP2b-dependent
In lung cancer cell lines, total NRP2 knockdown impaired baseline and TGFβ-induced migration and invasion (17). The corresponding effect of isoform-specific knockdowns was examined using transwell assays. Knockdown of NRP2b in H358 cells significantly inhibited TGFβ-stimulated migration as effectively as did the knockdown of total NRP2 (Fig. 2A). In contrast, NRP2a knockdown significantly increased migration above that exhibited by controls, whereas TGFβ exposure enhanced this effect. Invasion across Matrigel-coated membranes was also inhibited by NRP2b knockdown and enhanced by NRP2a knockdown (Fig. 2B). Equivalent results were obtained in A549 cells (Fig. 2, C and D). To further explore these findings, we reexpressed shRNA-resistant NRP2 isoforms in H358 cells that had been knocked down for endogenous NRP2. NRP2a reexpression failed to restore TGFβ-induced migration (Fig. 2E). In contrast, reexpression of NRP2b restored and significantly enhanced migration above that exhibited by control cells. Growth assays verified that the effects of NRP2b on migration were not confounded by enhanced proliferation (fig. S4).
Fig. 2. Effects of NRP2 isoforms on migration and invasion.
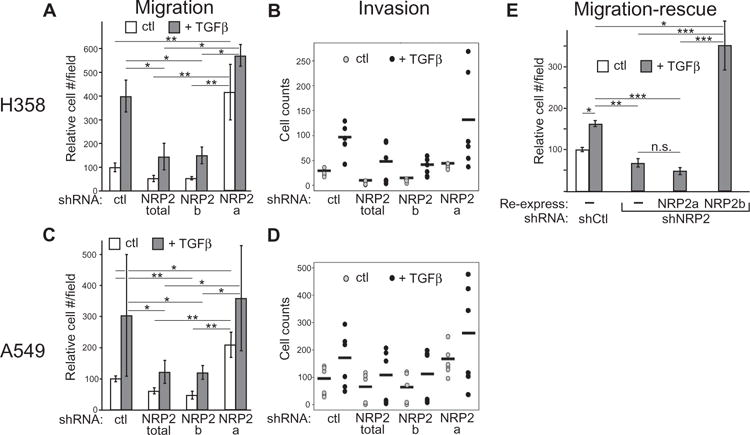
(A to D) Transwell migration (A and C) and invasion (B and D) for H358 (A and B) and A549 (C and D) cells in response to TGFβ. Cells bearing indicated knockdowns were compared over 24 (A) or 18 (C) hours. Data in (A) and (C) are means ± SEM from n = 3 experiments; *P ≤ 0.05, **P ≤ 0.01, linear combinations of analysis of variance (ANOVA) parameters analyzed on a log scale. Data in (B) and (D) are dot plots (n = 2; horizontal bars represent the mean). (E) Migration-rescue assay in H358 cells bearing the indicated knockdowns, with or without reexpressed shRNA-resistant isoforms, treated with dox and placed into Boyden chambers. Cells that migrated after 24-hour exposure to TGFβ were counted. Data are means ± SEM from n = 3 experiments; *P ≤ 0.05; **P ≤ 0.01; ***P ≤ 0.001, linear combinations of ANOVA parameters analyzed on a log scale. n.s., not significant.
NRP2b supports invasion and metastasis in vivo
Previously, we demonstrated that local tumor invasion in subcutaneous xenografts was NRP2-dependent (17). To extend these results to the isoforms, we subcutaneously injected H358 cells with endogenous NRP2 knockdown and reexpression of shRNA-resistant NRP2a and NRP2b into immunodeficient mice. Cells containing control shRNA produced tumors that were generally uninterrupted by interspersed stromal compartments (Fig. 3A). NRP2a expression did not substantially change this appearance. In contrast, NRP2b-expressing tumors were distinguished by their marked interdigitation of stroma, resembling the previously described effect of TGFβ (17).
Fig. 3. Promotion of invasion and metastasis by NRP2b.
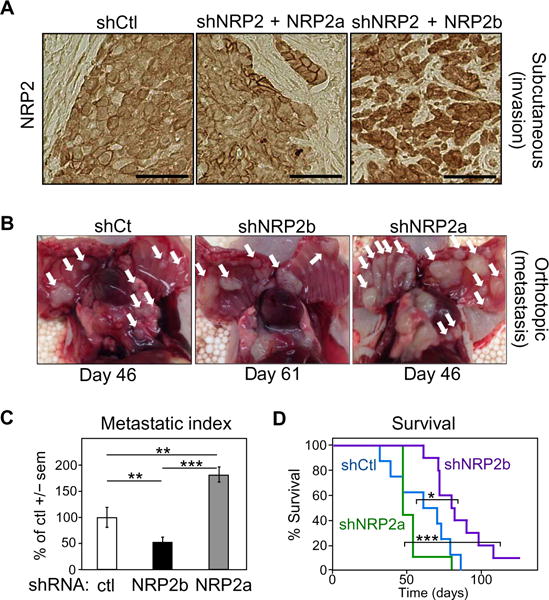
(A) Immunohistochemical staining for NRP2 in tumors derived from control H358 cells (shCtl, left) or shNRP2 cells with reexpression of either NRP2a (middle) or NRP2b (right), grown as subcutaneous xenografts in immunocompromised mice (n = 8 for each condition). (B) Orthotopic model of H358 cells knocked down with shCtl, shNRP2b, or shNRP2a (n = 10 for each condition). Macroscopic deposits of metastatic tumor cells attached to the thoracic cavity (white arrows) were photographed and counted. (C) Metastatic index. Numbers of chest wall metastases/animal formed from shNRP2b and shNRP2a cells were normalized to the time after injection and compared to shControls. Significance was determined by linear combinations of ANOVA parameters analyzed on a log scale. (D) Kaplan-Meier survival analysis of the orthotopic cohorts from (B). Significance was assessed using the log-rank test. In (C) and (D), *P ≤ 0.05; **P ≤ 0.01; ***P ≤ 0.001.
In an orthotopic model, H358 cells with individual isoform knockdowns were injected into the right lung of immunodeficient mice (Fig. 3B). Visual inspection of the thoracic cavity of mice bearing control tumors demonstrated numerous bilateral lesions on the inner chest wall (white arrows). NRP2b knockdown reduced the number of visible tumors, whereas NRP2a knockdown had the opposite effect. Because the number of metastases reflects both the metastatic potential and growth over time, we used a metastatic index based on the number of metastases divided by the number of weeks until symptom-induced sacrifice (Fig. 3C). As was apparent from visual inspection, the metastatic burden of shNRP2b mice was significantly reduced compared to controls, whereas the shNRP2a group had significantly greater metastatic disease. These differences were reflected in survival, with mice bearing the NRP2b knockdown tumors having significantly improved survival compared to animals bearing NRP2a knockdown tumors (Fig. 3D).
Tumorsphere formation is NRP2b-dependent
In part, EMT contributes to cancer progression through the development of CSCs, which are more tumorigenic and resistant to chemotherapy, radiation, and various targeted agents (3, 4, 20, 21). In culture, these cells form tumorspheres with a frequency that reflects their abundance in the population (2, 3). In H358 cells, knockdown of either total NRP2 or NRP2b significantly inhibited tumorsphere formation, whereas NRP2a knockdown had a modest effect (Fig. 4, A and B). Notably, in contrast to NRP2b knockdown, NRP2a knockdown in epidermal growth factor receptor (EGFR)–mutant HCC4006 cells significantly increased tumorsphere formation (Fig. 4C). In addition, flow cytometry was used to examine DyeCycle Violet–excluding cells (DCV− side populations), an indicator of stem-like phenotypes. Like the DCV− control cells, shNRP2a HCC4006 side-population cells showed enhanced spheroid-forming capacity (Fig. 4D). In contrast, DCV− cells were substantially reduced in NRP2b knockdown cultures; this prevented assessment of their spheroid-forming capacity.
Fig. 4. NRP2b promotes tumorsphere formation.
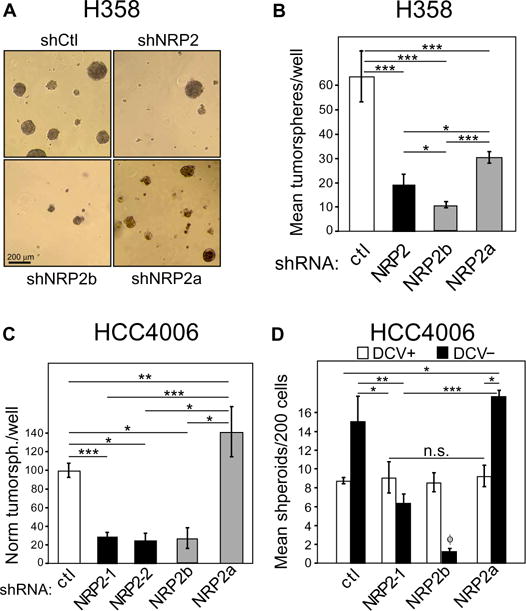
(A) Representative micrographs of tumorspheres generated by H358 cells bearing indicated shRNAs. n = 3 experiments. (B) Mean numbers of tumorspheres per well (six replicates) from (A). n = 3 experiments; linear combinations of ANOVA parameters analyzed on a log scale. (C) HCC4006 cells bearing indicated knockdowns were cultured under spheroid conditions and analyzed as in (B). (D) DyeCycle Violet–negative (DCV−) side-population cells were sorted by flow cytometry and cultured for spheroid growth. Comparsions were made between DCV-positive (DCV+) main population and DCV− side-population cells bearing the indicated knockdowns. n = 3; one-way ANOVA. f indicates that the DCV− population in shNRP2b cells was insufficient for analysis with <40 cells per well compared to 200 cells for all other genotypes. In (B) to (D), *P ≤ 0.05; **P ≤ 0.01; ***P ≤ 0.001.
NRP2 is associated with acquired resistance to an EGFR inhibitor
Known mechanisms of acquired EGFR inhibitor resistance include acquisition of the T790M mutation (22), activation of other tyrosine kinases, such as MET (23) and AXL (24), transformation to a small-cell phenotype (25), and development of EMT along with stem cell features (26–28). Notably, Uramoto et al. (29) reported that nearly half of patient tumors with acquired EGFR inhibitor resistance had associated EMT features. In cell lines, TGFβ is shown to induce EGFR inhibitor resistance by various mechanisms, including EMT, ligand shedding and receptor clustering (30), interleukin-6 up-regulation (31), and kinase switching (32).
To determine whether NRP2 has a role in acquired inhibitor resistance, we first exposed EGFR-mutant HCC2279 cells to TGFβ for 24 hours and observed a trend toward gefitinib resistance in control cells, which was blocked by NRP2 knockdown (Fig. 5A). To provide more definitive evidence, we chronically exposed EGFR-mutant PC-9 cells to gefitinib at its median inhibitory concentration (IC50) for 4 weeks. This resulted in a highly significant shift toward resistance in control cells that was prevented by NRP2 knockdown (Fig. 5B, left). Moreover, the gefitinibnaïve cultures of shNRP2 cells became intrinsically more sensitive to gefitinib. The gefitinib-exposed cells displayed significantly increased migration reminiscent of an EMT (Fig. 5B, middle), whereas previous knockdown of total NRP2 blocked this increase. The potential effect of individual isoforms on the development of gefitinib resistance was examined using clonogenic assays (Fig. 5B, right). Colony formation by gefitinib-exposed cells knocked down for NRP2b was significantly impaired. In contrast, cells knocked down for NRP2a formed equivalent numbers of colonies without regard to the presence of the drug and formed more colonies in the presence of gefitinib than control, total shNRP2, or shNRP2b cells. The relative difference in fold change between shNRP2a cells with or without gefitinib (0.3) and shNRP2b cells with or without gefitinib (1.2) was significant (P = 0.04). Thus, the NRP2 isoforms appear to have differential effects on the ability of EGFR-mutant cells to develop gefitinib resistance.
Fig. 5. NRP2b abundance is associated with acquired EGFR inhibitor resistance.
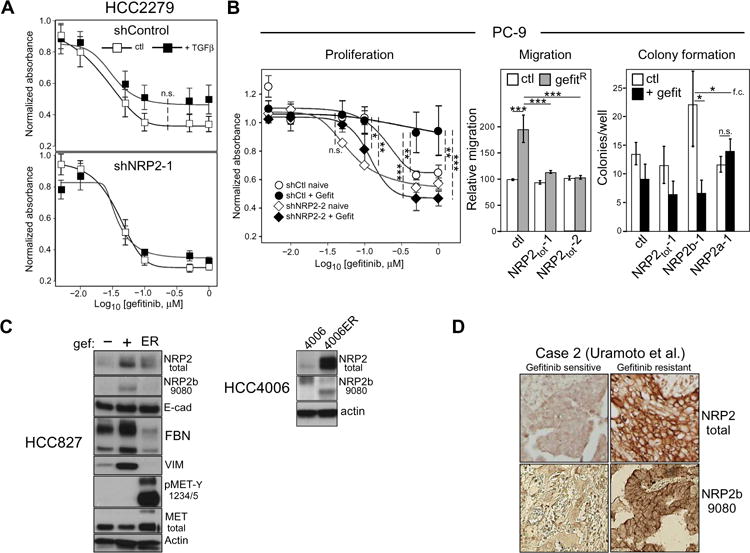
(A) Gefitinib senstivity of HCC2279 cells, without and with NRP2 knockdown, was assessed by MTS proliferation assay in the presence or absence of TGFβ (n = 5 experiments). A trend to increased resistance was observed in TGFβ-exposed control cells, but not when NRP2 was knocked down. n.s., not significant. (B) Left: Proliferation assay of shControl and shNRP2 PC-9 cells, cultured in the presence (+Gefit) or absence (naïve) of 50 nM of gefitinib for 4 weeks. n = 4 experiments; two-way ANOVA. Middle: Transwell migration assays of gefitinib-exposed PC-9 cells bearing the indicated knockdowns. n = 3 experiments; linear combinations of ANOVA parameters analyzed on a log scale. Right: Clonogenic colony formation assay of gefitinib-exposed PC-9 cells bearing the indicated knockdowns performed in the absence or presence of 50 nM of gefitinib. n = 3 experiments; linear combinations of ANOVA parameters analyzed on a log scale; f.c., fold change. *P ≤ 0.05; **P ≤ 0.01; *** P ≤ 0.001. (C) Left: HCC827 cells selected in gefitinib (+) or not (−) were analyzed by Western blot with the indicated antibodies. Erlotinib-resistant HCC827-ER cells (ER) are included for comparison. Right: HCC4006 and erlotinib-resistant HCC4006-ER cells were analyzed for NRP2 and NRP2b. Blots are representative of at least three independent experiments. (D) Staining for total NRP2 and NRP2b (9080) in patient biopsies from an EGFR mutant tumor, before and after development of gefitinib resistance [n = 3; shown is case #2; Uramoto et al. (29)].
HCC827 cells selected in low-level gefitinib were also examined for expression of NRP2 and EMT markers (Fig. 5C, left). These were compared to HCC827-ER, an independently derived erlotinib-resistant cell line with high MET activation. The short-term gefitinib-selected cells had substantial up-regulation of NRP2, which was predominantly the NRP2b isoform, as evidenced by its characteristic gel migration and detection by the NRP2b-specific antibody. These cells exhibited a partial EMT phenotype with up-regulation of the mesenchymal markers, vimentin and fibronectin. Despite this mesenchymal shift, there was no loss of total E-cadherin or other epithelial markers. By comparison, MET-activated HCC827-ER cells had no evidence of EMT with minimal NRP2 up-regulation. Also shown (Fig. 5C, right) are results from EGFR-mutant HCC4006 cells selected for erlotinib resistance, which have a complete, stable EMT phenotype with evidence of increased TGFβ signaling (33). In these cells, the degree of NRP2 up-regulation was marked and equally involved the a and b isoforms.
To examine patient tumors, we stained slides from three pre- and posttreatment gefitinib-resistant cases, reported by Uramoto et al. (29), which had undergone EMT changes, for total NRP2 and NRP2b (Fig. 5D, representative data from case 2). In contrast to the initial sensitive tumor, the gefitinib-resistant sample demonstrated strong membrane staining with total and NRP2b-specific antibodies. Of the three matched cases, two demonstrated NRP2b up-regulation. In summary, NRP2 up-regulation occurs frequently in cell lines and patient samples with acquired EGFR inhibitor resistance and a partial or complete EMT phenotype. NRP2 up-regulation predominantly involved either the b isoform or both isoforms, but in no instance have we observed NRP2a up-regulation as the predominant or sole isoform in acquired EGFR inhibitor resistance. Total NRP2 or NRP2b knockdown blocked the acquired EGFR inhibitor resistance, whereas NRP2a knockdown did not.
NRP2b abundance in human lung tumors correlates with stage, progression, and PD-L1 abundance
To examine NRP2b abundance as a prognostic marker in patient samples, we studied 546 lung cancers present on two tumor microarrays (TMAs) (selected staining results are shown in fig. S5; tumor histologies and clinical parameters are summarized in tables S1 and S2). Membrane staining for NRP2b was absent among all 10 normal lung samples from the 110-case array, in contrast to 79% positivity (87 of 110) among the lung cancers (P < 0.001, Fisher’s exact test). The absence of NRP2b membrane staining in the normal lung was confirmed in 15 additional independent samples.
A multivariable logistic regression model, adjusted for age and sex, found that the risk of a stage 3 to 4 tumor among the 110-case TMA was significantly associated with the percentage of cells positive for membrane-localized NRP2b. Among cases with >50% NRP2b-positive cells, the odds ratio for stage 3 to 4 disease was 3.0 (P = 0.04), whereas there was no significant relationship observed with total NRP2 staining, suggesting that this is an NRP2b-specific association. In the second cohort of 436 cases, progression-free survival (PFS) was modeled using the Cox proportional hazard regression, adjusted for stage, grade, smoking status, age, and histology. The PFS was significantly negatively associated with the percentage of NRP2b-positive cells, but not for total NRP2 (P = 0.03 versus 0.12). Considering the percentage of NRP2b-positive cells as a continuous variable, the hazard ratio for the progression was 1.19 for every 20% increase in positivity. These results indicate that poor outcomes are associated with the percentage of tumor cells specifically expressing NRP2b, but not total NRP2. In addition, the regulation of programmed death ligand 1 (PD-L1) expression in lung cancer has been linked to the EMT-associated transcription factor ZEB1(34), a known downstream target of TGFβ and essential factor in NRP2 up-regulation (17). In this system, ZEB1-mediated suppression of the microRNA miR-200 enables the up-regulation of PD-L1. Using the 110-case TMA, NRP2b staining positively correlated with PD-L1 (R = 0.27, P = 0.006).
NRP2 isoforms differentially activate MET signaling and differentially recruit GIPC1 and PTEN
NRPs serve as co-receptors for growth factors containing heparin-binding domains, such as HGF (35). A secretome analysis of TGFβ-treated H358 cells identified HGF as the most induced heparin-binding ligand (table S3), suggesting that MET signaling might be differentially activated by NRP2b. To test this, H358 cells with endogenous NRP2 knockdown and selective reexpression of each isoform were serum-starved, then treated with exogenous HGF for varying times up to 8 hours. Compared to controls, phosphorylation of MET on Tyr1234/1235 was attenuated by NRP2 knockdown (Fig. 6A). Reexpression of NRP2a led to a transient increase in MET phosphorylation. By comparison, reexpression of NRP2b led to modest but progressively increasing phosphorylation, peaking several hours after the maximum observed with NRP2a. The activation of AKT by HGF was dependent on NRP2b, whereas the phosphorylation of ERK was similar regardless of which isoform was reexpressed. Higher NRP2b protein in these experiments reflect its longer half-life (Fig. 1J). Together, these results demonstrate that NRP2 isoforms differentially affect MET activation and signaling.
Fig. 6. NRP2 isoforms differentially affect MET activation.
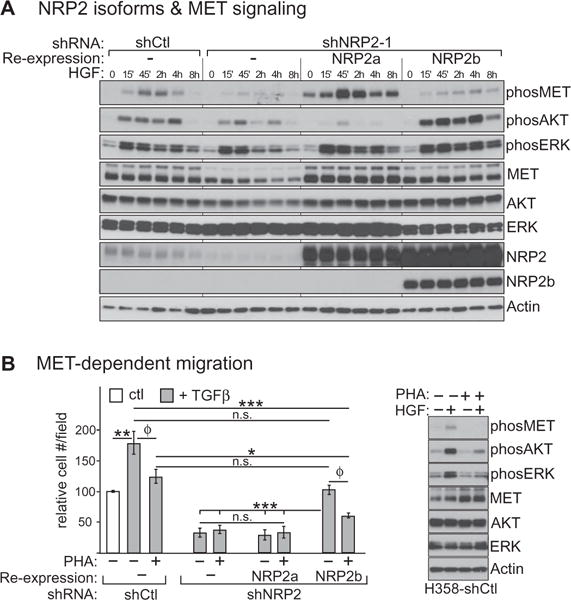
(A) Western blotting for MET-signaling markers in response to HGF (h, hours) in serum-starved H358 cells bearing the indicated NRP2 knockdown, without or with reexpressed isoforms. (B) Left: TGFβ-induced migration of H358 cells bearing NRP2 knockdown and reexpressed isoforms was assessed in the presence or absence of the MET inhibitor, PHA-665752 (PHA). Data were analyzed as in Fig. 2, A and C. Dox induction was omitted in these experiments, accounting for the reduced NRP2b-mediated migration rescue. n = 3 experiments; linear combinations of ANOVA parameters analyzed on a log scale. (f) P > 0.05 for these pairwise comparisons in the ANOVA model. However, in stand-alone t tests, P = 0.0006 and 0.0003, respectively. The results for shCtl and shNRP2 with reex-pressed NRP2b had lower variability compared to shNRP2 alone and shNRP2 with reexpressed NRP2a. Thus, their comparisons were adversely affected by pooling errors in the ANOVA model, which by default assumes equal variance among groups. Right: Western blot confirmation of MET inhibition. Blots are representative of three independent experiments.
We then asked whether TGFβ-stimulated migration was dependent upon MET. Migration assays were performed in the presence of the MET inhibitor PHA-665752 (Fig. 6B). As can be seen, PHA-665752 reduced TGFβ-stimulated migration of cells transfected with control shRNA, whereas it had no apparent effect on cells knocked down for total NRP2, with or without reconstitution of NRP2a. In contrast, leaky reexpression of NRP2b, even without further induction by doxycycline, restored migration in a PHA-665752–sensitive manner. Western blotting (Fig. 6B) confirmed that PHA-665752 inhibited MET phosphorylation and downstream signaling. These results suggest that TGFβ-stimulated migration of H358 cells involves NRP2b in concert with MET signaling.
The NRP2 isoforms are distinguished by divergent C termini. In particular, NRP2a terminates in a Ser-Glu-Ala (SEA) motif, which in NRP1 was shown to bind GAIP (Gα interacting protein) C terminus–interacting protein (GIPC1) (also known as NIP or synectin) (36), a PDZ domain protein known to regulate endocytosis and endosomal trafficking (37). In contrast, NRP2b terminates in a Ser-His-Cys (SHC) motif (Fig. 1B). Thus, we suspected that NRP2a would bind GIPC1, whereas NRP2b would not. To test this, we transiently transfected cells containing doxinducible NRP2a or NRP2b with murine Gipc1 (mGipc1) and examined them by immunoprecipitation. As we predicted, mGipc1 coprecipitated with NRP2a but not NRP2b (Fig. 7A).
Fig. 7. Differential binding of GIPC1 and PTEN by NRP2 isoforms.
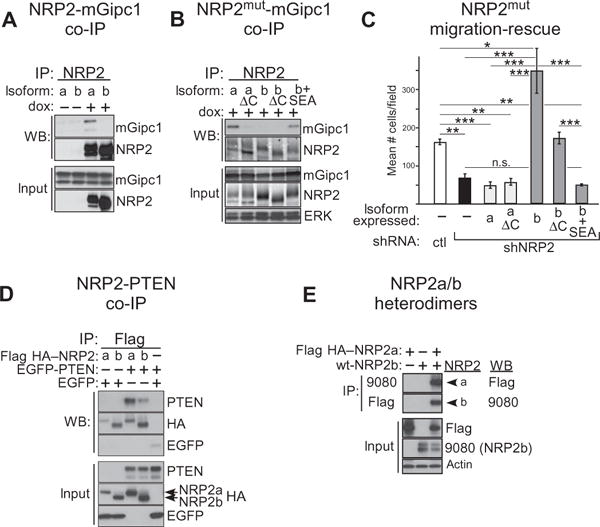
(A) H358 cells knocked down for NRP2 and rescued by dox-inducible NRP2a or NRP2b were transfected with murine mGipc1 and exposed (+) or not (−) to dox. Lysates were immunopreciptated and analyzed by Western blot for NRP2 and coprecipitated mGipc1, as indicated. Transfected mGipc1 and endogenous GIPC1 compose the upper and lower input bands, respectively. (B) As in (A), except cells expressed cytoplasmic deletion mutants of NRP2a (a ΔC) or NRP2b (b ΔC) or a chimeric NRP2b bearing an ectopic GIPC1 binding motif (b + SEA), as indicated. (C) TGFβ-stimulated migration was determined for H358 cells expressing the NRP2 isoform mutants from (B). Results for wild-type NRP2 isoforms (from Fig. 2E) are included for comparison. n = 3 experiments; linear combinations of ANOVA parameters analyzed on a log scale. (D) HEK293T cells were transfected with EGFP-tagged PTEN and Flag HA–tagged NRP2 isoforms, as indicated. Lysates were immunoprecipitated and analyzed by Western blotting with the listed antibodies. (E) HEK293 T cells were transfected with Flag HA–NRP2a, untagged NRP2b, or the combination. Lysates were immunoprecipitated with either anti-Flag or the 9080 NRP2b-specific antibody and analyzed by Western blotting using the reciprocal antibody, Flag for 9080 immunoprecipitates, and 9080 for Flag immunoprecipitates. Blots are representative of three independent experiments.
To examine the role of the cytoplasmic termini and GIPC1 binding on the migratory differences resulting from the isoforms, we deleted the cytoplasmic segment from each (ΔC) and also added a GIPC1-binding SEA motif to the cytoplasmic domain of NRP2b (+SEA). As expected, GIPC1 binding was lost with deletion of the NRP2a cytoplasmic domain, whereas the addition of SEA to NRP2b led to ectopic GIPC1 binding (Fig. 7B). In migration rescue assays (Fig. 7C), the loss of GIPC1 interaction failed to convert NRP2a into a promigratory molecule. For NRP2b, deleting the cytoplasmic domain resulted in loss of the “super-rescue” phenotype seen with the full-length molecule, although there was sufficient residual activity to rescue migration to that of control cells. This residual activity may be the result of the retained juxtamembrane and transmembrane segments. Forcing NRP2b to bind GIPC1 (b + SEA) resulted in complete loss of rescue ability, resembling NRP2a. From these results, we conclude that the divergent NRP2b C terminus along with the absence of GIPC1 binding are responsible for its promigratory activity.
Previously, it was reported that NRP1 interacted with phosphatase and tensin homolog (PTEN) in a manner dependent on its C-terminal SEA motif, and this attenuated AKT and mTORC1 activity in regulatory T cells (38). On the basis of the extensive similarity between NRP1 and NRP2a, including the SEA motif, we hypothesized that the isoforms of NRP2 would differentially recruit PTEN. Immunoprecipitation of Flag hemagglutinin (HA)–tagged NRP2a coprecipitated enhanced green fluorescent protein (EGFP)–tagged PTEN from transfected human embryonic kidney (HEK) 293T cells, confirming that NRP2a binds (directly or indirectly) PTEN (Fig. 7D). In contrast, PTEN binding to NRP2b was substantially reduced. Nevertheless, in multiple independent experiments using stringent wash conditions, the apparent interaction of PTEN with NRP2b persisted. We reasoned that residual coimmunoprecipitation of PTEN might occur if NRP2b formed heterodimers with endogenous NRP2a. Robust heterodimerization of NRP2b with NRP2a was confirmed by reciprocal coimmunoprecipitations using Flag HA–NRP2a and untagged NRP2b (Fig. 7E). Thus, the reduced recruitment of PTEN by NRP2b likely underlies its unique ability to promote activation of AKT in response to HGF and stimulate migration in a MET-dependent manner. In addition, heterodimer formation provides an explanation for why knockdown of either NRP2a or NRP2b affected the stability of the other isoform (Fig. 1C).
DISCUSSION
Our results demonstrate that TGFβ preferentially induces up-regulation of a largely uninvestigated protumorigenic NRP2 isoform, NRP2b, whereas the prototype receptor NRP2a had demonstrable antitumor properties. The actions of NRP2b were supported by the analysis of patient samples showing that its expression was correlated with advanced stage, worse PFS, PD-L1 staining, and acquired EGFR inhibitor resistance associated with EMT changes.
NRP1 was originally identified as a cell surface antigen in Xenopus that mediated neuronal interaction (39). Subsequently, NRP1 was identified as the receptor for collapsin-1/SEMA3a (40, 41). NRP2 was cloned on the basis of its sequence similarity and further work showed that it functioned as a high-affinity receptor for SEMA3 (18, 41). In addition, NRP1 and NRP2 were independently identified as co-receptorsfor certain VEGF isoforms and are important in vascular development (16, 42, 43). The NRP2b isoform was described at themRNA level morethan 15years ago (18, 19). By Northern blot analysis, NRP2a mRNA is reportedly high in the placenta, liver, small intestine, and lung, whereas NRP2b expression is low or absent in these tissues (19). In contrast, NRP2b expression was abundant in skeletal muscle, and both isoforms were detected in the heart. However, nearly all subsequent studies have exclusively involved the prototype NRP2a isoform.
SEMA3-NRP signaling has widespread roles in mammalian development (15, 38, 44). In cancer, altered SEMA3 or NRP expression has been implicated in tumor progression, invasion, and metastasis (17, 45). Recently, we reported that NRP2 was up-regulated during TGFβ1-driven EMT and that NRP2 knockdown inhibited EMT and invasive tumor growth (17). Mechanistically, NRP2 up-regulation by TGFβ involved noncanonical signaling through ERK and AKT, leading to increased translation of NRP2 mRNA by polyribosomes. In contrast, the NRP2 ligand, SEMA3F, is down-regulated during EMT in a ZEB1-dependent manner (13, 17). Whereas SEMA3F inhibits integrin activation and impairs multiple signaling pathways (10), NRP2 is a co-receptor for growth factors either implicated in EMT or known to function in the mesenchymal state, including HGF, PDGF, and FGF [reviewed in (15)]. Thus, the reciprocal changes in SEMA3F and NRP2 appear to be part of a coordinated program by which cells ac quire a motile, invasive phenotype. Our results suggest that the NRP2b isoform is specifically required for this behavior.
The NRP2 isoforms are identical through much of their extracellular domains. However, they diverge markedly in the juxtamembrane, transmembrane, and cytoplasmic segments, which in NRP2b is composed of 93 amino acids compared to 123 for NRP2a. The divergent, yet highly conserved, nature of NRP2b and the absence of an NRP1 paralog suggested that it has a unique function. This was confirmed by isoform-specific knockdowns and overexpression experiments where NRP2a and NRP2b demonstrated opposite responses. In cell culture migration and invasion assays, NRP2b expression enhanced these responses, whereas the effect of NRP2a was inhibitory. Likewise, NRP2b facilitated invasion and metastasis in vivo, whereas NRP2a had an opposite effect. Although enhanced proliferation could confound both migration and invasion assays, we found that NRP2b suppressed proliferation in culture and in vivo. Thus, the effect of NRP2b on migration and invasion is not due to increased growth rates.
The ability to grow as spheroids is characteristic of CSCs, known to be associated with aggressive tumor biology and resistance to chemotherapy, radiation, and targeted agents, including EGFR and anaplastic lymphoma receptor tyrosine kinase (ALK) inhibitors (3, 4). NRP2b specifically stimulated tumorsphere formation in unselected HCC4006 cells, as well as in dye-excluding cells sorted by flow cytometry. In EGFR-mutated PC-9 cells, NRP2b knockdown impaired the development of acquired gefitinib resistance, whereas NRP2a knockdown did not. In patient pre- and post-treatment samples, NRP2b staining was elevated in cases of acquired EGFR inhibitor resistance and EMT features. In unselected lung cancer patients, increased NRP2b staining was significantly associated with disease progression and poor survival, whereas no correlation was observed with an antibody that detects all isoforms. In addition, NRP2b protein also correlated with PD-L1, which mechanistically has been linked to miR-200 suppression by ZEB1 (34). Notably, normal lung tissue showed very little or no NRP2b membrane staining, whereas staining with a total NRP2 antibody was positive in 40% of normal samples. These results are in agreement with earlier RNA studies using Northern blots (19).
Oncogenic MET was originally identified as a fusion gene that induced transformed foci after chemical mutagenesis of an osteogenic sarcoma cell line (46). Activated AKT was shown to contribute significantly to the antiapoptotic effect of MET (47). AKT, as well as mitogen-activated protein kinase (MAPK) signaling has been implicated in HGF-induced migration, depending on the cellular context (48–52). Using a reverse-phase protein binding assay, we found that TGFβ-treated cells secreted significantly higher HGF, which was of interest because NRP1 and NRP2 have been reported to bind HGF and enhance MET signaling (53). We found that NRP2b expression was specifically associated with HGF-mediated AKT activation and a MET inhibitor, PHA-665752, significantly reduced TGFβ-stimulated NRP2b-dependent migration. By analogy, we anticipate that signaling from other heparin-binding growth factors interacting with NRP2 may also be differentially affected by the NRP2 isoforms.
The NRP2a isoform terminates in SEA, which in NRP1 was shown to bind GIPC1 (36), a PDZ domain protein known to regulate endocytosis and endosomal trafficking (37). In contrast, NRP2b terminates in SHC, which has not been reported to interact with PDZ domains. As expected, we found that NRP2a coprecipitated with GIPC1, whereas NRP2b did not. We then examined the effect of the cytoplasmic segments and GIPC1 binding on migration rescue after knockdown of endogenous total NRP2. One possible scenario was that the loss of GIPC1 binding by NRP2a might convert the molecule into a promigratory form like NRP2b. However, both wild-type NRP2a and its cytoplasmic deletion mutant failed to rescue migration. On the other hand, deletion of the NRP2b cytoplasmic domain only partially impaired its ability to rescue migration, whereas forced GIPC1 binding by the addition of a C-terminal SEA motif resulted in a complete loss of activity. These results suggest that the unique promigratory activity of NRP2b is a function of its distinct C terminus, including the juxtamembrane, transmembrane, and cytoplasmic domains, as well as the absence of GIPC1 binding. NRP2a has been implicated in receptor endocytosis and endosome maturation (54), although the role of GIPC1 in this process was not addressed. How NRP2b differs in this regard will be a subject for future studies.
GIPC1 was originally isolated by its interaction with GAIP (RGS19), a guanosine triphosphatase activating protein for heterotrimeric G proteins (55, 56). Subsequent studies demonstrated that GIPC1 interacts with a variety of transmembrane proteins, including receptors and integrins. For NRP1 and VEGF receptor 2, persistent complex formation after VEGF stimulation was dependent on GIPC1 (57), and NRP1-dependent angiogenesis was shown to require GIPC1 and the PDZ domain–interacting motif of NRP1 (58). For another receptor, lysophosphatidic acid receptor 1, deleting GIPC1 slowed inward trafficking and was associated with increased phospho-AKT, migration, and proliferation (37). GIPC1 has also been shown to affect AKT activation through its interaction with insulin like growth factor 1 receptor (IGF1R) during mammalian eye development (59). However, for the nerve growth factor receptor, TrkA, GIPC1 overexpression inhibited the phosphorylation of ERK, but had no detectable effect on AKT (56). Thus, the effect of GIPC1 interaction is context-dependent. Although the loss of GIPC1 bindingby NRP2a failed toconvert it into a promigratory molecule, whether the observed anti-tumorigenic effects of NRP2a are GIPC1-dependent is presently unknown.
Previously, it was reported that NRP1 interacted with PTEN in an SEA-dependent manner (38). On the basis of the extensive similarity between NRP1 and NRP2a, we hypothesized that NRP2a would interact with PTEN, whereas NRP2b would not. This was confirmed for NRP2a by coimmunoprecipitation. However, although the amount of PTEN bound by NRP2b was markedly less, it was clearly present compared to background binding. We reasoned that this might occur if NRP2b formed heterodimers with endogenous NRP2a, which was confirmed by reciprocal coprecipitation of Flag-tagged NRP2a and untagged NRP2b. Thus, the reduced interaction of PTEN with NRP2b may explain why this isoform was specifically associated with AKT activation by HGF. How much of the protumorigenic effects of NRP2b are dependent on the relative lack of PTEN recruitment is an important future avenue of investigation. During preparation of this manuscript, PTEN binding by NRP2 was reported by Nakayama et al. (60). Thus, our results confirm this finding and further extend the observation to differential PTEN binding by NRP2a versus NRP2b.
In summary, NRP2 isoforms can have markedly different effects on tumor biology, and NRP2b expression may be closely linked with lung cancer development or progression. These results also suggest that NRP2b may represent a therapeutic target, although more knowledge regarding its expression and function on vascularity, other stromal components, and immune cells will be required. Targeting NRP2b specifically would have the advantage of blocking its protumorigenic properties while preserving the observed antitumor effects of NRP2a. In addition, TGFβ-induced EMT plays a major role in inflammation, fibrosis, and normal development, where NRP2b may be similarly important.
MATERIALS AND METHODS
Cell lines, tissue culture, and reagents
Validated cell lines were obtained from the University of Colorado Specialized Program of Research Excellence (SPORE) (Aurora, CO; NCI-H358, NCI-H157, A549, HCC827, HCC4006, and HCC2279) and from the Moffitt Cancer Center (Tampa, FL; PC-9 and HCC4006-ER). Lines were cultured in RPMI 1640 under standard conditions and periodically verified by allele analysis. Selections used puromycin (2 μg/ml; lentiviral transfections) or hygromycin (100 μg/ml) and blasticidin (5 μg/ml; for Flp-In T-REx lines). TGFβ was provided by P. Howe (Medical University of South Carolina); gefitinib was obtained from AstraZeneca Pharmaceuticals; other specialty chemicals (cycloheximide, crystal violet, diaminobenzidine, methylcellulose, DyeCycle Violet, and PHA665752) were obtained from commercial sources. EGFR tyrosine kinase inhibitor (TKI)–resistant cells were generated from gefitinib-sensitive lines, HCC2279, PC-9, and HCC827, by continuous culture at their respective IC50 for gefitinib (50, 50, and 3 nM, respectively). Resistance was monitored by MTS viability assays according to the suppliers’ instruction (Promega Inc). Antibodies included phospho-SMAD2, vimentin, phospho-MET-Y1234/5, total MET, phospho-AKT-S473, pan-AKT, phospho-ERK1/2 (T202 and Y204), PTEN, and PD-L1(Cell Signaling Inc); fibronectin and E-cadherin (BD Transduction Laboratories); pan-cytokeratin (Invitrogen); total NRP2 (R&D Systems); β-actin and FlagM2 (Sigma-Aldrich); HA-Y11 (Santa Cruz Biotechnology); GIPC1 (Proteus); GFP (GeneTex); and ERK1/2 (Promega). The NRP2b-specific antibody 9080 was generated by Pacific Immunology.
shRNAs, expression constructs, and protein analyses
Isoform-specific hairpins (table S4) were designed using the BLOCK-iT tool (Life Technologies Inc.), cloned into pLKO.1, packaged into lentivirus, and tested for efficacy. The NRP2a clone W22c11 (variant 1) was obtained from G. Neufeld (Technion – Israel Institute of Technology). A nonconservative missense mutation, L180P, was corrected using QuikChange according to the manufacturer’s instructions (Stratagene Inc.). Xba I–cleaved NRP2a was cloned into pcDNA5/FRT/TO. The NRP2b(0) (variant 5) was cloned using RT-PCR amplification and replacement of a corresponding Not I fragment from NRP2a. Site-specific mutations included synonymous changes in the shNRP2-1 (TRCN0000063308) seed sequence, deletions of the cytoplasmic domains (ΔCYT), conversion of six terminal amino acids of NRP2b to match NRP2a, creating a GIPC1 binding motif (NRP2b + SEA), and insertion of Flag HA tandem affinity purification tags at the N terminus of each isoform. Mutagenic primer sequences are listed in table S4; all mutants were sequence verified. Western blots were performed as described previously (17). Densitized images were analyzed using ImageJ. Additional constructs included pcDNA4/HisMax-Synectin (mGipc1) (61) and pEGFP-PTEN (62), which are gifts from A. Horowitz and A. Ross, respectively (AddGene plasmids 35943 and 13039).
Immunofluorescence and immunohistochemistry
Ibidi microwell plates seeded with H358 and H157 cells were treated with dox or vehicle for 24 hours, fixed with 4% paraformaldehyde, and incubated with primary NRP2 antibodies for 2 hours. After incubation with Alexa488 donkey anti-goat antibodies, cells were mounted and imaged on a CARV II confocal fluorescence imager (BD Biosciences). Formalin-fixed paraffin-embedded tumor tissues mounted on TMAs were sectioned, mounted, and processed for immunohistochemistry, as described previously (17). Each sample was scored (from 0 to 300) by multiplying the percentage of positive cells (0 to 100%) by the average staining intensity (0 to 3).
RNA isolation and real-time RT-PCR
RNA was purified using Qiagen RNeasy kits. Superscript III cDNA synthesis (Invitrogen Inc.) and SYBR Green FAST qRT-PCR (ABI Inc.) were performed as recommended by the manufacturers. Products of isoform-specific primer pairs (table S4) were sequence-verified. Results are reported as the percentage of glyceraldehyde-3-phosphate dehydrogenase (GAPDH) using the formula: %GAPDH = (2−ΔCt) × 100. Sucrose gradient purification of polysome-associated RNA was performed as described (17).
Migration, invasion, and tumorsphere assays
Transwell migration and invasion assays were performed as described (17) using 5% fetal calf serum as the chemoattractant in the lower chamber. Each condition was performed in triplicate with five counted fields per filter. Where indicated, the MET inhibitor PHA-665752 was added to 100 nM. Trypan blue–excluding cells (200 cells per well) were cultured in MethoCult methylcellulose CSC medium in 96-well, ultra-low attachment plates to form tumorspheres (63). Cultures were incubated for 2 to 3 weeks with refeeding every 3 to 4 days and photographed. Spheroids with >50 cells were counted. DyeCycle Violet (Molecular Imaging/Invitrogen) negative side-population cells were sorted by flow cytometry into 96-well ultra-low attachment plates containing CSC medium and similarly assayed for tumorsphere-forming capacity.
Immunoprecipitations
NRP2a or NRP2b expressing H358 Flp-In T-REx or HEK293 cells were transiently transfected with constructs expressing mGipc1 or GFP-PTEN. The following day, cells were split; some plates were dox-induced for 48 hours to express high NRP2 isoforms. Protein lysates in radio immunoprecipitation assay (RIPA) buffer (200 to 400 μg of protein) were tumbled overnight at 4°C with primary antibodies or control immunoglobulins along with 10 μl of prewashed Protein G Dynabeads. Beads were washed three times with fresh RIPA buffer and coprecipitating proteins analyzed by Western blot.
Xenografts and statistical methods
Subcutaneous xenografts were generated as previously described (17). Orthotopic xenografts were generated by direct injection of cells into the right lung of immunocompromised female NU/J (Foxn1nu/nu) mice using an established protocol (64). In both cases, H358 cells were used, bearing either total or isoform-specific NRP2 knockdowns or with endogenous NRP2 knockdown and isoform-specific rescue. For orthotopic tumors, the inner surface of the thoracic cavity was colonized by tumor deposits that were photographed and counted. Counts were scaled to 1: ≤10 mets, 2: between 10 and 20 mets, and 3: >20 mets, then divided by the number of weeks to generate the metastatic index. Kaplan-Meier methods were used to generate survival curves; survival distributions were compared between groups with the log-rank test. The number of metastatic deposits per animal were averaged within groups and compared using two-sample t tests. Pairwise comparisons of the metastatic index used one-way ANOVA modeling and Tukey’s highly significant difference test. Immunohistochemical staining for NRP2 and NRP2b from the 110-case TMA was tabulated. Multivariable logistic regression modeling, adjusted for age and sex, determined the association of tumor stage with NRP2 and NRP2b staining, categorized as high and low, with >10% and >50% as cutoffs. The cutoffs for percent stain in the logistic regressions were based on plots assessing linearity in the logit. These plots were constructed by dividing the independent variables (%stained) into percentiles (quartiles) and calculating the logit of the probability of being stage 3 to 4 within each percentile and then plotting those values against the percentile midpoints. Percent stain was categorized due to nonlinearity in these plots. For the 436 tumor TMA, PFS was modeled using Cox proportional hazard regression, adjusted for stage, grade, smoking status, age, and histology. Progression was defined as disease recurrence or death from any cause. All significance tests were two-sided and used an α level of 0.05.
Supplementary Material
Fig. S1. Sequence alignments of NRP2b with NRP2a and NRP1.
Fig. S2. Development and validation of NRP2 isoform-specific shRNAs.
Fig. S3. Development and validation of NRP2b-specific antibody 9080.
Fig. S4. NRP2b inhibits proliferation in vitro and in vivo.
Fig. S5. Immunohistochemical staining of human lung tumors with NRP2 antibodies.
Table S1. Patient characteristics and histology of the 436-case TMA.
Table S2. Patient characteristics and histology of the 110-case BioMax Inc. TMA.
Table S3. Secretome analysis of TGFβ-exposed H358 cells.
Table S4. Oligonucleotide sequences used in this study.
Acknowledgments
We thank G. Neufeld for providing an NRP2a expression plasmid and A. Horowitz and A. Ross for providing the mGipc and GFP-PTEN expression plasmids, respectively (AddGene Inc.). We thank M. Romano for the tissue preparation and sectioning and P. Howe [Medical University of South Carolina (MUSC)] for providing TGFβ.
Funding: This work was supported in part by funding from the National Cancer Institute and Veterans Administration (#HHSN261201200043C to R.M.G. and #BX003333-01A2 to H.A.D., respectively) and by the Hollings Cancer Center, MUSC (P30 CA138313) through the Biostatistics, Biorepository and Tissue Analysis, Cell and Molecular Imaging, Flow Cytometry and shRNA Technology shared resources. F.C., L.L., and A.D. were supported by the Italian Association for Cancer Research and Istituto Toscano Tumori.
Footnotes
SUPPLEMENTARY MATERIALS
www.sciencesignaling.org/cgi/content/full/10/462/eaag0528/DC1
Author contributions: R.M.G., P.N., and H.A.D. designed the project and wrote the manuscript; R.M.G., P.N., J.N-M., and H.A.D. performed the experiments; F.C., L.L., and A.D. prepared and analyzed the TMAs; H.U., T.Y., and E.B.H. provided resistant tumor samples or cell lines and analyzed the results; K.A. performed all statistical analyses.
Competing interests: The authors declare that they have no competing interests.
Data and materials availability: Plasmids will be made available through AddGene Inc.
REFERENCES AND NOTES
- 1.Torre LA, Bray F, Siegel RL, Ferlay J, Lortet-Tieulent J, Jemal A. Global cancer statistics, 2012. CA Cancer J Clin. 2015;65:87–108. doi: 10.3322/caac.21262. [DOI] [PubMed] [Google Scholar]
- 2.Mani SA, Guo W, Liao MJ, Eaton EN, Ayyanan A, Zhou AY, Brooks M, Reinhard F, Zhang CC, Shipitsin M, Campbell LL, Polyak K, Brisken C, Yang J, Weinberg RA. The epithelial-mesenchymal transition generates cells with properties of stem cells. Cell. 2008;133:704–715. doi: 10.1016/j.cell.2008.03.027. [DOI] [PMC free article] [PubMed] [Google Scholar]
- 3.Pattabiraman DR, Weinberg RA. Tackling the cancer stem cells—What challenges do they pose? Nat Rev Drug Discov. 2014;13:497–512. doi: 10.1038/nrd4253. [DOI] [PMC free article] [PubMed] [Google Scholar]
- 4.Singh A, Settleman J. EMT, cancer stem cells and drug resistance: An emerging axis of evil in the war on cancer. Oncogene. 2010;29:4741–4751. doi: 10.1038/onc.2010.215. [DOI] [PMC free article] [PubMed] [Google Scholar]
- 5.Bremnes RM, Veve R, Gabrielson E, Hirsch FR, Baron A, Bemis L, Gemmill RM, Drabkin HA, Franklin WA. High-throughput tissue microarray analysis used to evaluate biology and prognostic significance of the E-cadherin pathway in non-small-cell lung cancer. J Clin Oncol. 2002;20:2417–2428. doi: 10.1200/JCO.2002.08.159. [DOI] [PubMed] [Google Scholar]
- 6.Prudkin L, Liu DD, Ozburn NC, Sun M, Behrens C, Tang X, Brown KC, Nebiyou Bekele B, Moran C, Wistuba II. Epithelial-to-mesenchymal transition in the development and progression of adenocarcinoma and squamous cell carcinoma of the lung. Mod Pathol. 2009;22:668–678. doi: 10.1038/modpathol.2009.19. [DOI] [PMC free article] [PubMed] [Google Scholar]
- 7.Nieto MA. Epithelial plasticity: A common theme in embryonic and cancer cells. Science. 2013;342:1234850. doi: 10.1126/science.1234850. [DOI] [PubMed] [Google Scholar]
- 8.Roche J, Boldog F, Robinson M, Robinson L, Varella-Garcia M, Swanton M, Waggoner B, Fishel R, Franklin W, Gemmill R, Drabkin H. Distinct 3p21.3 deletions in lung cancer and identification of a new human semaphorin. Oncogene. 1996;12:1289–1297. [PubMed] [Google Scholar]
- 9.Giger RJ, Rowe Urquhart E, Gillespie SKH, Levengood DV, Ginty DD, Kolodkin AL. Neuropilin-2 is a receptor for semaphorin IV: Insight into the structural basis of receptor function and specificity. Neuron. 1998;21:1079–1092. doi: 10.1016/s0896-6273(00)80625-x. [DOI] [PubMed] [Google Scholar]
- 10.Potiron VA, Sharma G, Nasarre P, Clarhaut JA, Augustin HG, Gemmill RM, Roche J, Drabkin HA. Semaphorin SEMA3F affects multiple signaling pathways in lung cancer cells. Cancer Res. 2007;67:8708–8715. doi: 10.1158/0008-5472.CAN-06-3612. [DOI] [PubMed] [Google Scholar]
- 11.Kusy S, Nasarre P, Chan D, Potiron V, Meyronet D, Gemmill RM, Constantin B, Drabkin HA, Roche J. Selective suppression of in vivo tumorigenicity by semaphorin SEMA3F in lung cancer cells. Neoplasia. 2005;7:457–465. doi: 10.1593/neo.04721. [DOI] [PMC free article] [PubMed] [Google Scholar]
- 12.Lantuéjoul S, Constantin B, Drabkin H, Brambilla C, Roche J, Brambilla E. Expression of VEGF, semaphorin SEMA3F, and their common receptors neuropilins NP1 and NP2 in preinvasive bronchial lesions, lung tumours, and cell lines. J Pathol. 2003;200:336–347. doi: 10.1002/path.1367. [DOI] [PubMed] [Google Scholar]
- 13.Clarhaut J, Gemmill RM, Potiron VA, Ait-Si-Ali S, Imbert J, Drabkin HA, Roche J. ZEB-1, a repressor of the semaphorin 3F tumor suppressor gene in lung cancer cells. Neoplasia. 2009;11:157–166. doi: 10.1593/neo.81074. [DOI] [PMC free article] [PubMed] [Google Scholar]
- 14.Atwal JK, Singh KK, Tessier-Lavigne M, Miller FD, Kaplan DR. Semaphorin 3F antagonizes neurotrophin-induced phosphatidylinositol 3-kinase and mitogen-activated protein kinase kinase signaling: A mechanism for growth cone collapse. J Neurosci. 2003;23:7602–7609. doi: 10.1523/JNEUROSCI.23-20-07602.2003. [DOI] [PMC free article] [PubMed] [Google Scholar]
- 15.Nasarre P, Gemmill RM, Drabkin HA. The emerging role of class-3 semaphorins and their neuropilin receptors in oncology. Onco Targets Ther. 2014;7:1663–1687. doi: 10.2147/OTT.S37744. [DOI] [PMC free article] [PubMed] [Google Scholar]
- 16.Soker S, Takashima S, Miao HQ, Neufeld G, Klagsbrun M. Neuropilin-1 is expressed by endothelial and tumor cells as an isoform-specific receptor for vascular endothelial growth factor. Cell. 1998;92:735–745. doi: 10.1016/s0092-8674(00)81402-6. [DOI] [PubMed] [Google Scholar]
- 17.Nasarre P, Gemmill RM, Potiron VA, Roche J, Lu X, Barón AE, Korch C, Garrett-Mayer E, Lagana A, Howe PH, Drabkin HA. Neuropilin-2 is upregulated in lung cancer cells during TGF-β1-induced epithelial-mesenchymal transition. Cancer Res. 2013;73:7111–7121. doi: 10.1158/0008-5472.CAN-13-1755. [DOI] [PMC free article] [PubMed] [Google Scholar]
- 18.Chen H, Chédotal A, He Z, Goodman CS, Tessier-Lavigne M. Neuropilin-2, a novel member of the neuropilin family, is a high affinity receptor for the semaphorins Sema E and Sema IV but not Sema III. Neuron. 1997;19:547–559. doi: 10.1016/s0896-6273(00)80371-2. [DOI] [PubMed] [Google Scholar]
- 19.Rossignol M, Gagnon ML, Klagsbruna M. Genomic organization of human neuropilin-1 and neuropilin-2 genes: Identification and distribution of splice variants and soluble isoforms. Genomics. 2000;70:211–222. doi: 10.1006/geno.2000.6381. [DOI] [PubMed] [Google Scholar]
- 20.Nakamura S, Yaguchi T, Kawamura N, Kobayashi A, Sakurai T, Higuchi H, Takaishi H, Hibi T, Kawakami Y. TGF-β1 in tumor microenvironments induces immunosuppression in the tumors and sentinel lymph nodes and promotes tumor progression. J Immunother. 2014;37:63–72. doi: 10.1097/CJI.0000000000000011. [DOI] [PubMed] [Google Scholar]
- 21.Walter AO, Sjin RTT, Haringsma HJ, Ohashi K, Sun J, Lee K, Dubrovskiy A, Labenski M, Zhu Z, Wang Z, Sheets M, St Martin T, Karp R, van Kalken D, Chaturvedi P, Niu D, Nacht M, Petter RC, Westlin W, Lin K, Jaw-Tsai S, Raponi M, Van Dyke T, Etter J, Weaver Z, Pao W, Singh J, Simmons AD, Harding TC, Allen A. Discovery of a mutant-selective covalent inhibitor of EGFR that overcomes T790M-mediated resistance in NSCLC. Cancer Discov. 2013;3:1404–1415. doi: 10.1158/2159-8290.CD-13-0314. [DOI] [PMC free article] [PubMed] [Google Scholar]
- 22.Pao W, Miller VA, Politi KA, Riely GJ, Somwar R, Zakowski MF, Kris MG, Varmus H. Acquired resistance of lung adenocarcinomas to gefitinib or erlotinib is associated with a second mutation in the EGFR kinase domain. PLOS Med. 2005;2:e73. doi: 10.1371/journal.pmed.0020073. [DOI] [PMC free article] [PubMed] [Google Scholar]
- 23.Engelman JA, Zejnullahu K, Mitsudomi T, Song Y, Hyland C, Park JO, Lindeman N, Gale CM, Zhao X, Christensen J, Kosaka T, Holmes AJ, Rogers AM, Cappuzzo F, Mok T, Lee C, Johnson BE, Cantley LC, Janne PA. MET amplification leads to gefitinib resistance in lung cancer by activating ERBB3 signaling. Science. 2007;316:1039–1043. doi: 10.1126/science.1141478. [DOI] [PubMed] [Google Scholar]
- 24.Zhang Z, Cheol Lee J, Lin L, Olivas V, Au V, LaFramboise T, Abdel-Rahman M, Wang X, Levine AD, Kyung Rho J, Jung Choi Y, Choi C-M, Kim S-W, Jin Jang S, Soo Park Y, Sung Kim W, Lee DH, Lee J-S, Miller VA, Arcila M, Ladanyi M, Moonsamy P, Sawyers C, Boggon TJ, Ma PC, Costa C, Taron M, Rosell R, Halmos B, Bivona TG. Activation of the AXL kinase causes resistance to EGFR-targeted therapy in lung cancer. Nat Genet. 2012;44:852–860. doi: 10.1038/ng.2330. [DOI] [PMC free article] [PubMed] [Google Scholar]
- 25.Sequist LV, Waltman BA, Dias-Santagata D, Digumarthy S, Turke AB, Fidias P, Bergethon K, Shaw AT, Gettinger S, Cosper AK, Akhavanfard S, Heist RS, Temel J, Christensen JG, Wain JC, Lynch TJ, Vernovsky K, Mark EJ, Lanuti M, Iafrate AJ, Mino-Kenudson M, Engelman JA. Genotypic and histological evolution of lung cancers acquiring resistance to EGFR inhibitors. Sci Transl Med. 2011;3:75ra26. doi: 10.1126/scitranslmed.3002003. [DOI] [PMC free article] [PubMed] [Google Scholar]
- 26.Witta SE, Gemmill RM, Hirsch FR, Coldren CD, Hedman K, Ravdel L, Helfrich B, Dziadziuszko R, Chan DC, Sugita M, Chan Z, Baron A, Franklin W, Drabkin HA, Girard L, Gazdar AF, Minna JD, Bunn PA., Jr Restoring E-cadherin expression increases sensitivity to epidermal growth factor receptor inhibitors in lung cancer cell lines. Cancer Res. 2006;66:944–950. doi: 10.1158/0008-5472.CAN-05-1988. [DOI] [PubMed] [Google Scholar]
- 27.Thomson S, Petti F, Sujka-Kwok I, Epstein D, Haley JD. Kinase switching in mesenchymal-like non-small cell lung cancer lines contributes to EGFR inhibitor resistance through pathway redundancy. Clin Exp Metastasis. 2008;25:843–854. doi: 10.1007/s10585-008-9200-4. [DOI] [PubMed] [Google Scholar]
- 28.Parvani JG, Schiemann WP. Sox4, EMT programs, and the metastatic progression of breast cancers: Mastering the masters of EMT. Breast Cancer Res. 2013;15:R72. doi: 10.1186/bcr3466. [DOI] [PMC free article] [PubMed] [Google Scholar]
- 29.Uramoto H, Iwata T, Onitsuka T, Shimokawa H, Hanagiri T, Oyama T. Epithelial-mesenchymal transition in EGFR-TKI acquired resistant lung adenocarcinoma. Anticancer Res. 2010;30:2513–2517. [PubMed] [Google Scholar]
- 30.Wang SE, Xiang B, Zent R, Quaranta V, Pozzi A, Arteaga CL. Transforming growth factor β induces clustering of HER2 and integrins by activating Src-focal adhesion kinase and receptor association to the cytoskeleton. Cancer Res. 2009;69:475–482. doi: 10.1158/0008-5472.CAN-08-2649. [DOI] [PMC free article] [PubMed] [Google Scholar]
- 31.Yao Z, Fenoglio S, Gao DC, Camiolo M, Stiles B, Lindsted T, Schlederer M, Johns C, Altorki N, Mittal V, Kenner L, Sordella R. TGF-β IL-6 axis mediates selective and adaptive mechanisms of resistance to molecular targeted therapy in lung cancer. Proc Natl Acad Sci USA. 2010;107:15535–15540. doi: 10.1073/pnas.1009472107. [DOI] [PMC free article] [PubMed] [Google Scholar]
- 32.Izumchenko E, Chang X, Michailidi C, Kagohara L, Ravi R, Paz K, Brait M, Hoque MO, Ling S, Bedi A, Sidransky D. The TGF β-miR200-MIG6 pathway orchestrates the EMT-associated kinase switch that induces resistance to EGFR inhibitors. Cancer Res. 2014;74:3995–4005. doi: 10.1158/0008-5472.CAN-14-0110. [DOI] [PMC free article] [PubMed] [Google Scholar]
- 33.Yoshida T, Song L, Bai Y, Kinose F, Li J, Ohaegbulam KC, Muñoz-Antonia T, Qu X, Eschrich S, Uramoto H, Tanaka F, Nasarre P, Gemmill RM, Roche J, Drabkin HA, Haura EB. ZEB1 mediates acquired resistance to the epidermal growth factor receptor-tyrosine kinase inhibitors in non-small cell lung cancer. PLOS ONE. 2016;11:e0147344. doi: 10.1371/journal.pone.0147344. [DOI] [PMC free article] [PubMed] [Google Scholar]
- 34.Chen L, Gibbons DL, Goswami S, Cortez MA, Ahn YH, Byers LA, Zhang X, Yi X, Dwyer D, Lin W, Diao L, Wang J, Roybal JD, Patel M, Ungewiss C, Peng D, Antonia S, Mediavilla-Varela M, Robertson G, Jones S, Suraokar M, Welsh JW, Erez B, Wistuba II, Chen L, Peng D, Wang S, Ullrich SE, Heymach JV, Kurie JM, Qin FXF. Metastasis is regulated via microRNA-200/ZEB1 axis control of tumour cell PD-L1 expression and intratumoral immunosuppression. Nat Commun. 2014;5:5241. doi: 10.1038/ncomms6241. [DOI] [PMC free article] [PubMed] [Google Scholar]
- 35.West DC, Rees CG, Duchesne L, Patey SJ, Terry CJ, Turnbull JE, Delehedde M, Heegaard CW, Allain F, Vanpouille C, Ron D, Fernig DG. Interactions of multiple heparin binding growth factors with neuropilin-1 and potentiation of the activity of fibroblast growth factor-2. J Biol Chem. 2005;280:13457–13464. doi: 10.1074/jbc.M410924200. [DOI] [PubMed] [Google Scholar]
- 36.Cai H, Reed RR. Cloning and characterization of neuropilin-1-interacting protein: A PSD-95/Dlg/ZO-1 domain-containing protein that interacts with the cytoplasmic domain of neuropilin-1. J Neurosci. 1999;19:6519–6527. doi: 10.1523/JNEUROSCI.19-15-06519.1999. [DOI] [PMC free article] [PubMed] [Google Scholar]
- 37.Varsano T, Taupin V, Guo L, Baterina OY, Jr, Farquhar MG. The PDZ protein GIPC regulates trafficking of the LPA1 receptor from APPL signaling endosomes and attenuates the cell’s response to LPA. PLOS ONE. 2012;7:e49227. doi: 10.1371/journal.pone.0049227. [DOI] [PMC free article] [PubMed] [Google Scholar]
- 38.Delgoffe GM, Woo SR, Turnis ME, Gravano DM, Guy C, Overacre AE, Bettini ML, Vogel P, Finkelstein D, Bonnevier J, Workman CJ, Vignali DA. Stability and function of regulatory T cells is maintained by a neuropilin-1-semaphorin-4a axis. Nature. 2013;501:252–256. doi: 10.1038/nature12428. [DOI] [PMC free article] [PubMed] [Google Scholar]
- 39.Hirata T, Takagi S, Fujisawa H. The membrane protein A5, a putative neuronal recognition molecule, promotes neurite outgrowth. Neurosci Res. 1993;17:159–169. doi: 10.1016/0168-0102(93)90092-5. [DOI] [PubMed] [Google Scholar]
- 40.He Z, Tessier-Lavigne M. Neuropilin is a receptor for the axonal chemorepellent Semaphorin III. Cell. 1997;90:739–751. doi: 10.1016/s0092-8674(00)80534-6. [DOI] [PubMed] [Google Scholar]
- 41.Kolodkin AL, Levengood DV, Rowe EG, Tai YT, Giger RJ, Ginty DD. Neuropilin is a semaphorin III receptor. Cell. 1997;90:753–762. doi: 10.1016/s0092-8674(00)80535-8. [DOI] [PubMed] [Google Scholar]
- 42.Kawasaki T, Kitsukawa T, Bekku Y, Matsuda Y, Sanbo M, Yagi T, Fujisawa H. A requirement for neuropilin-1 in embryonic vessel formation. Development. 1999;126:4895–4902. doi: 10.1242/dev.126.21.4895. [DOI] [PubMed] [Google Scholar]
- 43.Yuan L, Moyon D, Pardanaud L, Bréant C, Karkkainen MJ, Alitalo K, Eichmann A. Abnormal lymphatic vessel development in neuropilin 2 mutant mice. Development. 2002;129:4797–4806. doi: 10.1242/dev.129.20.4797. [DOI] [PubMed] [Google Scholar]
- 44.Guo HF, Vander Kooi CW. Neuropilin functions as an essential cell surface receptor. J Biol Chem. 2015;290:29120–29126. doi: 10.1074/jbc.R115.687327. [DOI] [PMC free article] [PubMed] [Google Scholar]
- 45.Cagnoni G, Tamagnone L. Semaphorin receptors meet receptor tyrosine kinases on the way of tumor progression. Oncogene. 2014;33:4795–4802. doi: 10.1038/onc.2013.474. [DOI] [PubMed] [Google Scholar]
- 46.Cooper CS, Park M, Blair DG, Tainsky MA, Huebner K, Croce CM, Vande Woude GF. Molecular cloning of a new transforming gene from a chemically transformed human cell line. Nature. 1984;311:29–33. doi: 10.1038/311029a0. [DOI] [PubMed] [Google Scholar]
- 47.Xiao GH, Jeffers M, Bellacosa A, Mitsuuchi Y, Vande Woude GF, Testa JR. Anti-apoptotic signaling by hepatocyte growth factor/Met via the phosphatidylinositol 3-kinase/Akt and mitogen-activated protein kinase pathways. Proc Natl Acad Sci USA. 2001;98:247–252. doi: 10.1073/pnas.011532898. [DOI] [PMC free article] [PubMed] [Google Scholar]
- 48.Delehedde M, Sergeant N, Lyon M, Rudland PS, Fernig DG. Hepatocyte growth factor/scatter factor stimulates migration of rat mammary fibroblasts through both mitogen-activated protein kinase and phosphatidylinositol 3-kinase/Akt pathways. Eur J Biochem. 2001;268:4423–4429. doi: 10.1046/j.1432-1327.2001.02363.x. [DOI] [PubMed] [Google Scholar]
- 49.Forte G, Minieri M, Cossa P, Antenucci D, Sala M, Gnocchi V, Fiaccavento R, Carotenuto F, De Vito P, Baldini PM, Prat M, Di Nardo P. Hepatocyte growth factor effects on mesenchymal stem cells: Proliferation, migration, and differentiation. Stem Cells. 2006;24:23–33. doi: 10.1634/stemcells.2004-0176. [DOI] [PubMed] [Google Scholar]
- 50.Ye M, Hu D, Tu L, Zhou X, Lu F, Wen B, Wu W, Lin Y, Zhou Z, Qu J. Involvement of PI3K/Akt signaling pathway in hepatocyte growth factor-induced migration of uveal melanoma cells. Invest Ophthalmol Vis Sci. 2008;49:497–504. doi: 10.1167/iovs.07-0975. [DOI] [PubMed] [Google Scholar]
- 51.Zhou HY, Wan KF, Ip CKM, Wong CKC, Mak NK, Wai Lo K, Wong AST. Hepatocyte growth factor enhances proteolysis and invasiveness of human nasopharyngeal cancer cells through activation of PI3K and JNK. FEBS Lett. 2008;582:3415–3422. doi: 10.1016/j.febslet.2008.09.004. [DOI] [PubMed] [Google Scholar]
- 52.Zhu A, Kang N, He L, Li X, Xu X, Zhang H. MiR-221 and miR-26b regulate chemotactic migration of MSCs toward HGF through activation of Akt and FAK. J Cell Biochem. 2016;117:1370–1383. doi: 10.1002/jcb.25428. [DOI] [PubMed] [Google Scholar]
- 53.Sulpice E, Plouët J, Bergé M, Allanic D, Tobelem G, Merkulova-Rainon T. Neuropilin-1 and neuropilin-2 act as coreceptors, potentiating proangiogenic activity. Blood. 2008;111:2036–2045. doi: 10.1182/blood-2007-04-084269. [DOI] [PubMed] [Google Scholar]
- 54.Dutta S, Roy S, Polavaram NS, Stanton MJ, Zhang H, Bhola T, Honscheid P, Donohue TM, Jr, Band H, Batra SK, Muders MH, Datta K. Neuropilin-2 regulates endosome maturation and EGFR trafficking to support cancer cell pathobiology. Cancer Res. 2016;76:418–428. doi: 10.1158/0008-5472.CAN-15-1488. [DOI] [PMC free article] [PubMed] [Google Scholar]
- 55.Katoh M. GIPC gene family (Review) Int J Mol Med. 2002;9:585–589. [PubMed] [Google Scholar]
- 56.Lou X, Yano H, Lee F, Chao MV, Farquhar MG. GIPC and GAIP form a complex with TrkA: A putative link between G protein and receptor tyrosine kinase pathways. Mol Biol Cell. 2001;12:615–627. doi: 10.1091/mbc.12.3.615. [DOI] [PMC free article] [PubMed] [Google Scholar]
- 57.Prahst C, Heroult M, Lanahan AA, Uziel N, Kessler O, Shraga-Heled N, Simons M, Neufeld G, Augustin HG. Neuropilin-1-VEGFR-2 complexing requires the PDZ-binding domain of neuropilin-1. J Biol Chem. 2008;283:25110–25114. doi: 10.1074/jbc.C800137200. [DOI] [PMC free article] [PubMed] [Google Scholar]
- 58.Wang L, Mukhopadhyay D, Xu X. C terminus of RGS-GAIP-interacting protein conveys neuropilin-1-mediated signaling during angiogenesis. FASEB J. 2006;20:1513–1515. doi: 10.1096/fj.05-5504fje. [DOI] [PubMed] [Google Scholar]
- 59.La Torre A, Hoshino A, Cavanaugh C, Ware CB, Reh TA. The GIPC1-Akt1 pathway is required for the specification of the eye field in mouse embryonic stem cells. Stem Cells. 2015;33:2674–2685. doi: 10.1002/stem.2062. [DOI] [PMC free article] [PubMed] [Google Scholar]
- 60.Nakayama H, Bruneau S, Kochupurakkal N, Coma S, Briscoe DM, Klagsbrun M. Regulation of mTOR signaling by semaphorin 3F-neuropilin 2 interactions in vitro and in vivo. Sci Rep. 2015;5:11789. doi: 10.1038/srep11789. [DOI] [PMC free article] [PubMed] [Google Scholar]
- 61.Naccache SN, Hasson T, Horowitz A. Binding of internalized receptors to the PDZ domain of GIPC/synectin recruits myosin VI to endocytic vesicles. Proc Natl Acad Sci USA. 2006;103:12735–12740. doi: 10.1073/pnas.0605317103. [DOI] [PMC free article] [PubMed] [Google Scholar]
- 62.Liu F, Wagner S, Campbell RB, Nickerson JA, Schiffer CA, Ross AH. PTEN enters the nucleus by diffusion. J Cell Biochem. 2005;96:221–234. doi: 10.1002/jcb.20525. [DOI] [PubMed] [Google Scholar]
- 63.Levina V, Marrangoni A, Wang T, Parikh S, Su Y, Herberman R, Lokshin A, Gorelik E. Elimination of human lung cancer stem cells through targeting of the stem cell factor-c-kit autocrine signaling loop. Cancer Res. 2010;70:338–346. doi: 10.1158/0008-5472.CAN-09-1102. [DOI] [PMC free article] [PubMed] [Google Scholar]
- 64.Onn A, Isobe T, Itasaka S, Wu W, O’Reilly MS, Hong WK, Fidler IJ, Herbst RS. Development of an orthotopic model to study the biology and therapy of primary human lung cancer in nude mice. Clin Cancer Res. 2003;9:5532–5539. [PubMed] [Google Scholar]
Associated Data
This section collects any data citations, data availability statements, or supplementary materials included in this article.
Supplementary Materials
Fig. S1. Sequence alignments of NRP2b with NRP2a and NRP1.
Fig. S2. Development and validation of NRP2 isoform-specific shRNAs.
Fig. S3. Development and validation of NRP2b-specific antibody 9080.
Fig. S4. NRP2b inhibits proliferation in vitro and in vivo.
Fig. S5. Immunohistochemical staining of human lung tumors with NRP2 antibodies.
Table S1. Patient characteristics and histology of the 436-case TMA.
Table S2. Patient characteristics and histology of the 110-case BioMax Inc. TMA.
Table S3. Secretome analysis of TGFβ-exposed H358 cells.
Table S4. Oligonucleotide sequences used in this study.