Abstract
Microbial degradation of myo-inositol hexakisphosphate (IP6) is crucial to deal with nutritional problems in monogastric animals as well as to prevent environmental phosphate pollution. The present study deals with the degradation of IP6 by microorganisms such as Sporosarcina spp. pasteurii, globiospora, psychrophila, Streptococcus thermophilus and Saccharomyces boulardii. These microbes were screened for phytase production under laboratory conditions. The specificity of the enzyme was tested for various phosphorylated substrates such as sodium phytate (IP6), sodium hexametaphosphate, phenyl phosphate, α-d-glucose-6 phosphate, inosine 5′ monophosphate and pyridoxal 5′ phosphate. These enzymes were highly specific to IP6. The influence of modulators such as phytochemicals and metal ions on the enzymatic activity was assessed. These modulators in different concentrations had varying effect on microbial phytases. Calcium (in optimal concentration of 0.5 M) played an important role in enzyme activation. The enzymes were then characterized based on their molecular weight 41~43 kDa. The phytase-producing microbes were assessed for IP6 degradation in a simulated intestinal setup. Among the selected microbes, Sporosarcina globiospora hydrolyzed IP6 effectively, as confirmed by colorimetric time-based analysis.
Electronic supplementary material
The online version of this article (10.1007/s13205-018-1302-3) contains supplementary material, which is available to authorized users.
Keywords: Probiotic, Phytate, Phytase, Extracellular, Phosphate
Introduction
Myo-inositol hexakisphosphate (IP6) aka phytic acid is the principal storage form of phosphorus in plants. The salt form of phytic acid (also referred to as phytate) forms insoluble complexes with divalent and trivalent metal ions, thereby limiting mineral bioavailability and causing environmental phosphate pollution (Bohn et al. 2008). Monogastric animals such as swine, poultry, and fish produce a meager amount of endogenous phytases that is insufficient for phosphate utilization (Cowieson et al. 2016). To overcome this problem, phytases can be supplemented externally in animal feeds to hydrolyze IP6 into inositol and free phosphates (Kim et al. 2017). However, application of microbial phytases in commercially available animal feeds is associated with certain limitations such as high operation cost, proteolytic digestion, enzyme instability at varying pH and temperature (Bryden and Li 2010). Till date, there are only a few reports on phytase-producing probiotics (Lee et al. 2013; Askelson et al. 2014). Recently, a compilation of such probiotics including their characteristics and beneficial aspects was published (Priyodip et al. 2017).
Microbial phytases are of interest due to high substrate specificity, thermostability, catalytic efficiency, phosphate hydrolysis and low production cost (Chen et al. 2015). The structure information of the enzyme is vital for its functional role. Based on the available crystal structures, microbial phytases are classified into four, they are histidine acid phosphatases, β-propeller phytases, purple acid phytases and protein tyrosine phosphatases (Lei et al. 2013). The first class is commonly found in bacteria (Escherichia coli). These enzymes require EDTA as a cofactor for its activation. The second group of enzymes belonging to Bacillus amyloliquefaciens contains six Ca2+ ions in the active site for enzyme stimulation. The third group (homologous to Cyanobacteria) (Schenk et al. 2000) require cofactors such as Fe3+, Fe2+, Mn2+, and Zn2+ for its activation. The fourth class contains enzymes from Selenomonas ruminantium and require Pb2+ for catalysis (Gontia-Mishra and Tiwari 2013). All these characteristics make microbial phytases, an ideal candidate for feed-based applications (Yao et al. 2011).
There are extensive reports on IP6 degradation in animals (Heravi et al. 2016; Li and Shi 2016). However, there are very limited reports on in vivo and in vitro models for IP6 degradation (Markiewicz et al. 2016). Besides, there are studies to simulate gastrointestinal conditions (Nielsen et al. 2015; Nielsen and Meyer 2016). However, these models are ‘static’ and are associated with certain disadvantages. In contrast, there are ‘dynamic’ models (simulators) that aim at mimicking the gut physiology and operate with a continuous flow rate that may run for days or weeks (Aguirre and Venema 2017). These laboratory scale simulators are costly, lack technical clarity, and require periodic maintenance (Hur et al. 2011; Venema and van den Abbeele 2013). Recently, an in vitro chicken gut model was proposed to demonstrate the transfer of multidrug-resistant plasmids among bacteria (Card et al. 2017). Nevertheless, there are no models to assess IP6 degradation in an in vitro gut model. Hence, we propose a cost-effective gut model for assessing microbial IP6 degradation.
Materials and methods
Cultivation of microorganisms
Microorganisms such as Sporosarcina pasteurii 1761, Sporosarcina globiospora 2908, and Sporosarcina psychrophila 4776 were procured from Microbial Type Culture Collection (MTCC), Institute of Microbial Technology, Chandigarh, India. Besides, Streptococcus thermophilus 2412 was obtained from the National Collection of Industrial Microorganisms (NCIM), National Chemical Laboratory (NCL) Pune, India. Apart from these bacteria, a commercially available yeast—Saccharomyces boulardii, (branded as ‘gNorm’ available in 282.5 mg sachet) was purchased from Vijaya Medicals, Manipal, India. The bacteria were revived in MRS and nutrient medium, whereas the yeast was grown in potato dextrose medium (YPD). All the microbial cultures were incubated at 37 °C under an agitation speed of 200 rpm and allowed to grow overnight. Simultaneously, they were also maintained in phytase screening medium (PSM).
Phytase screening
PSM proposed by Howson and Davis (1983) was modified in the present study by replacing dextrose with IP6 as the sole carbon source. The components of the medium per 100 mL is given as follows: 0.2% MgSO4 (Himedia, Mumbai), 0.5% (NH4)2SO4 (Merck, Bangalore), 0.01% NaCl (Merck, Bangalore), 0.01% KCl (Loba Chemie, Mumbai), 0.01% MnSO4 (Himedia, Mumbai), 0.01% FeSO4 (Loba Chemie, Mumbai) and 0.5% calcium phytate (Himedia, Mumbai). A microbial suspension of 100 µL was inoculated on PSM agar plates and incubated at 37 °C for 24 h. The appearance of IP6 hydrolytic zones around the point of inoculation is perceived as a positive result. The experiment was performed in triplicates and the average diameters of these zones were observed and documented.
Total protein estimation
A loop full of inoculum (grown in PSM) was transferred to 50 mL of PSM broth and incubated in a rotary shaker at 200 rpm for 24–48 h. It was then centrifuged at 10000 rpm for 10 min at 4 °C. The pellet was discarded and the supernatant containing crude phytases was subjected to Bradford’s assay (Bradford 1976) to estimate the total protein content.
Substrate specificity and enzyme kinetics
The degradation of IP6 was quantitatively estimated by ammonium molybdate method (Bae et al. 1999). The reaction mixture consists of 6.25 mM IP6 as substrate, and the reaction was stopped after 30 min. To this, a freshly prepared color reagent was added. The resultant color change was estimated at 700 nm. These experiments were conducted in triplicates and their mean absorbance was used for calculating their substrate specificity and enzyme kinetics. The specificity of various substrates such as IP6, sodium hexametaphosphate, phenyl phosphate, α-d-glucose-6 phosphate, inosine 5′ monophosphate and pyridoxal 5′ phosphate were assessed. The extracellular enzymes followed Michaelis–Menten kinetics and the corresponding parameters such as Km and Vmax were calculated. Where “one unit of phytase is defined as the amount of enzyme required to liberate one µmol of phosphate per min”. The influence of modulators such as sodium, potassium, citrate, and tartrate along with other metal ions such as calcium (Ca2+), copper (Cu2+), iron (Fe3+), and magnesium (Mg2+) at three different concentrations (0.05, 0.1 and 0.5 M) were studied.
Enzyme purification
The extracellular phytases in the supernatant were precipitated by 90% ammonium sulfate and ultrafiltered using membrane (Pellicon XL, Millipore, USA). The samples were further purified by passing through a manually designed chromatographic column packed with Sephadex-50 beads equilibrated with Tris–acetate buffer. The eluted fractions were pooled and subjected to 12% sodium dodecyl sulfate–polyacrylamide gel electrophoresis (SDS-PAGE). The separated proteins were stained using Coomassie brilliant blue R-250.
Simulated intestinal setup
The discarded waste of chicken (gut samples) was collected from the Century chicken shop, Manipal, India. The samples were incised carefully with a sterilized scalpel to include only the small intestinal segments (of jejunum and ileum). These segments were stored in ice packs (Polar Brick, Bangalore, India) and transported to the laboratory. The samples were thoroughly cleaned with deionized water (Millipore purification system, USA) and Gram’s staining was performed to infer the microbial population. The lumen was cleaned with phosphate buffered saline (PBS-0.1 M) (Khambualai et al. 2009), about 5–7 times until Gram’s staining revealed sterilized intestinal cavity. The specimens were placed in 0.9% sterilized saline solution (Merck, India), as it is better when compared to other chemicals such as dimethyl sulfoxide (Shivakumar et al. 2016). The sterile chicken gut was suspended (the bottom end was sealed with Parafilm) in a sterilized glass bottle (working volume 500 mL) filled with saline solution (maintained at pH 6.2). The setup was placed in an incubator maintained at 41 °C for simulating chicken body temperature. The overnight grown microbial cultures (~ 5 mL) in respective mediums such as NB, MRS, and YPD were inoculated in the gut model and the setup was incubated for 24 h. To examine IP6 degradation, the saline samples were collected periodically for every 30 min, up to 180 min. The experiments were performed in triplicates and the model does not involve animal handling. Moreover, the samples were collected from discarded waste and hence ethical approval was not required (Card et al. 2017).
Results and discussion
Microbial morphology
The morphological characteristics of the selected microorganisms are summarized in Table 1. The individual colonies of bacterial species were spherical, opaque and smooth, while for the yeast, the morphology was irregular.
Table 1.
Colony morphology of microbes and their enzyme characterization
| Microorganisms | Colony morphology | Phytase characteristics | ||||||||
|---|---|---|---|---|---|---|---|---|---|---|
| Shape | Size | Margin | Color | Surface texture | Elevation | Consistency | Opacity | Diameter of zone of phytate utilization (mm) | Molecular mass of phytase (kDa) | |
| Streptococcus thermophilus | Round | Small | Entire | Yellowish | Smooth | Raised | Creamy | Opaque | 26 ± 1 | 43 |
| Sporosarcina pasteurii | Round | Medium | Entire | White | Glistening | Convex | Creamy | Opaque | 21 ± 1 | 42.6 |
| Sporosarcina globiospora | Round | Medium | Entire | White | Smooth | Convex | Creamy | Opaque | 23 ± 1 | 42 |
| Sporosarcina psychrophila | Round | Medium | Entire | White | Smooth | Convex | Dry | Translucent | 18 ± 1 | 41.5 |
| Saccharomyces boulardii | Irregular | Medium | Wavy | Creamy | Smooth | Raised | Wrinkled | Opaque | 20 ± 1 | 41 |
The experiments were performed in triplicates, average reading was used for interpretation; ‘±’ denotes the standard deviation
Phytase screening
The IP6 hydrolytic zone diameters range from 18 to 26 mm (Fig. 1) after 24 h. This demonstrated that the selected microbes produced extracellular phytases, in agreement with Sajidan et al. (2015) and Rocky-Salimi et al. (2016). The maximum zones obtained were 23 and 26 mm for Streptococcus thermophilus and Sporosarcina globiospora, respectively. These zones are smaller when compared to the one reported for Bacillus subtilis DR6 (Singh et al. 2013). However, in other reported Bacillus spp. the zone diameter was 11 mm even after 48 h of incubation (Demirkan et al. 2014). In the case of yeast, the zone produced is 20 mm, which is similar to Pichia kudriavzevii TY13 (Hellstrom et al. 2015). It was also observed that IP6 is a better carbon source when compared to the other phytase screening media, where glucose is normally used (Demirkan et al. 2014).
Fig. 1.
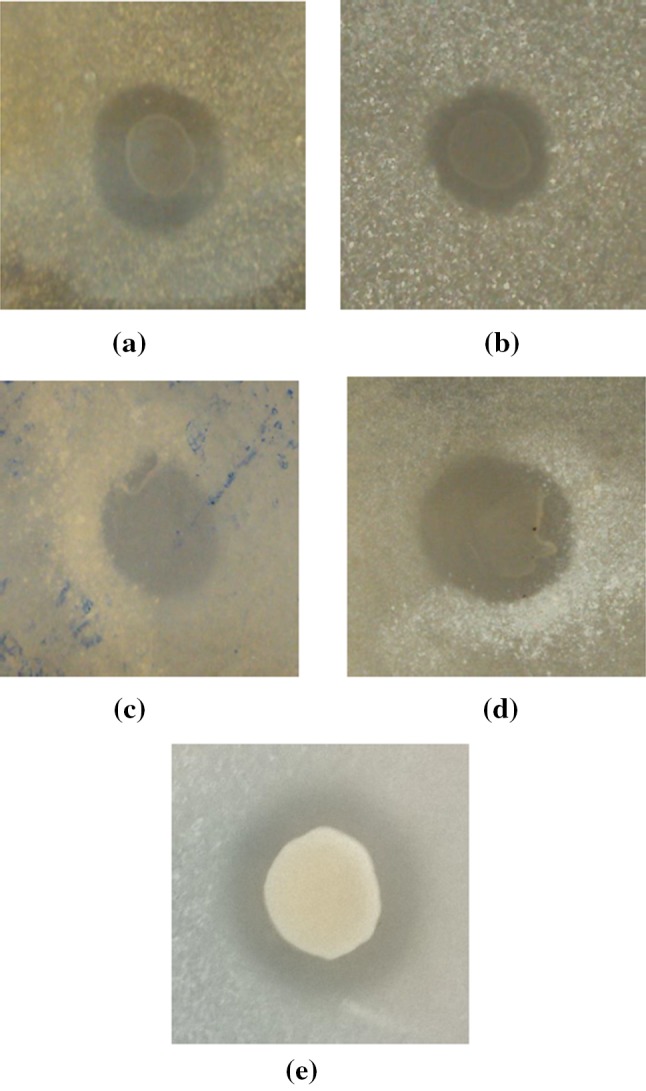
IP6 utilization patterns of a Streptococcus thermophilus, b Sporosarcina psychrophila, c Sporosarcina pasteurii, d Sporosarcina globiospora, and e Saccharomyces boulardii
Substrate specificity and enzyme characterization
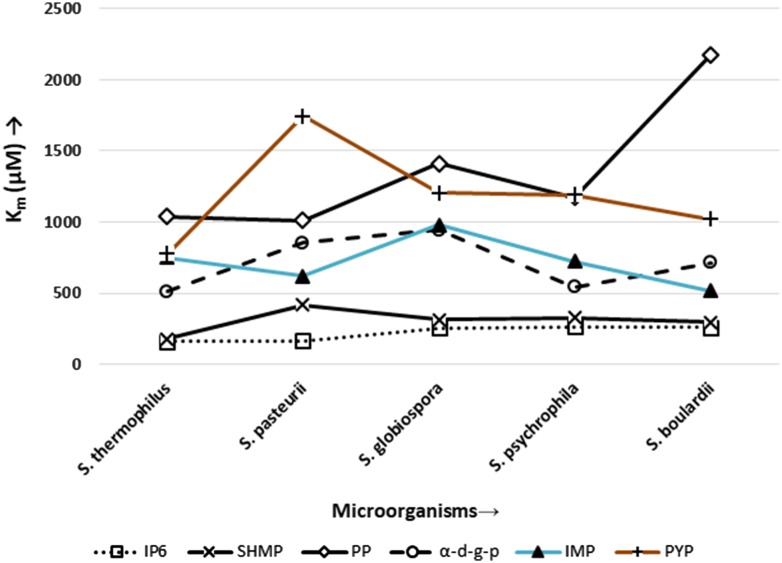
The microbial enzymes followed Michaelis–Menten kinetics. The kinetic parameters for these enzymes are shown in (Table 2; Fig. 2). They were highly specific to IP6 as indicated by their Km values. However, it also showed marginal activity towards other phosphorylated substrates. It was observed that the presence of IP6 in optimal concentration (6.25 mM) induced enzyme production. The specificity of Streptococcus thermophilus and Sporosarcina pasteurii were indicated by the Km values 163.01 and 168.27 µM, respectively. This is in contrast with the reported E. coli phytase, having higher Km 340 µM (Greiner and Farouk 2007). In the case of yeast, the Km value is 259.38 µM. The kinetic studies were followed by molecular separation that resulted in prominent bands ranging from 41 to 43 kDa (Table 1; Fig. 3).
Table 2.
Enzyme kinetics of microbial phytases
| Bacteria | Sodium phytate | Sodium hexametaphosphate | Phenyl phosphate | α-d-Glucose-6 phosphate | Inosine 5′ monophosphate | Pyridoxal 5′ phosphate | ||||||
|---|---|---|---|---|---|---|---|---|---|---|---|---|
| Km (µM) | Vmax (µM/min/mg) | Km (µM) | Vmax (µM/min/mg) | Km (µM) | Vmax (µM/min/mg) | Km (µM) | Vmax (µM/min/mg) | Km (µM) | Vmax (µM/min/mg) | Km (µM) | Vmax (µM/min/mg) | |
| Streptococcus thermophilus | 163.01 ± 5.91 | 139.19 ± 2.27 | 179.48 ± 8.80 | 252.85 ± 1.97 | 1039.89 ± 60.57 | 462.99 ± 6.23 | 512.24 ± 39.07 | 220.11 ± 4.11 | 750.06 ± 62.75 | 219.62 ± 6.30 | 778.81 ± 36.50 | 379.28 ± 9.62 |
| Sporosarcina pasteurii | 168.27 ± 4.60 | 358.16 ± 6.25 | 420.21 ± 9.67 | 720.71 ± 12.09 | 1010.98 ± 29.56 | 1300.47 ± 29.05 | 854.46 ± 65.12 | 782.66 ± 13.45 | 621.34 ± 30.03 | 780.59 ± 16.72 | 1746.14 ± 227.76 | 1112.18 ± 1.22 |
| Sporosarcina globiospora | 254.90 ± 8.52 | 564.47 ± 7.70 | 314.49 ± 11.47 | 859.70 ± 12.99 | 1411.61 ± 115.55 | 1449.02 ± 19.85 | 945.68 ± 99.28 | 844.17 ± 9.99 | 980.72 ± 82.54 | 895.82 ± 10.05 | 1203.58 ± 112.98 | 1356.79 ± 11.30 |
| Sporosarcina psychrophila | 266.11 ± 18.48 | 334.44 ± 3.44 | 327.79 ± 8.90 | 599.20 ± 8.38 | 1172.67 ± 119.18 | 961.95 ± 9.05 | 542.81 ± 25.76 | 697.08 ± 14.48 | 724.17 ± 61.11 | 621 ± 3.80 | 1191.15 ± 113.57 | 972.59 ± 9.82 |
| Saccharomyces boulardii | 259.38 ± 12.23 | 340.55 ± 4.22 | 295.09 ± 7.52 | 550.55 ± 18.45 | 2175.40 ± 233.56 | 974.23 ± 4.29 | 716.44 ± 43.03 | 637.37 ± 11.10 | 519.37 ± 2.48 | 616.86 ± 18.28 | 1022.43 ± 45.39 | 1035.52 ± 19.87 |
Fig. 2.
Substrate specificity studies of selected microorganisms; IP6 sodium phytate, SHMP sodium hexametaphosphate, PP phenyl phosphate, α-d-g-p α-d-glucose-6 phosphate, IMP inosine 5′ monophosphate, PYP pyridoxal 5′ phosphate
Fig. 3.
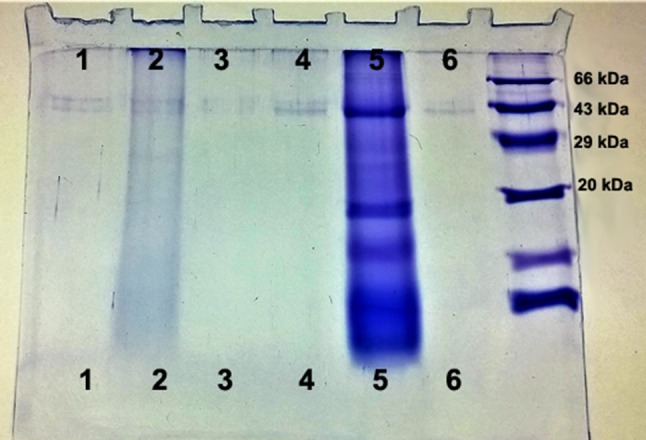
SDS-PAGE of enzymes. Lane 1: Streptococcus thermophilus, lane 2: Sporosarcina pasteurii, lane 3: Sporosarcina globiospora, lane 4: Saccharomyces boulardii, lane 5: crude enzyme, lane 6: Sporosarcina psychrophila, and lane 7: protein marker
Effect of modulators
The influence of natural chemicals such as citrate and tartrate as well as metal ions on microbial phytases was tabulated (Table S1). The presence of minerals in three different concentrations had a variable effect on enzyme activities. These ions in optimum concentrations act as cofactors stimulating catalytic activity, while at increasing concentrations they inhibit IP6 degradation due to saturation. The presence of modulators such as sodium, potassium, citrate, and tartrate (at a lower concentration of 0.05 M) did not have any impact on enzyme activity in Streptococcus thermophilus and Sporosarcina spp. pasteurii, globiospora and psychrophila. Phytase activity in Streptococcus thermophilus was stimulated by Ca2+ ions. This holds true for Sporosarcina spp. pasteurii and globiospora for all the three concentrations. This may be due to spore formation induced by Ca2+ ions during unfavorable environment. Other metal ions such as iron and copper at 0.5 M concentration partially stimulated enzyme activity in Streptococcus thermophilus, whereas at the same concentration citrate inhibited enzyme catalysis. However, the enzyme activity in Sporosarcina pasteurii was unaffected in the presence of 0.05 and 0.1 M magnesium, and potassium at 0.5 M concentration. Similarly, calcium, copper, and magnesium at lower concentration (0.05 M) failed to show enzyme activity in yeast.
IP6 degradation in a simulated intestinal setup
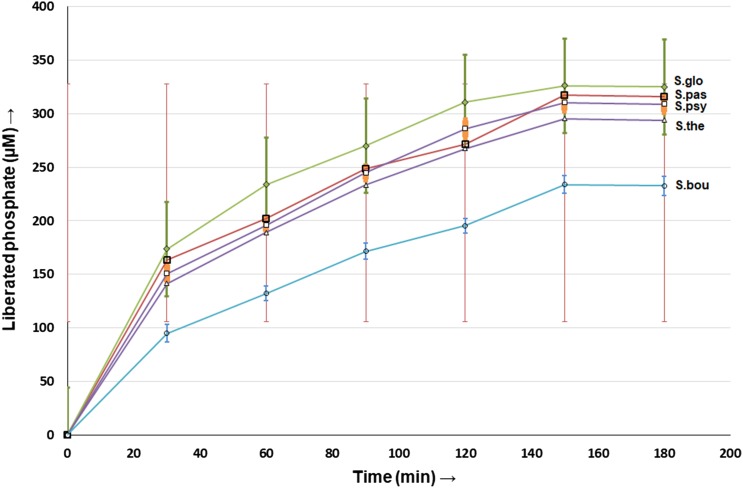
The setup is shown in (Fig. 4). The selected microbes were inoculated in the intestinal lumen, and the subsequent colonization was confirmed for Sporosarcina globiospora by Gram’s staining (Fig. 5). This also depicts that there is no cross-contamination in the intestinal setup. The microbes grown in PSM resulted in higher phytase activity due to IP6 degradation and in the process liberated free phosphates that were quantified from the diffused saline solution (Table S2, Fig. 6). Time-course analysis showed an increased phosphate liberation up to 150 min after which there is no additional phosphate release. This may be due to enzyme saturation. A similar trend was documented for Bifidobacterium spp. (Tamayo-Ramos et al. 2012).
Fig. 4.
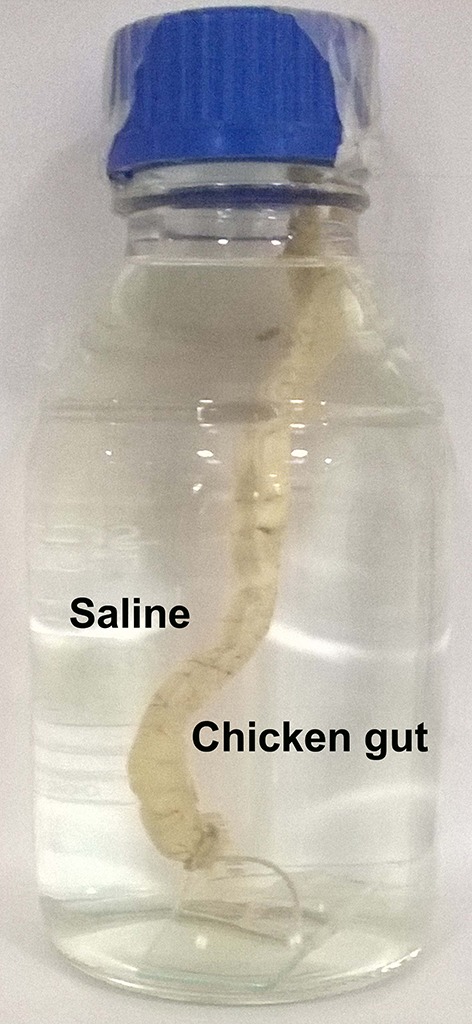
The simulated intestinal setup
Fig. 5.
Gram’s staining of Sporosarcina globiospora after 24 h of colonization in the intestinal lumen a foldscope (×140, resolution 1.8 µm), b light microscope-olympus CH20iBIMF (×1000, resolution 1 µm), c optical microscope-Nikon Eclipse LV-100 (×1000, resolution 500 nm)
Fig. 6.
Time-based analysis of IP6 hydrolysis for Saccharomyces boulardii (S. bou), Streptococcus thermophilus (S. the), Sporosarcina psychrophila (S. psy), Sporosarcina pasteurii (S. pas), and Sporosarcina globiospora (S. glo) cultured in PSM
Conclusions
Microbial enzymes from Sporosarcina spp. pasteurii, globiospora and psychrophila, Streptococcus thermophilus, and Saccharomyces boulardii were highly specific to IP6. These enzymes were characterized based on their specificity and molecular masses. It was found that the calcium ion plays a key role in stabilization and stimulation of catalytic activity of the enzyme in optimal concentration. The selected microorganisms efficiently degraded IP6 in the simulated gut model. Among the microorganisms studied, only Saccharomyces boulardii is well known for its commercial probiotic applications. Hence, further studies are required to validate the probiotic potential of other selected microorganisms.
Electronic supplementary material
Below is the link to the electronic supplementary material.
Acknowledgements
The corresponding author SB acknowledges the Grant received for using ‘Foldscope as a research tool’ (Category B) under the initiative of DBT-Prakash Labs. The funding was sanctioned by the Department of Biotechnology (DBT), Ministry of Science and Technology, Government of India (Sanction Order No. BT/IN/Indo-US/Foldscope/39/2015). We would also like to thank Dr. Peralam Yegneswaran Prakash, Associate Professor, Department of Microbiology, Kasturba Medical College, Manipal, for his timely inputs and help.
Compliance with ethical standards
Conflict of interest
The authors declare no conflict of interest.
Footnotes
Electronic supplementary material
The online version of this article (10.1007/s13205-018-1302-3) contains supplementary material, which is available to authorized users.
Contributor Information
Paul Priyodip, Email: priyodip.paul@learner.manipal.edu, Email: priyodip6@gmail.com.
Seetharaman Balaji, Email: s.balaji@manipal.edu, Email: biobalagi@gmail.com.
References
- Aguirre M, Venema K. Challenges in simulating the human gut for understanding the role of the microbiota in obesity. Benef Microbes. 2017;8(1):31–53. doi: 10.3920/BM2016.0113. [DOI] [PubMed] [Google Scholar]
- Askelson TE, Campasino A, Lee JT, Duong T. Evaluation of phytate-degrading Lactobacillus culture administration to broiler chickens. Appl Environ Microbiol. 2014;80(3):943–950. doi: 10.1128/AEM.03155-13. [DOI] [PMC free article] [PubMed] [Google Scholar]
- Bae HD, Yanke LJ, Cheng KJ, Selinger LB. A novel staining method for detecting phytase activity. J Microbiol Methods. 1999;39:17–22. doi: 10.1016/S0167-7012(99)00096-2. [DOI] [PubMed] [Google Scholar]
- Bohn L, Meyer AS, Rasmussen SK. Phytate: impact on environment and human nutrition. A challenge for molecular breeding. J Zhejiang Univ Sci B. 2008;9(3):165–191. doi: 10.1631/jzus.B0710640. [DOI] [PMC free article] [PubMed] [Google Scholar]
- Bradford MM. A rapid and sensitive method for the quantitation of microgram quantities of protein utilizing the principle of protein-dye binding. Anal Biochem. 1976;72(1–2):248–254. doi: 10.1016/0003-2697(76)90527-3. [DOI] [PubMed] [Google Scholar]
- Bryden WL, Li X. Amino acid digestibility and poultry feed formulation: expression, limitations and application. R Bras Zootec. 2010;39:279–287. doi: 10.1590/S1516-35982010001300031. [DOI] [Google Scholar]
- Card RM, Cawthraw SA, Nunez-Garcia J, Ellis RJ, Gemma K, Pallen MJ, Woodward MJ, Anjum MF. An in vitro chicken gut model demonstrates transfer of a multidrug resistance plasmid from Salmonella to commensal Escherichia coli. mBio. 2017;8:e00777-17. doi: 10.1128/mBio.00777-17. [DOI] [PMC free article] [PubMed] [Google Scholar]
- Chen CC, Cheng KJ, Ko TP, Guo RT. Current progresses in phytase research: three-dimensional structure and protein engineering. ChemBioEng Rev. 2015;2(2):76–86. doi: 10.1002/cben.201400026. [DOI] [Google Scholar]
- Cowieson AJ, Ruckebusch JP, Knap I, Guggenbuhl P, Fru-Nji F. Phytate-free nutrition: a new paradigm in monogastric animal production. Anim Feed Sci Tech. 2016;222:180–189. doi: 10.1016/j.anifeedsci.2016.10.016. [DOI] [Google Scholar]
- Demirkan E, Baygin E, Usta A. Screening of phytate hydrolysis Bacillus sp. isolated from soil and optimization of the certain nutritional and physical parameters on the production of phytase. Turk J Biochem. 2014;39(2):206–214. doi: 10.5505/tjb.2014.26817. [DOI] [Google Scholar]
- Gontia-Mishra I, Tiwari S. Molecular characterization and comparative phylogenetic analysis of phytases from fungi with their prospective applications. Food Technol Biotechnol. 2013;51(3):313–326. [Google Scholar]
- Greiner R, Farouk AE. Purification and characterization of a bacterial phytase whose properties make it exceptionally useful as a feed supplement. Protein J. 2007;26(7):467–474. doi: 10.1007/s10930-007-9086-z. [DOI] [PubMed] [Google Scholar]
- Hellstrom A, Qvirist L, Svanberg U, Vilg JV, Andlid T. Secretion of non-cell-bound phytase by the yeast Pichia kudriavzevii TY13. J Appl Microbiol. 2015;118(5):1126–1136. doi: 10.1111/jam.12767. [DOI] [PubMed] [Google Scholar]
- Heravi RM, Sankian M, Kermanshahi H, Nassiri MR, Moussavi AH, Nasiraii LR, Varasteh AR. Construction of a probiotic lactic acid bacterium that expresses acid-resistant phytase enzyme. J Agri Sci Tech. 2016;18(4):925–936. [Google Scholar]
- Howson SJ, Davis RP. Production of phytate-hydrolysing enzyme by some fungi. Enzyme Microb Technol. 1983;5(5):377–382. doi: 10.1016/0141-0229(83)90012-1. [DOI] [Google Scholar]
- Hur SJ, Lim BO, Decker EA, McClements DJ. In vitro human digestion models for food applications. Food Chem. 2011;125:1–12. doi: 10.1016/j.foodchem.2010.08.036. [DOI] [Google Scholar]
- Khambualai O, Yamauchi K, Tangtaweewipat S, Cheva-Isarakul B. Growth performance and intestinal histology in broiler chickens fed with dietary chitosan. Br Poult Sci. 2009;50(5):592–597. doi: 10.1080/00071660903247182. [DOI] [PubMed] [Google Scholar]
- Kim JH, Han GP, Shin JE, Kil DY. Effect of dietary calcium concentrations in phytase-containing diets on growth performance, bone mineralization, litter quality, and footpad dermatitis score in broiler chickens. Anim Feed Sci Technol. 2017;229:13–18. doi: 10.1016/j.anifeedsci.2017.04.008. [DOI] [PMC free article] [PubMed] [Google Scholar]
- Lee NK, Lee EK, Paik HD. Potential probiotic properties of phytase-producing Lactobacillus salivarius FC113. Ann Microbiol. 2013;63:555–560. doi: 10.1007/s13213-012-0503-y. [DOI] [Google Scholar]
- Lei XG, Weaver JD, Mullaney E, Ullah AH, Ajain MJ. Phytase, a new life for an “Old” enzyme. Annu Rev Anim Biosci. 2013;1:283–309. doi: 10.1146/annurev-animal-031412-103717. [DOI] [PubMed] [Google Scholar]
- Li Q, Shi Y. Feeding of phytase over-expressed Lactobacillus decreases fecal phosphate activity in chicken. Res J Biotechnol. 2016;11(3):9–16. doi: 10.1016/j.jbiotec.2016.02.004. [DOI] [Google Scholar]
- Markiewicz LH, Honke J, Haros M, Świątecka D, Wróblewska B. Diet shapes the ability of human intestinal microbiota to degrade phytate–in vitro studies. J Appl Microbiol. 2013;115(1):247–259. doi: 10.1111/jam.12204. [DOI] [PubMed] [Google Scholar]
- Nielsen AVF, Meyer AS. Phytate-mediated mineral solubilization from cereals under in vitro gastric conditions. J Sci Food Agric. 2016;96:3755–3761. doi: 10.1002/jsfa.7564. [DOI] [PubMed] [Google Scholar]
- Nielsen AVF, Nyffenegger C, Meyer AS. Performance of microbial phytases for gastric inositol phosphate degradation. J Agric Food Chem. 2015;63(3):943–950. doi: 10.1021/jf5050469. [DOI] [PubMed] [Google Scholar]
- Priyodip P, Prakash PY, Balaji S. Phytases of probiotic bacteria: characteristics and beneficial aspects. Indian J Microbiol. 2017;57(2):148–154. doi: 10.1007/s12088-017-0647-3. [DOI] [PMC free article] [PubMed] [Google Scholar]
- Rocky-Salimi K, Hashemi M, Safari M, Mousivand M. A novel phytase characterized by thermostability and high pH tolerance from rice phyllosphere isolated Bacillus subtilis B.S.46. J Adv Res. 2016;7:381–390. doi: 10.1016/j.jare.2016.02.003. [DOI] [PMC free article] [PubMed] [Google Scholar]
- Sajidan R, Sari EN, Ratriyanto A, Weldekiros H, Greiner R. Phytase-producing bacteria from extreme regions in Indonesia. Braz Arch Biol Technol. 2015;58(5):711–717. doi: 10.1590/S1516-89132015050173. [DOI] [Google Scholar]
- Schenk G, Korsinczky ML, Hume DA, Hamilton S, DeJersey J. Purple acid phosphatases from bacteria: similarities to mammalian and plant enzymes. Gene. 2000;255(2):419–424. doi: 10.1016/S0378-1119(00)00305-X. [DOI] [PubMed] [Google Scholar]
- Shivakumar SB, Bharti D, Subbarao RB, Jang SJ, Park JS, Ullah I, Park JK, Byun JH, Park BW, Rho GJ. DMSO and serum free cryopreservation of Wharton’s jelly tissue isolated from human umbilical cord. J Cell Biochem. 2016;117(10):2397–2412. doi: 10.1002/jcb.25563. [DOI] [PMC free article] [PubMed] [Google Scholar]
- Singh NK, Joshi DK, Gupta R. Isolation of phytase producing bacteria and optimization of phytase production parameters. Jundishapur J Microbiol. 2013;6(5):e6419. doi: 10.5812/jjm.6419. [DOI] [Google Scholar]
- Tamayo-Ramos JA, Sanz-Penella JM, Yebra MJ, Monedero V, Haros M. Novel phytases from Bifidobacterium pseudocatenulatum ATCC 27919 and Bifidobacterium longum subsp. infantis ATCC 15697. Appl Environ Microbiol. 2012;78(14):5013–5015. doi: 10.1128/AEM.00782-12. [DOI] [PMC free article] [PubMed] [Google Scholar]
- Venema K, van den Abbeele P. Experimental models of the gut microbiome. Best Pract Res Clin Gastroenterol. 2013;27:115–126. doi: 10.1016/j.bpg.2013.03.002. [DOI] [PubMed] [Google Scholar]
- Yao MZ, Zhang YH, Lu WL, Hu MQ, Wang W, Liang AH. Phytases: crystal structures, protein engineering and potential biotechnological applications. J Appl Microbiol. 2011;112(1):1–14. doi: 10.1111/j.1365-2672.2011.05181.x. [DOI] [PubMed] [Google Scholar]
Associated Data
This section collects any data citations, data availability statements, or supplementary materials included in this article.


