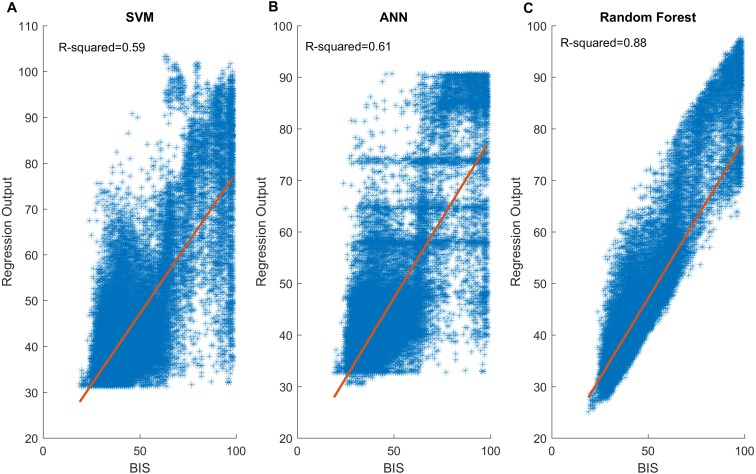
Figure 6. Scatter plots between BIS values and three model outputs.
A total of 33,895 data pairs come from 24 patients: (A) SVM output vs BIS; (B) ANN output vs BIS; (C) Random Forest output vs BIS. Generally, SVM and ANN present similar distribution. Both have close R2 values. Notably, the Random Forest (C) performs best. The output shows a strong linear relationship with the BIS gold standard. SVM, support vector machine; ANN, artificial neural network; BIS, bispectral index.

