Abstract
In this study, the acquisition of ASL data and quantification of multiple hemodynamic parameters was explored using a Magnetic Resonance Fingerprinting (MRF) approach. A pseudo-continuous ASL labeling scheme was used with pseudo-randomized timings to acquire the MRF ASL data in a 2.5 minute acquisition. A large dictionary of MRF ASL signals was generated by combining a wide range of physical and hemodynamic properties with the pseudo-random MRF ASL sequence and a two-compartment model. The acquired signals were matched to the dictionary to provide simultaneous quantification of cerebral blood flow, tissue time-to-peak, cerebral blood volume, arterial time-to-peak, B1, and T1 A study in seven healthy volunteers resulted in the following values across the population in grey matter (mean +/− standard deviation): cerebral blood flow of 69.1+/−6.1 ml/min/100g, arterial time-to-peak of 1.5+/−0.1s, tissue time-to-peak of 1.5+/−0.1s, T1 of 1634ms, cerebral blood volume of 0.0048+/−0.0005. The CBF measurements were compared to standard pCASL CBF estimates using a one-compartment model, and a Bland-Altman analysis showed good agreement with a minor bias. Repeatability was tested in five volunteers in the same exam session, and no statistical difference was seen. In addition to this validation, the MRF ASL acquisition’s sensitivity to the physical and physiological parameters of interest was studied numerically.
Keywords: MR Fingerprinting, Arterial Spin Labeling, Perfusion
1.0 Introduction
There is a compelling need for a robust, non-invasive tool for imaging hemodynamic parameters quantitatively, both in the clinical and research settings. Perfusion, blood volume, and transit time through the vascular tree serve as indicators of tissue health and its activity level. Applications include, but are not limited to, measurement of stroke severity [1–3], identification of extent and classification of brain tumors [4–6], and has been widely explored in other clinical applications [7]. Additionally, MRI-based perfusion techniques have important implications in other organs, such as the kidneys [8,9] and the lungs [10].
Contrast enhanced MR perfusion imaging requires the injection of gadolinium-based contrast agents, which can be undesirable due to potential contraindications [11,12] and an inability to quickly repeat the procedure due to the need for tracer clearance. An attractive alternative, Arterial Spin Labeling (ASL) also allows quantitative perfusion mapping without a need for tracer injections. Instead, radiofrequency (RF) magnetic pulses are utilized in ASL perfusion imaging to temporarily perturb the magnetization state of the spins in the blood upstream to the organ of interest. This perturbation effectively creates a bolus of an endogenous tracer (inverted magnetization in arterial blood) that can be detected downstream in the tissue of interest shortly afterward, as long as imaging is carried out before complete relaxation [13]. ASL can yield quantitative measures of perfusion metrics non-invasively, which due to the lack of injected Gadolinium contrast, can in turn be readily used to make comparisons across scanning sessions and scanner hardware, facilitating multi-center and longitudinal studies.
Although it has many potential advantages, ASL perfusion imaging is hampered by low signal to noise ratio (SNR) and by limited temporal and spatial resolution [14–16]. These challenges are most significant in the white matter [17], where perfusion rates are lower and arterial bolus arrival times are longer. Additionally, the quantification of perfusion from ASL is also difficult to perform in cases where the blood supply to the area is compromised, or where abnormalities in the vasculature do not conform to the simplified models sometimes used. To estimate perfusion with ASL methods, assumptions are made about several hemodynamic and physical tissue properties (such as bolus arrival time and cerebral blood volume). In the cases where these assumptions are no longer valid, these additional physiological parameters would need to be estimated in order to accurately quantify perfusion. These challenges prevent ASL from becoming a routine technique in the clinical setting despite the considerable positives.
In this study, the acquisition of ASL data and quantification of multiple hemodynamic parameters in addition to perfusion is explored using a Magnetic Resonance Fingerprinting (MRF) approach. MRF techniques have been recently shown to be very powerful for simultaneous quantification of multiple tissue properties [18,19] and results in combination with arterial spin labeling have shown promise [20–23]. MRF has been shown in other applications to be resilient to noise, which may help in addressing the challenges of low SNR with ASL acquisitions. Importantly, the MRF framework allows measurement of several tissue properties simultaneously and efficiently. Instead of making assumptions about how several hemodynamic and physical tissue properties affect the signal, an MRF approach may allow for simultaneous quantification of these properties. This would greatly improve the reliability of ASL in cases where the blood supply is compromised or there are vasculature abnormalities.
This study lays out the theory and error analysis for estimating T1, flip angle, perfusion, time-to-peak in the artery and tissue, and arterial blood volume from a single scan using an MRF approach for perfusion property mapping with ASL, and demonstrates the feasibility of the method in healthy volunteers.
2.0 Material and Methods
2.1 Theory and Experimental Design
The goal of this work was to design an MRF ASL experiment to simultaneously quantify several hemodynamic properties. There are two main components of designing and implementing an MRF-based technique. First, the MRF pulse sequence should produce signals that are unique for tissues with different combinations of tissue properties. In recent MRF techniques, the sequence is typically designed using pseudo-randomly varied sequence parameters [18]. Once the pulse sequence has been determined, the second step is to model the resulting signals accurately in order to create a dictionary of possible signals given the various possible combinations of tissue properties. Signal modeling requires incorporating knowledge of the pseudo-randomly varied sequence parameters and possible combinations of tissue properties. Once a sequence is designed and a dictionary is created, a pattern recognition algorithm can be used to match acquired tissue signals to a single dictionary entry, which will provide access to the incorporated tissue properties. This project focuses on adapting the MRF framework to measure perfusion and other ASL tissue properties, including the time-to-peak of the input bolus and arterial blood volume. In order to use an MRF approach to gain sensitivity to these parameters, the MRF ASL pulse sequence used was a pseudo-continuous arterial spin labeling (pCASL) scheme [24,25]. In traditional pCASL, the sequence typically uses a long label duration to provide maximal ASL signal change and a long post-label delay time (PLD) to ensure complete delivery of labeled spins to the tissue. A time series may be acquired by collecting multiple repetitions while holding the acquisition parameters constant [26]. MRF ASL applies labeling and control pulses with a pseudo-random duration to vary the timing of the arterial input function and vary the amount of endogenous tracer that reaches the tissue. Additionally, it is known that varying the post-label delay (PLD) influences the ASL signal, and long PLDs are typically employed in order to reduce the effect of the timing of the bolus (i.e., the arterial input function) arrival on the observed perfusion signal [27–29]. However, in the proposed MRF implementation, the PLD was selected to be a minimum value to more frequently sample the signal [21]. Finally, the occurrence of the labeling and control pulses can be randomized. This allows the randomization of the arterial input function, and for clearance and relaxation of labeled spins and tissue spins. By varying the frequency of labeling pulses, label duration, and PLD times, a random in-flow of labeled spins to the tissue is created over time, which should help yield the desired unique signals for different combinations of perfusion, time-to-peak in the artery and tissue, and arterial blood volume.
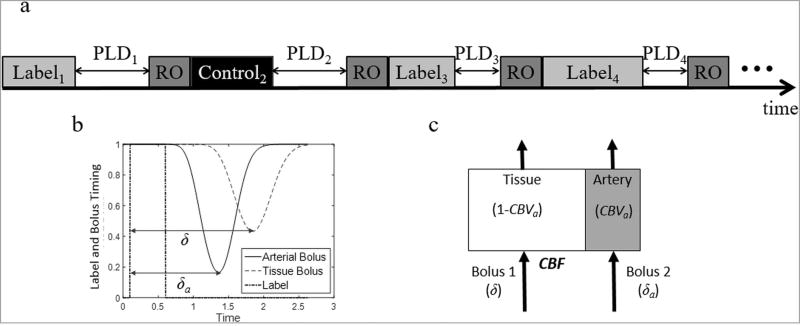
Several other sequence parameters could also be varied through the acquisition (such as flip angle, TR) [18], although these are not explored in this study. The MRF ASL pulse sequence is described in a simplified sequence diagram in Figure 1a.
Figure 1.
a. Simplified pulse sequence diagram for MRF ASL. The sequence consists of a series of pCASL acquisitions. For each acquisition, the label duration, post-label delay (PLD), and whether the acquisition uses a label or a control pulse are varied pseudo-randomly. After the label or control pulse and the post-label delay, a readout (RO) is used to collect a signal with a 60 degree flip angle and single-shot spiral trajectory. Figure 1b. Plot of label and bolus timing. A label pulse (0.5 second duration) is applied, and arterial magnetization is inverted. The simulated magnetization in the arterial compartment and tissue compartment are plotted with time-to-peak values of δa and δ, respectively. Figure 1c. For this work, each pixel is modeled with two compartments, artery and tissue. The fractional volume of the arterial compartment is described by the cerebral blood volume (CBVa). A bolus of labeled spin arrives to each compartment with an associated time-to-peak of δa for the arterial compartment and δ for the tissue compartment. The cerebral blood flow (CBF) is then defined as the rate at which the labeled blood arrives to the tissue compartment.
It is important to note that the MRF ASL sequence is substantially (and purposefully) different than standard pCASL acquisitions. The variable labeling frequency and pulse label durations allow creation of a variable input of labeled spins to the tissue of interest. By maintaining relatively short label durations and PLD, the evolution of the arterial and tissue signal is more frequently sampled [23]. The aim of this study is to demonstrate that this random variation allows for estimation of multiple relevant tissue properties contributing to that signal change.
Once a sequence is designed, the MRF ASL signals must be accurately modeled to generate a dictionary of all possible signals. We constructed a dictionary of possible observed signals based on a modification of the Bloch equations that include the effects of perfusion in a two compartment model [21,22]. The model consists of an arterial and a tissue compartment, and the cerebral blood volume weights the contribution of each compartment. Each compartment has its own input function and time-to-peak, which we define as the peak time of the impulse response function of the arterial tree as described below, following the approach of Chappell et al. [30]. Perfusion is then modeled as the flow rate per volume of tissue into the tissue compartment. The effect of the applied RF pulses and T1 relaxation were also included in the model along with magnetization transfer effects.
Thus, the differential equation for the longitudinal magnetization of the tissue compartment, Mt(t) can be written as:
| (Eqn 1) |
where f is the perfusion, R1 is the longitudinal relaxation rate of the tissue, and Ma,t(t) is the arterial magnetization input as described in Equation 3 below. The blood-brain partition coefficient is represented by λ, and was set at 0.9. Labeling efficiency was set at 85%. Magnetization transfer effects are lumped into a single term indicating the partial saturation of the spins during both the labeling and control periods. Here, Km is the magnetization transfer rate, which takes a constant value (set empirically to 0.01) during both the labeling and control periods and is zero otherwise (note that the usual forward and reverse magnetization transfer terms are lumped into a single one). The modeling of the arterial magnetization must describe the random application of pCASL labeling pulses. Here, these are described as a labeling function (inp(t)) as a square wave that takes the value of one when the arterial magnetization is inverted and zero otherwise:
| (Eqn 2) |
In the case of a pCASL acquisition, the arterial spins experience inversion by the labeling pulses, and they subsequently relax back at a relaxation rate of R1a. At the same time, the arterial spins travel at different velocities and become dispersed in the arterial tree during transit to the tissue. Relaxation and dispersion is captured by the following convolution equation [30,31]:
| (Eqn 3) |
where Ma,a(t) is the longitudinal magnetization in the arterial compartment and Ma,t(t) is the longitudinal magnetization of the input into the tissue compartment. The function inp(t) refers to the labeling function in Equation 2. The efficiency of the inversion is captured by α, which was set to 0.9. R1a was assumed to be 0.59s−1. Γ(t, δ, D) is the Gamma-variate function with a time-to-peak δ and a dispersion constant D (D was set empirically). Note that the time-to-peak, δ, serves as a measure of bolus arrival time in this model, as shown in Figure 1b. Importantly, to account for a different time-to-peak delays in the tissue and arterial compartments, Equation 3 is also used to model the dispersion and decay of the label into the arterial compartment using a separate time-to-peak, δart.
Equations 1 through 3 allow simulation of the MRF ASL signal, accounting for the pseudo-randomized nature of the MRF ASL sequence. The magnetization in the tissue compartment of the voxel is estimated by integrating Equation 1 with the arterial input Ma,t from Equation 3 and modulating that signal to account for RF excitation during each acquisition. The magnetization in the arterial compartment of the voxel is estimated using Equation 3 for Ma,a and modulating that signal to account for RF excitation during each acquisition. The total signal is then described by the following equation:
The model is described pictorially in Figure 1b. A dictionary of possible signals for a range of tissue properties can be created. The signal for each voxel is matched to a single dictionary entry using a pattern recognition algorithm, and the values of each property of interest that went into creating the selected entry, are assigned to that pixel in the parameter maps. In this work, the maximum inner product of the normalized signals was used to select the best match between the signal and the dictionary in a multiple step process detailed below.
2.2 Sequence Design and Data Acquisition
The general sequence structure is described in the Theory section and is shown pictorially in Figure 1a. As described above, various sequence parameters are randomized to generate a unique inflow of labeled spins. Although infinite sequences could be designed following this structure, this proof-of-concept study used the following regime:
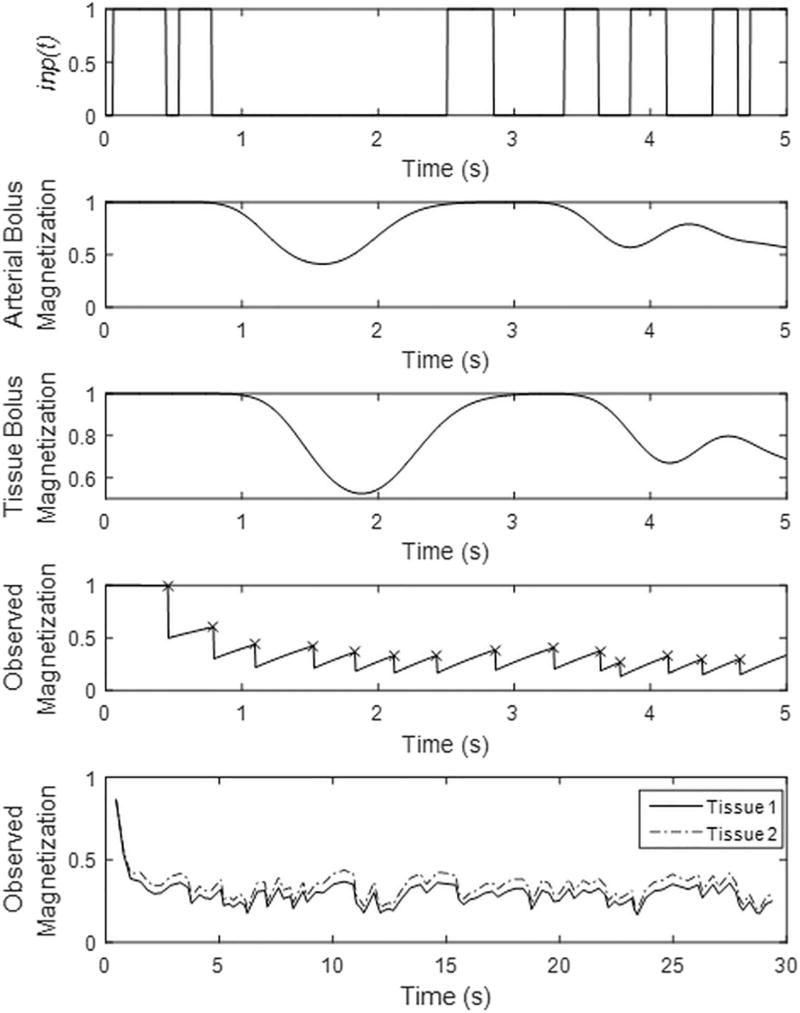
Frequency of Labeling Pulses: Whether a pulse was selected as label or control was randomized using a random number generator. These are plotted for a segment of the sequence as a labeling function (inp(t)) in Figure 2.
Label and Control Pulse Durations: The label/control pulse durations were selected in a pseudo-random fashion. A vector of label/control duration times was created to have equidistant spacing between 10 ms and 400 ms, and that vector was randomly sorted. The resulting label/control durations timing is shown for a segment of the sequence in Figure 2.
Post Label Delay Times (PLD): Although these could also be selected with randomized duration [20], a short, constant PLD of 10 ms was selected here and in other works [21,22] to allow for faster sampling of the magnetization.
Acquisition: After each pCASL pulse and its associated PLD, an image is acquired with a single-shot spiral trajectory and a spoiled gradient echo sequence. For each image, a constant flip angle of 60 degrees is used. A constant acquisition time of 35 ms was used, which was followed by a 50 ms delay prior to the next pCASL pulse.
Figure 2.
(Top plot) The labeling function (inp(t)) is plotted for the first 5 seconds of the MRF ASL experiment. The labeling function is equal to one during application of pCASL labeling pulses only. (2nd plot) The arterial bolus magnetization is plotted for the first 5 seconds of the MRF ASL experiment. This is simulated with a arterial bolus time-to-peak of 1.2 seconds and includes dispersion. (3rd plot) The tissue bolus magnetization is plotted for the first 5 seconds of the MRF ASL experiment. This is simulated with a tissue bolus time-to-peak of 1.5 seconds, includes dispersion, and a CBF of 65 ml/min/100g. (4th plot) The simulated signal for this two compartment model is plotted for the first 100 images of the MRF ASL experiment. The timing of the RF excitation for data acquisition are noted with ‘x’. (Bottom plot) Signals from two representative tissues are plotted. Tissue 1 has a CBF of 65 ml/min/100g, CBV of 0.02, arterial time-to-peak of 1.2 s, and tissue time-to-peak of 1.5 s, T1 of 1.4 s. Tissue 2 has a CBF of 40 ml/min/100g, CBV of 0.001, arterial time-to-peak of 1.7 s, and tissue time-to-peak of 1.9 s, T1 of 1.08 s.
Data were acquired using a 3T MR750 (General Electric, Milwaukee, WI) with field-of-view of 240 mm and matrix size of 642. A total of 500 images were acquired for each scan, which yields a total scan time of 2.5 minutes for the selected pseudo-random pCASL schedule. Acquired spiral data were gridded and density compensated, and the signal in each voxel was analyzed in the following step.
2.3 Dictionary Generation and Pattern Matching
A two-compartment model is used as described in the Theory section. The selected sequence parameters and the physiological/physical tissue properties of interest are supplied as inputs to the model, which then generates a dictionary that corresponds to the sequence and tissue properties. In order to provide quantitative tissue property maps, the entry in the dictionary with the closest match to the collected signal is selected using the maximum inner product as the metric.
We conducted a three-step search for each pixel in the image. In the first step of processing, a dictionary is created to quantify T1 and B1 alone, using a very coarse range of flow related parameters. Twenty T1 values ranging from 500ms to 3500ms and twenty B1 values ranging from −20% to +20% of the nominal flip angle. A full range/resolution of perfusion parameters was not used in this first step. Two perfusion values (30 and 60 ml/min/100g-tissue), three arterial bolus arrival times (0.5, 1.75, and 3 s), three tissue bolus arrival times (0.5, 1.75, and 3 s), and a cerebral blood volume of 1% were used. From this first step, the T1 and B1 maps are generated and stored. The T1 and B1 values assigned to each pixel were used as prior information to generate the dictionary for the second step in the search. The B1 map used in the dictionary generation was smoothed to reduce the spatial fluctuations due to noise. The second dictionary focused on the arterial compartment, namely cerebral blood volume (twenty-two total values with twenty values evenly distributed between 0.1% and 3%, 50, and 100%) and arterial time-to-peak (twenty values evenly spaced between 0.5 and 2 seconds). Three perfusion values (10, 55, 100 ml/min/100g-tissue) and three tissue times-to-peak (0.5, 1.75, and 3 s) were included. After this second step, the cerebral blood volume and arterial time-to-peak maps were generated.
In the final step, each pixel’s cerebral blood volume and arterial bolus arrival time was used to generate the final dictionary, focused on perfusion (twenty values equally spaced between 0 and 100 ml/min/100g-tissue) and tissue bolus arrival time (twenty values equally spaced between 0.5 and 3 s). This dictionary was then used to identify the perfusion in each pixel, and time-to-peak to the tissue. The prior information maps (T1, B1, CBVa and arterial time-to-peak) were filtered using a spatial Gaussian smoothing to reduce spatial fluctuations due to noise, but unsmoothed maps from each stage are reported in results.
2.4 Sensitivity Analysis
The MRF ASL sequence design was evaluated in simulation by examining the sensitivity of the observed signal due to the influence of each of the parameters of interest. This was done by generating synthetic signals using the same acquisition timing parameters as in our experiment and then computing the partial derivatives of the MRF signal with respect to each of the physical and vascular parameters of interest over a range of parameter values. These partial derivatives were calculated using a finite differences approach with a variation in the tissue property of interest (x):
| (Eqn 4) |
where dx was set at 2.5% of the property value, x0. The norm of the partial derivative was then scaled by the norm of the signal obtained with the central value of the parameter.
With the exception of the property that was varied, all other properties were held constant at the following parameter values: CBF of 60 ml/min/100g, CBV of 0.005, arterial compartment time-to-peak of 1.4 s, tissue compartment time-top-peak of 1.5 s, dispersion for bolus of 20, magnetization transfer rate 0.01 s−1, T1 of tissue of 1.6 s, and B1 of 100%. For each simulation evaluating the change in signal related to vascular or tissue property, each parameter was varied with the following ranges: CBF was varied from 0 to 100 ml/min/100g, CBV was varied from 0 to 0.1, T1 was varied from 500 ms to 2000 ms, B1 was varied from 50–125% of the applied 60 degree flip angle, arterial and tissue time-to-peak was varied from 0.1 to 3 s, MT rate constant was varied from 0 to 2 s−1.
2.5 in vivo Validation
MRF ASL data were collected in seven healthy volunteers in this HIPAA-compliant, IRB approved study. All MRF ASL data were reconstructed and processed as described above, which produced a total of six quantitative maps for each exam: T1, B1, arterial time-to-peak, cerebral blood volume, perfusion, and tissue time-to-peak. Region-of-interest analyses were performed in grey and white matter regions to report quantitative results across volunteers.
To test for repeatability, the MRF ASL exam was repeated in the same subject and exam using the same scanning parameters and slice location in five volunteers. Mean and standard deviation of grey matter regions were measured and compared. The repeated measures were evaluated using a paired Student’s t-test (α=0.05).
In addition to the MRF ASL exam, a standard pCASL acquisition and multiple post-label delay acquisition were also performed to provide reference measurements of CBF and time-to-peak. For the standard pCASL acquisition, these data were acquired with 25 label/control pairs with a labeling duration of 1.8 seconds and a post-label delay of 1.8 seconds. Perfusion was calculated using a standard single compartment model as described in [26]. To estimate the time-to-peak, 60 label/control pairs were acquired with a label duration of 1 second and a post-label delay of 0.5, 0.8, 1.1, 1.4, 1.7, and 2 seconds (10 label/control pairs per delay time). Bland-Altman analysis was performed to compare the MRF measurements to the reference in masked grey matter regions in seven volunteers.
3.0 Results
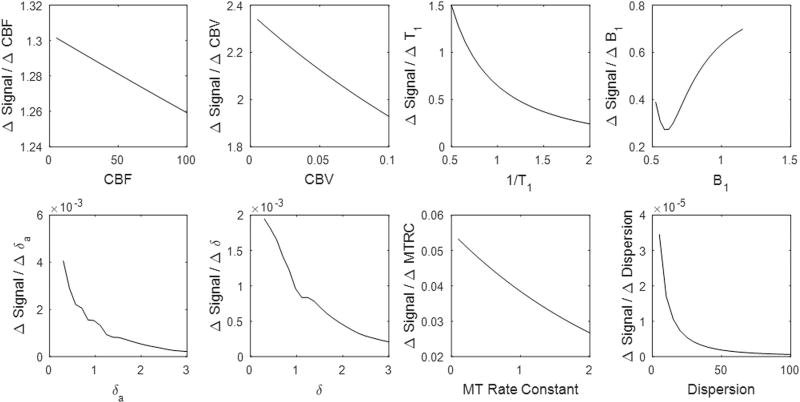
The sensitivity of the MRF ASL signal to various vascular and physical properties are illustrated in Figure 3. By comparing the range of the partial derivatives with respect of each tissue property to each other, it is possible to determine relative differences in the experiment’s sensitivity to that property. We note that the signal change due to variation in vascular parameters is much smaller than the signal change due to T1 or the acquisition flip angle. Furthermore, the acquisition shows higher sensitivity to CBV in comparison to perfusion, and higher sensitivity to the arterial time-to-peak than the tissue time-to-peak.
Figure 3.
For the MRF ASL sequence structure described in this study, the sensitivity of experiment was tested in simulation. For each of the mentioned tissue or physical properties, the partial derivative with respect to each parameter was calculated by computing the change in signal obtained per unit change in the parameter. Partial derivatives were computed across a range of parameter values. The result is SCALED BY THE OBSERVED SIGNAL AT THAT PARAMETER VALUE.
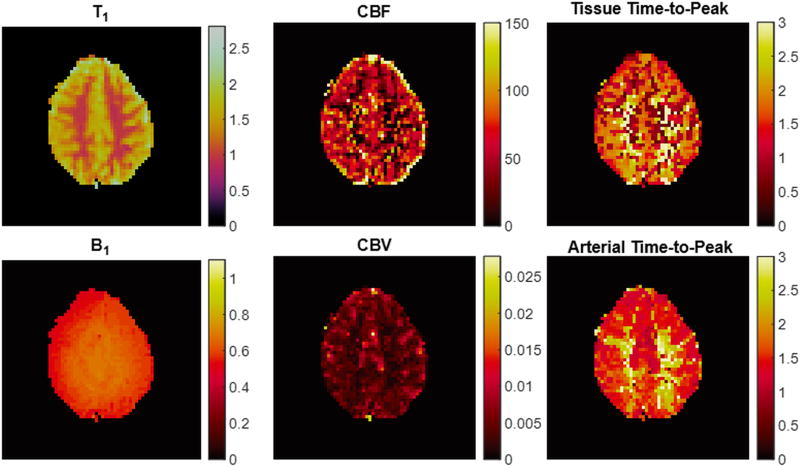
Representative quantitative tissue property maps calculated from our empirical data are shown in Figure 4. Tissue properties in regions-of-interest in grey and white matter across the cohort of seven volunteers are described in Table 1.
Figure 4.
Representative maps from the MRF ASL acquisition in one volunteer (T1 in seconds, B1 scaling factor, CBF in ml/min/100gtissue, Time-to-peak in seconds, CBV as a fraction (0–1)).
Table 1.
Summary of tissue properties across population of seven volunteers.
| Grey Matter | ||
|---|---|---|
| Mean | Standard Deviation | |
| CBF (ml/min/100g) | 69.05 | 6.09 |
| δa (s) | 1.46 | 0.12 |
| δ (s) | 1.50 | 0.12 |
| T1 (ms) | 1634 | 70 |
| CBVa | 0.0048 | 0.00047 |
| White Matter | ||
| Mean | Standard Deviation | |
| CBF (ml/min/100g) | 53.79 | 10.03 |
| δa (s) | 1.89 | 0.27 |
| δ (s) | 1.88 | 0.17 |
| T1 (ms) | 1080 | 39 |
| CBVa | 0.0025 | 0.00015 |
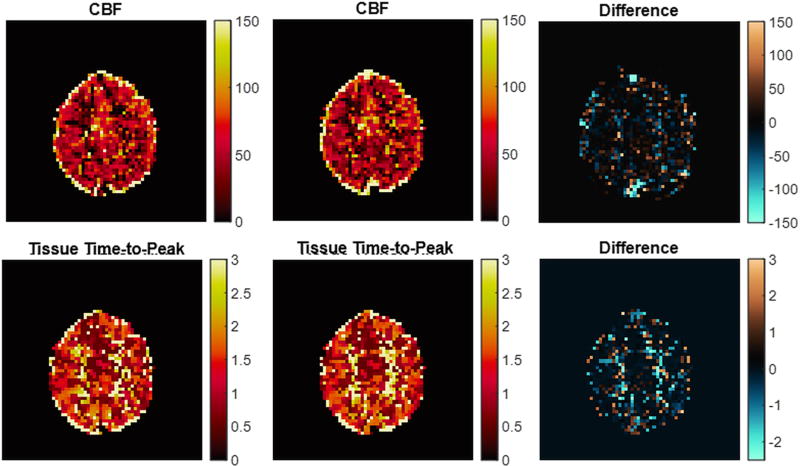
In five volunteers, MRF ASL experiments were repeated twice in the same exam to demonstrate repeatability of the results. Figure 5 shows these repeated maps of CBF and δ from a representative subject, and the maps are subtracted for comparison. For these repeated measures, a mask of grey matter was created, and tissue properties were averaged for this region for each measurement. The average difference between the grey matter regions in each repeated measure for CBF was 0.15 ml/min/100g tissue, for δart was 15.7 ms, for δ was 13.0 ms, for CBVa was 0.000029, and for T1 was 7.9 ms. There was no statistically significant difference between the two repetitions for any of the estimated tissue properties using a paired t-test (p-value of CBF t-test: 0.89, p-value of δart t-test: 0.13, p-value of δ t-test: 0.44, p-value of CBVa t-test: 0.78, p-value of T1 t-test: 0.46).
Figure 5.
CBF (ml/min/100gtissue) and tissue time-to-peak (seconds) maps in one volunteer for repeated MRF ASL acquisitions in a single volunteer and the subtraction for those repetitions.
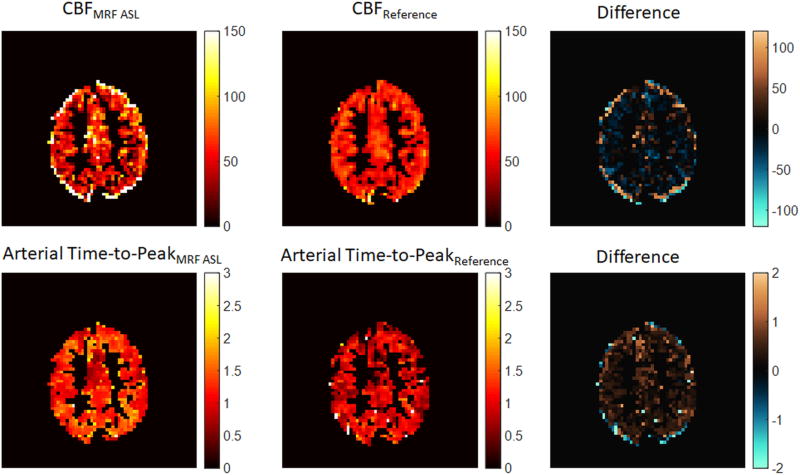
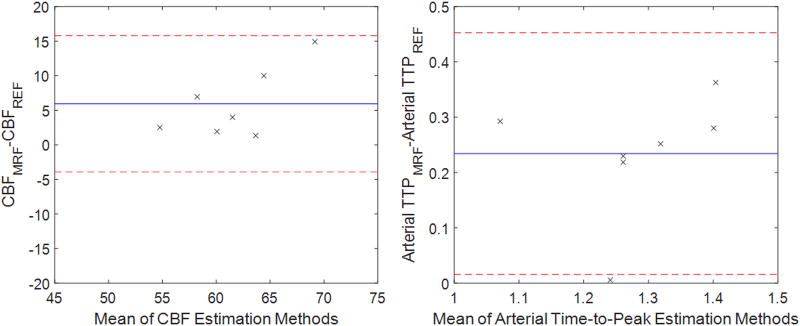
In addition to the MRF ASL exam, a traditional pCASL exam and multiple post-label delay pCASL exam were acquired for each volunteer, and perfusion and arterial time-to-peak was estimated using these data. Figure 6 shows a masked perfusion and arterial time-to-peak map from MRF ASL and reference methods. These data are further compared in Figure 7 using Bland-Altman analysis of the grey matter in seven volunteers. The average difference in CBF between the two methods (indicated by the blue horizontal line in Figure 7) was 5.9 ml/min/100g tissue. All data points fall within two standard deviations from the mean. The average difference in arterial time-to-peak between the two methods (indicated by the blue horizontal line in Figure 7) was 0.23s. Six of seven data points fall within two standard deviations from the mean.
Figure 6.
(Left Top) Masked map of CBF estimated using the two-compartment model and MRF ASL acquisition in grey matter with units ml/min/100g. (Center Top) Masked map of CBF estimated using a one-compartment model and standard pCASL acquisition in grey matter with units ml/min/100g (Right Top) Subtraction of masked CBF maps (MRF ASL – pCASL Reference) with units ml/min/100g. (Left Bottom) Masked map of arterial time-to-peak estimated using the two-compartment model and MRF ASL acquisition in grey matter with units of seconds (Center Bottom) Masked map of arterial time-to-peak estimated using a two-compartment model and multiple post-label delay pCASL acquisition in grey matter with units of seconds (Right Bottom) Subtraction of masked arterial time-to-peak maps (MRF ASL – pCASL Reference) with units of seconds.
Figure 7.
Plot of Bland-Altman analysis comparing CBF (ml/min/100g) and arterial Time-to-Peak (TTP, seconds) from the MRF ASL technique to the pCASL technique.
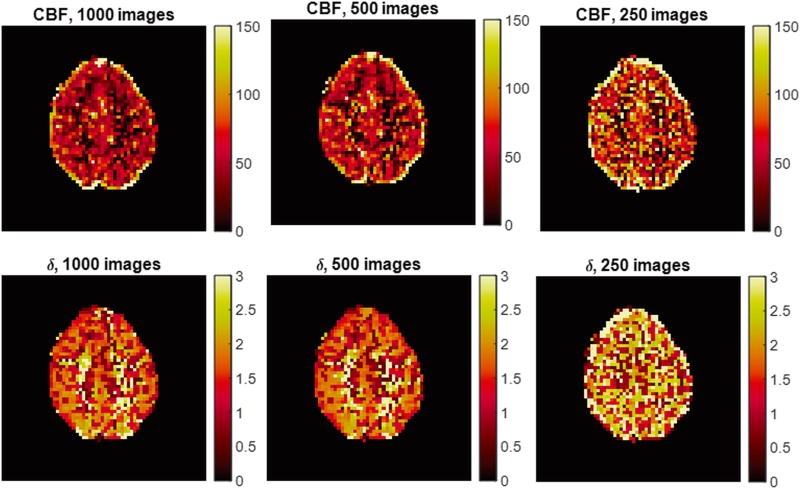
Figure 8 shows results from data that were retrospectively reconstructed using the first 250 and 500 images as well as all 1000 images. Perfusion and tissue time-to-peak maps are shown for these three scan durations.
Figure 8.
Experimental analysis of MRF ASL scan duration. MRF ASL maps are estimated retrospectively using 1000, 500, and 250 images. Maps for a representative volunteer are shown for CBF and tissue time-to-peak.
4.0 Discussion
ASL provides perfusion measurements without the use of Gadolinium based contrast agents, which offers many advantages. The ASL signal is affected by several hemodynamic parameters, and these can differ across the patient population due to age and disease. While hemodynamic parameters such as the bolus arrival time or blood volume are informative biomarkers, measuring multiple hemodynamic parameters makes the exam impractical and less robust in the clinical environment. Finally, quantifying perfusion with ASL is also dependent on several other tissue properties including tissue T1. Most recommended techniques for clinical use make several assumptions to avoid performing further quantitative scans [26], but these assumptions can have effects on the accuracy of the absolute perfusion value [26,32].
In this study, an approach to ASL data acquisition and parameter quantification using the MRF framework, is proposed and demonstrated. A proof-of-principle sequence was designed by pseudo-randomly varying the timings in the pCASL labeling. The MRF ASL signals were then matched to a dictionary entry using a multi-step pattern recognition algorithm. By selecting a single dictionary entry, MRF ASL provided access to the quantitative tissue properties that have been modeled. By quantifying the properties of interest in a single acquisition, the perfusion quantification has the potential to reduce scan time, yield a richer set of physiological measurements and account for the effects of other tissue and hemodynamic parameters on the accuracy of the perfusion measurement. The resulting quantitative maps are all inherently registered, which offers advantages for analysis. Furthermore, the exam required no user selected parameter adjustment.
One challenging consideration for all MRF sequences is sequence design and optimization. Because of the pattern matching based quantification of tissue properties, understanding the relationship between vascular or physical properties and the MRF signal is important. Thus, simulations were performed to evaluate the sensitivity of the MRF ASL signal to different physiological and physical properties of the tissue. The results for these simulations are summarized in Figure 3. T1 has the largest effect on the MRF ASL signal, while B1 and magnetization transfer have more moderate effects. It is well known that signal difference in grey matter between a labeled and a control image in a pCASL experiment is approximately 1%, so it is expected that vascular properties (CBF, CBV, and time-to-peak) should have a relatively lower impact on signal. For this type of acquisition, each individual label has an even smaller effect on the signal, but it is expected that the randomized and frequent pCASL pulses will provide unique signal fluctuations. In the sequence design utilized, CBV had the strongest effect on the MRF ASL signal of the vascular properties, followed by arterial time-to-peak, tissue time-to-peak, perfusion and bolus dispersion. Our partial derivative analysis indicates that some properties will have a stronger influence on the MRF ASL signal. Accordingly, properties with less influence on the signal may be more susceptible to errors related to noise. The fact that the signal sensitivity to perfusion and arrival time is so small is a major challenge and suggests that optimization of the acquisition scheme may be beneficial.
The experimental results on healthy volunteers are promising and suggest that there is sufficient robustness to the experiment to overcome the challenge of small signal changes. Figure 4 demonstrates promising initial results of this technique in a 2D brain scan. Additionally, the tissue property values seen in the grey matter ROI analyses (Table 1) and in the property maps were similar to those reported in the literature [26,33]. B1 values seen here are lower than typically reported values in the brain. Expected variations in tissue properties were seen in these maps. For example, grey matter had higher perfusion and lower time-to-peak values than in white matter. Also, the grey matter in posterior regions of the brain had a higher time-to-peak value than other grey matter regions.
Results in Figure 5 demonstrate the repeatability of this approach. For all tissue properties, there was no statistically significant difference between the repeated scans in grey matter. As can be seen in the difference images, there was higher variability in white matter, as expected. The results in white matter are affected by higher noise levels due to the low perfusion and, thus, low SNR in the MRF ASL signals.
Figures 6 and 7 provide a comparison against a reference pCASL CBF estimate, which was recently described in [26]. It is important to note that the models were different to reflect the differences in the acquisitions, and it was not expected that these data should exactly correspond to this reference method. Figure 6 does show local differences in CBF in grey matter, but the average differences across the grey matter were similar to the reference method. There was a small bias (5.9 ml./min/100g) in the difference between the two methods, but all data fell within two standard deviations from the mean.
Figures 6 and 7 also provide a comparison against a reference estimate of arterial time-to-peak using a standard pCASL acquisition with multiple post-label delay times. Figure 6 does show local and average differences in arterial time-to-peak in grey matter. There was a bias of 0.23 seconds between the two methods, and all but one dataset fell within two standard deviations from the mean. In the case of arterial time-to-peak, there is a notable bias between the two measurement techniques with MRF ASL providing consistently higher values. Without a true gold standard, it is unclear how to interpret this bias, but it could be investigated in future studies either in simulation or in phantom exams.
An important factor for MRF ASL is the efficiency of the scan. Without extensive optimization work, it is unclear how many images must be acquired for a given sequence structure. In order to demonstrate the limits of this current methodology, 1000 images were acquired in the data shown in Figure 8, and fewer images were retrospectively selected to generate maps (the first 250 and 500 images). Clearly, the results from 250 images show that there is insufficient information to estimate the quantitative properties at that scan time. However, there is less variation between the maps that were estimated using 500 and 1000 images, suggesting that 500 images provides sufficient information for estimating tissue properties.
The MRF ASL method draws upon other alternative approaches to estimating perfusion with ASL. For example, dynamic sampling of ASL signal [34–39], randomized labeling [40,41], using a dictionary for parameter quantification [41], and short TR scanning for mapping of arterial transit times [42] have been explored previously. In addition to the work presented in this study, the use of MR Fingerprinting in combination with ASL [20,23] has been explored in recent studies. Prior and current works have shown that these pseudo-random strategies may offer some advantages. To expand upon the prior MRF ASL works [20–23], the present study explored acquisition properties such as exam duration and sensitivity to various physical and physiological properties. Furthermore, the model used in the present study differed from prior acquisitions through (1) inclusion of arterial dispersion of the label (2) inclusion of magnetization transfer and (3) the exclusion of a “flow-through” time in the arterial compartment. The randomized labeling duration scheme in this work was a flat distribution, rather than Perlin distribution as in [23]. We found that these differences were subtle and did not affect the results significantly (data not shown).
Although these results are interesting and show initial promise of this approach, there are several limitations that need to be addressed in futures studies. First, a full validation of each tissue property against standards is required. With the lack of standardized perfusion phantoms and differences in modeling between more traditional approaches [26] and the MRF ASL worked described here, this will be challenging, but could be attempted. Second, a goal of MRF approaches is to efficiently quantify multiple tissue properties simultaneously. The sequence and scan time have not been fully optimized, and these should be evaluated in future studies. In addition to sequence optimization, efficiency could also be improved with data undersampling with or without other reconstruction methods, which could also improve imaging speed [18,43]. Third, the current sequence is limited a single slice, although three-dimensional MRF acquisitions have been proposed in the estimation of T1 and T2 and could be evaluated for ASL in the future. Fourth, a two-compartment model has been used in this initial implementation. More complex models could be considered in the future. Finally, this methodology was tested in a cohort of healthy volunteers, and further studies in patient populations [22] will help to evaluate the clinical utility of this approach.
5.0 Conclusions
In conclusion, the MRF framework was combined with ASL to provide simultaneous quantification of perfusion, tissue time-to-peak, cerebral blood volume, arterial time-to-peak, B1, and T1. The MRF ASL scan used a total acquisition time of 2.5 minutes, which is similar to the currently recommended clinical ASL scan protocol (using a 2 – 4 minute acquisition) [26]. The acquisition required limited user input (only for selection of the imaging volume and labeling planes) because all timing parameters are pre-selected to be pseudo-randomly varied. Promising initial results were seen in initial in vivo tests in the brain.
Acknowledgments
Funding Sources:
This work was supported by the National Institutes of Health [R21EB021562, R01EB016728].
Footnotes
Publisher's Disclaimer: This is a PDF file of an unedited manuscript that has been accepted for publication. As a service to our customers we are providing this early version of the manuscript. The manuscript will undergo copyediting, typesetting, and review of the resulting proof before it is published in its final citable form. Please note that during the production process errors may be discovered which could affect the content, and all legal disclaimers that apply to the journal pertain.
References
- 1.Detre JA, Rao H, Wang DJJ, Chen YF, Wang Z. Applications of arterial spin labeled MRI in the brain. J Magn Reson Imaging. 2012;35:1026–37. doi: 10.1002/jmri.23581. [DOI] [PMC free article] [PubMed] [Google Scholar]
- 2.Kucharczyk J, Mintorovitch J, Asgari HS, Moseley M. Diffusion/perfusion MR imaging of acute cerebral ischemia. Magn Reson Med. 1991;19:311–5. doi: 10.1002/mrm.1910190220. [DOI] [PubMed] [Google Scholar]
- 3.Watts JM, Whitlow CT, Maldjian JA. Clinical applications of arterial spin labeling. NMR Biomed. 2013;26:892–900. doi: 10.1002/nbm.2904. [DOI] [PubMed] [Google Scholar]
- 4.Deibler AR, Pollock JM, Kraft RA, Tan H, Burdette JH, Maldjian JA. Arterial spin-labeling in routine clinical practice, part 1: technique and artifacts. AJNR Am J Neuroradiol. 2008;29:1228–34. doi: 10.3174/ajnr.A1030. [DOI] [PMC free article] [PubMed] [Google Scholar]
- 5.Jain R, Ellika S, Scarpace L, Schultz L, Rock J, Gutierrez J, et al. Quantitative Estimation of Permeability Surface- Area Product in Astroglial Brain Tumors Using Perfusion CT and Correlation with Histopathologic. Am J Neuroradiol. 2008;29:694–700. doi: 10.3174/ajnr.A0899. [DOI] [PMC free article] [PubMed] [Google Scholar]
- 6.Noguchi T, Yoshiura T, Hiwatashi a, Togao O, Yamashita K, Nagao E, et al. Perfusion imaging of brain tumors using arterial spin-labeling: correlation with histopathologic vascular density. AJNR Am J Neuroradiol. 2008;29:688–93. doi: 10.3174/ajnr.A0903. [DOI] [PMC free article] [PubMed] [Google Scholar]
- 7.Haller S, Zaharchuk G, Thomas DL, Lovblad K-O, Barkhof F, Golay X. Arterial Spin Labeling Perfusion of the Brain: Emerging Clinical Applications. Radiology. 2016;281:337–56. doi: 10.1148/radiol.2016150789. [DOI] [PubMed] [Google Scholar]
- 8.De Bazelaire C, Rofsky NM, Duhamel G, Michaelson MD, George D, Alsop DC. Arterial spin labeling blood flow magnetic resonance imaging for the characterization of metastatic renal cell carcinoma(1) Acad Radiol. 2005;12:347–57. doi: 10.1016/j.acra.2004.12.012. [DOI] [PubMed] [Google Scholar]
- 9.He X, Aghayev A, Gumus S, Bae KT. Estimation of Single-Kidney Glomerular Filtration Rate without Exogenous Contrast Agent. 2014;266:257–66. doi: 10.1002/mrm.24668. [DOI] [PubMed] [Google Scholar]
- 10.Bolar DS, Levin DL, Hopkins SR, Frank LF, Liu TT, Wong EC, et al. Quantification of Regional Pulmonary Blood Flow Using ASL-FAIRER. 2006;1317:1308–17. doi: 10.1002/mrm.20891. [DOI] [PubMed] [Google Scholar]
- 11.Wang Y, Alkasab TK, Narin O, Nazarian RM, Kaewlai R, Kay J, et al. Incidence of Nephrogenic Systemic Fibrosis after Adoption of Restrictive Gadolinium-based Contrast Agent Guidelines. Radiology. 2011;260:105–11. doi: 10.1148/radiol.11102340. [DOI] [PubMed] [Google Scholar]
- 12.Roditi G, Maki JH, Oliveira G, Michaely HJ. Renovascular imaging in the NSF Era. J Magn Reson Imaging. 2009;30:1323–34. doi: 10.1002/jmri.21977. [DOI] [PubMed] [Google Scholar]
- 13.Detre JA, Leigh JS, Williams DS, Koretsky AP. Perfusion Imaging. Magn Reson Med. 1992;23:37–45. doi: 10.1002/mrm.1910230106. [DOI] [PubMed] [Google Scholar]
- 14.Perthen JE, Bydder M, Restom K, Liu TT. SNR and functional sensitivity of BOLD and perfusion-based fMRI using arterial spin labeling with spiral SENSE at 3 T. Magn Reson Imaging. 2008;26:513–22. doi: 10.1016/j.mri.2007.10.008. [DOI] [PMC free article] [PubMed] [Google Scholar]
- 15.Wong EC, Buxton RB, Frank LR. A theoretical and experimental comparison of continuous and pulsed arterial spin labeling techniques for quantitative perfusion imaging. Magn Reson Med. 1998;40:348–55. doi: 10.1002/mrm.1910400303. [DOI] [PubMed] [Google Scholar]
- 16.Chen Y, Wang DJJ, Detre JA. Test-retest reliability of arterial spin labeling with common labeling strategies. J Magn Reson Imaging. 2011;33:940–9. doi: 10.1002/jmri.22345. [DOI] [PMC free article] [PubMed] [Google Scholar]
- 17.Gelderen P Van, Zwart JA De, Duyn JH. Pittfalls of MRI Measurement of White Matter Perfusion Based on Arterial Spin Labeling. 2008;795:788–95. doi: 10.1002/mrm.21515. [DOI] [PMC free article] [PubMed] [Google Scholar]
- 18.Ma D, Gulani V, Seiberlich N, Liu K, Sunshine JL, Duerk JL, et al. Magnetic resonance fingerprinting. Nature. 2013;495:187–92. doi: 10.1038/nature11971. [DOI] [PMC free article] [PubMed] [Google Scholar]
- 19.Christen T, Pannetier Na, Ni WW, Qiu D, Moseley ME, Schuff N, et al. MR vascular fingerprinting: A new approach to compute cerebral blood volume, mean vessel radius, and oxygenation maps in the human brain. Neuroimage. 2014;89:262–70. doi: 10.1016/j.neuroimage.2013.11.052. [DOI] [PMC free article] [PubMed] [Google Scholar]
- 20.Wright KL, Ma D, Jiang Y, Lee G, Griswold MA, Gulani V, et al. Proc 22nd Annu. Meet. Int Soc Magn Reson Med. Milan, Italy: 2014. Theoretical Framework for MR Fingerprinting with ASL: Simultaneous Quantification of CBF, Transit Time, and T1; p. 417. [Google Scholar]
- 21.Su P, Mao D, Liu P, Li Y, Welch B, Lu H. Proc 23rd Annu. Meet. Int Soc Magn Reson Med. Toronto, Canada: 2015. Arterial Spin Labeling without control/label pairing and post-labeling delay: an MR fingerprinting implementation; p. 276. [Google Scholar]
- 22.Su P, Mao D, Liu P, Li Y, Qiao Y, Lu H. Proc 24th Annu. Meet. Int Soc Magn Reson Med. Singapore: 2016. Multi-parametric estimation of brain hemodynamics with Fingerprinting ASL; p. 807. [Google Scholar]
- 23.Su P, Mao D, Liu P, Li Y, Pinho MC, Welch BG, et al. Multiparametric Estimation of Brain Hemodynamics with MR Fingerprinting ASL. Magn Reson Med. 2017;78:1812–23. doi: 10.1002/mrm.26587. [DOI] [PMC free article] [PubMed] [Google Scholar]
- 24.Dai W, Garcia D, de Bazelaire C, Alsop DC. Continuous flow-driven inversion for arterial spin labeling using pulsed radio frequency and gradient fields. Magn Reson Med. 2008;60:1488–97. doi: 10.1002/mrm.21790. [DOI] [PMC free article] [PubMed] [Google Scholar]
- 25.Wu W-C, Fernández-Seara M, Detre JA, Wehrli FW, Wang J. A theoretical and experimental investigation of the tagging efficiency of pseudocontinuous arterial spin labeling. Magn Reson Med. 2007;58:1020–7. doi: 10.1002/mrm.21403. [DOI] [PubMed] [Google Scholar]
- 26.Alsop DC, Detre Ja, Golay X, Günther M, Hendrikse J, Hernandez Garcia L, et al. Recommended implementation of arterial spin-labeled perfusion MRI for clinical applications: A consensus of the ISMRM perfusion study group and the European consortium for ASL in dementia. Magn Reson Med. 2014 doi: 10.1002/mrm.25197. doi: 10.10. [DOI] [PMC free article] [PubMed] [Google Scholar]
- 27.Gonzalez-At J, Alsop DC, Detre JA. Cerebral perfusion and arterial transit time changes during task activation determined with continuous arterial spin labeling. Magn Reson Med. 2000;43:739–46. doi: 10.1002/(sici)1522-2594(200005)43:5<739::aid-mrm17>3.0.co;2-2. [DOI] [PubMed] [Google Scholar]
- 28.Dai W, Robson PM, Shankaranarayanan A, Alsop DC. Reduced resolution transit delay prescan for quantitative continuous arterial spin labeling perfusion imaging. Magn Reson Med. 2012;67:1252–65. doi: 10.1002/mrm.23103. [DOI] [PMC free article] [PubMed] [Google Scholar]
- 29.Wang DJJ, Alger JR, Qiao JX, Gunther M, Pope WB, Saver JL, et al. Multi-delay multi-parametric arterial spin-labeled perfusion MRI in acute ischemic stroke - Comparison with dynamic susceptibility contrast enhanced perfusion imaging. NeuroImage Clin. 2013;3:1–7. doi: 10.1016/j.nicl.2013.06.017. [DOI] [PMC free article] [PubMed] [Google Scholar]
- 30.Chappell MA, Woolrich MW, Kazan S, Jezzard P, Payne SJ, MacIntosh BJ. Modeling dispersion in arterial spin labeling: validation using dynamic angiographic measurements. Magn Reson Med. 2013;69:563–70. doi: 10.1002/mrm.24260. [DOI] [PubMed] [Google Scholar]
- 31.Gallichan D, Jezzard P. Modeling the effects of dispersion and pulsatility of blood flow in pulsed arterial spin labeling. Magn Reson Med. 2008;60:53–63. doi: 10.1002/mrm.21654. [DOI] [PubMed] [Google Scholar]
- 32.Buxton RB, Frank LR, Wong EC, Siewert B, Warach S, Edelman RR. A general kinetic model for quantitative perfusion imaging with arterial spin labeling. Magn Reson Med. 1998;40:383–96. doi: 10.1002/mrm.1910400308. [DOI] [PubMed] [Google Scholar]
- 33.Stanisz GJ, Odrobina EE, Pun J, Escaravage M, Graham SJ, Bronskill MJ, et al. T1, T2 relaxation and magnetization transfer in tissue at 3T. Magn Reson Med. 2005;54:507–12. doi: 10.1002/mrm.20605. [DOI] [PubMed] [Google Scholar]
- 34.Wells JA, Lythgoe MF, Gadian DG, Ordidge RJ, Thomas DL. In vivo Hadamard encoded continuous arterial spin labeling (H-CASL) Magn Reson Med. 2010;63:1111–8. doi: 10.1002/mrm.22266. [DOI] [PubMed] [Google Scholar]
- 35.von Samson-Himmelstjerna F, Madai VI, Sobesky J, Guenther M. Walsh-ordered hadamard time-encoded pseudocontinuous ASL (WH pCASL) Magn Reson Med. 2016;76:1814–24. doi: 10.1002/mrm.26078. [DOI] [PubMed] [Google Scholar]
- 36.Teeuwisse WM, Schmid S, Ghariq E, Veer IM, Van Osch MJP. Time-encoded pseudocontinuous arterial spin labeling: Basic properties and timing strategies for human applications. Magn Reson Med. 2014;72:1712–22. doi: 10.1002/mrm.25083. [DOI] [PubMed] [Google Scholar]
- 37.Barbier E, Silva A, Kim H. Perfusion analysis using dynamic arterial spin labeling(DASL) Magn Reson. 1999;308:299–308. doi: 10.1002/(sici)1522-2594(199902)41:2<299::aid-mrm13>3.0.co;2-r. [DOI] [PubMed] [Google Scholar]
- 38.Meng Y, Wang P, Kim S-G. Simultaneous measurement of cerebral blood flow and transit time with turbo dynamic arterial spin labeling (Turbo-DASL): application to functional studies. Magn Reson Med. 2012;68:762–71. doi: 10.1002/mrm.23294. [DOI] [PMC free article] [PubMed] [Google Scholar]
- 39.Hernandez Garcia L, Lee GR, Vazquez AL, Yip C-Y, Noll DC. Quantification of perfusion fMRI using a numerical model of arterial spin labeling that accounts for dynamic transit time effects. Magn Reson Med. 2005;54:955–64. doi: 10.1002/mrm.20613. [DOI] [PubMed] [Google Scholar]
- 40.Taei-Tehrani M-R, Van Osch MJP, Brown TR. Pseudo-random arterial modulation (PRAM): a novel arterial spin labeling approach to measure flow and blood transit times. J Magn Reson Imaging. 2012;35:223–8. doi: 10.1002/jmri.22844. [DOI] [PubMed] [Google Scholar]
- 41.Wong EC, Guo J. Blind detection of vascular sources and territories using random vessel encoded arterial spin labeling. MAGMA. 2012;25:95–101. doi: 10.1007/s10334-011-0302-7. [DOI] [PubMed] [Google Scholar]
- 42.Mildner T, Müller K, Hetzer S, Trampel R, Driesel W, Möller HE. Mapping of arterial transit time by intravascular signal selection. NMR Biomed. 2014;27:594–609. doi: 10.1002/nbm.3098. [DOI] [PubMed] [Google Scholar]
- 43.Pierre EY, Ma D, Chen Y, Badve C, Griswold MA. Multiscale Reconstruction for MR Fingerprinting. Magn Reson Med. 2016;75:2481–92. doi: 10.1002/mrm.25776. [DOI] [PMC free article] [PubMed] [Google Scholar]


