Abstract
Background/Aim: Overall survival for the high-risk group of neuroblastoma (NB) remains at 40-50%. An integrative genomics study revealed that LIM domain only 1 (LMO1) encoding a transcriptional regulator to be an NB-susceptibility gene with a tumor-promoting activity, that needs to be revealed. Materials and Methods: We conducted chromatin immunoprecipitation and DNA sequencing analyses and cell proliferation assays on two NB cell lines. Results: We identified three genes regulated by LMO1 in the cells, LIM and senescent cell antigen-like domains 1 (LIMS1), Ras suppressor protein 1 (RSU1) and relaxin 2 (RLN2). LIMS1 and RSU1 encode proteins functioning with integrin-linked kinase (ILK), and inhibition of LIMS1, ILK or RLN2 by shRNA reduced cell proliferation of the NB cells, which was also suppressed with an ILK inhibiting compound Cpd 22. Conclusion: The downstream of LMO1-regulatory cascade includes a tumor-promoting LIMS1/ILK pathway, which has a potential to be a novel therapeutic target.
Keywords: Neuroblastoma, pediatric cancer, LMO1, ChIP-seq, therapeutic targets, transcription regulator
NB is the most common extracranial solid tumor in childhood. Although accounting for more than 7% of malignancies in patients younger than 15, it is a cause for approximately 15% of all pediatric cancer deaths (1). NB cells develop from a sympathicoadrenal linage of the neural crest and form solid tumors in the adrenal medulla or paraspinal regions, which cause variable symptoms by compressing and/or invading to adjacent organs depending on their location (1-3). NB cells are heterogenous, and patient age at the time of diagnosis is one of the major factors that contribute to the determination of their biological characters; patients older than 18 months are considered to have a poorer prognosis when associated with dissemination than are patients younger than 18 months (1). In the context of prognosis, patients with NB are categorized into 4 groups: very low risk, low risk (LR), intermediate risk (IR) and high risk (HR), with a 5-year event-free survival of >85%, >75 to ≤85%, ≥50 to ≤75%, and <50%, respectively, based on age at diagnosis, International Neuroblastoma Risk Group (INRG) tumour stage, histologic category, grade of tumor differentiation, DNA ploidy, and copy-number status at the MYCN oncogene locus and at chromosome 11q (1). Recent progress in NB treatment significantly improved patient prognosis; overall survival (OS) for LR and IR groups is now >98% and 90 to 95%, respectively. However, OS for the HR group still remains at 40 to 50%, and 50 to 60% of these patients have a relapse, which, in that case, leaves no option of curable treatment (1-5). To improve the OS and quality of life for the HR group, the first and mandatory line of investigation is the identification of novel therapeutic target molecules in NB cells (6-8).
Currently, a number of genome-wide association studies (GWASs) have been performed for identifying disease susceptibility-associated genes using disease-related genetic variation, and the LIM domain only 1 (LMO1) gene was identified as an NB susceptibility gene by a GWAS (9,10). The study also revealed that both the presence of an NB-related allele of single nucleotide polymorphism (SNP) rs110419 in the LMO1 gene and the increased copy number of the gene contribute to augmented LMO1 expression, and that LMO1 has a role in the proliferation of NB cells. Notably, the relation of the variation at rs110419 in LMO1 as well as the increased copy number to NB is stronger in the HR group than in the non-HR. Thereafter, other studies also revealed the correlation between the SNP and NB susceptibility in different ethnic populations (11,12). In addition, it was recently reported LMO1 has synergetic effects with MYCN on NB metastasis (13). Therefore, it is highly likely that, as a transcription regulator, LMO1 is involved in the regulation of expression of variable genes important for NB progression in HR patients. Consequently, it is anticipated that identification of the LMO1’s regulatory targets may uncover novel tumor-promoting molecular pathways in NB, in which novel therapeutic target molecules, especially for treatment of the HR group, will be discovered.
Materials and Methods
Cell lines. An NB cell line SK-N-SH (SH) was provided from European Collection of Cell Cultures and maintained in D-MEM (Wako Pure Chemical Industries, Ltd., Osaka, Japan) supplemented with 10% fetal calf serum (FCS). LA-N-5 (LAN5) was provided by the RIKEN Bioresource Center through the National Bio-Resource Project of the MEXT, Japan and maintained in RPMI1640 (Life Technologies, Tokyo, Japan) supplemented with 10% FCS.
Immune precipitation and western blot analyses. A 3×FLAG-LMO1 expression vector was constructed by insertion of LMO1 cDNA (14) into p3×FLAG-Myc-CMV (Sigma-Aldrich, St. Louis, MO USA). Cell lysates were prepared using CelLytic-M Mammalian Cell Lysis/Extraction Reagent (Sigma-Aldrich) and Protease Inhibitor Cocktail (Sigma-Aldrich). As preliminary experiment for selecting anti-LMO1 antibodies, immune precipitation was conducted on cell lysate of a gastric cancer cell line HSC-59 (14) introduced with a 3×FLAG-LMO1 expression construct, using anti-FLAG (EZView Red ANTI-FLAG M2 Affinity Gel, Sigma-Aldrich) and anti-LMO1 antibodies (Santa Cruz Biotechnology, Dallas, TX, USA). Immune blotting was performed with the anti-FLAG (Sigma-Aldrich) or anti-LMO1 (Santa Cruz Biotechnology) antibody as primary antibodies and HRP-conjugated anti-mouse or anti-goat antibodies (Santa Cruz Biotechnology) as secondary antibodies. The signals were detected by Pierce Western Blotting Substrate Plus (Thermo Fisher Scientific, Yokohama, Japan).
Real-time RT-PCR and microarray expression analyses. Total RNA was extracted from the NB cell lines with ISOGEN (WAKO). Quantitative RT-PCR was performed by converting about 5 μg of total RNA to the first strand cDNA with High Capacity cDNA Reverse Transcription Kit (Life Technologies), followed by TaqMan Gene Expression Assay (Life Technologies, Applied Biosystems Assay ID: Hs00231133_m1 for LMO1, Hs00757864_m1 for LIMS1, Hs00765784_m1 for RSU1, Hs00754884_s1 for RLN2, and Pre-Developed TaqMan Assay Reagent for glyceraldehyde-3-phosphate dehydrogenase (GAPDH)). The PCR was performed for 40 cycles under a condition of 2 steps of temperature: 95˚C for 15sec and 60˚C for 60sec, using ABI PRISM 7900HT Sequence Detection System (Life Technologies). The relative transcript level was calculated using the Ct value of GAPDH transcript as reference. The RNA was extracted from shRNA-introduced cells after 7-10 days’ duration of G418 selection (Geneticin, WAKO). Microarray expression analyses were performed with GeneChip Human Genome U133 Plus 2.0 Array (Affymetrix, Santa Clara, CA, USA).
ChIP-seq. Chromatin samples of the NB cells were prepared using ChIP-IT Express Enzymatic Kit (Active Motif Japan, Tokyo, Japan), which were immunoprecipitated with the anti-LMO1 antibody and Protein G sepharose (GE Healthcare Japan). DNA samples purified from the precipitated chromatin were applied to the library construction using ChIP-Seq Sample Prep Kit (Illumina K.K., Tokyo, Japan) and Multiplexing Sample Preparation Oligonucleotide Kit (Illumina). In brief, after adapter ligation, around 300-bp fraction of DNA was isolated by electrophoresis through agarose gel, and clusters for sequencing were prepared using TruSeq PE Cluster Kit v3-cBot-HS (Illumina). DNA sequencing was conducted by Takara Bio Inc. (Shiga, Japan) with HiSeq 2000 (Illumina) for 100 nucleotides in a single-read manner. Input DNA samples were also sequenced as reference for data analyses.
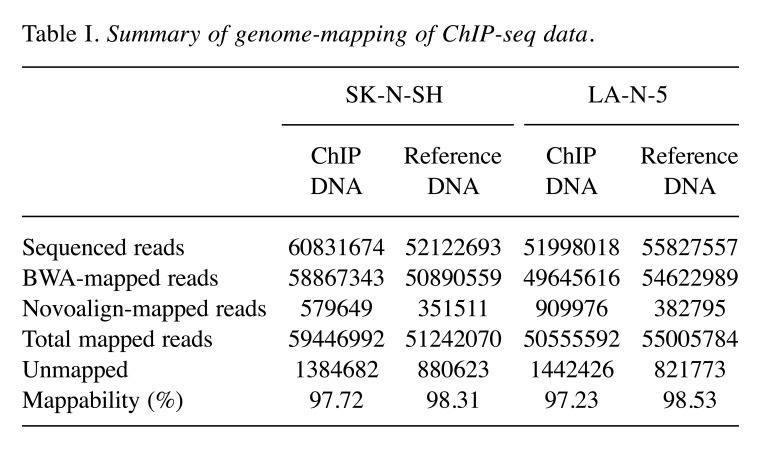
Sequence data analyses. Quality check of the data was performed with FastQC (http://www.bioinformatics.babraham.ac.uk/projects/ fastqc/) which revealed a high quality of the sequence data (reads) and all reads were applied to alignment of the human genome. Raw sequencing reads were aligned to the UCSC hg19 reference genome using Burrows-Wheeler Aligner (15) supplemented with Novoalign (Novocraft Technologies, Selangor, Malaysia). As a result of the genome-alignment, 59,446,992 and 50,555,592 reads from the ChIP sequence data of SH and LAN5, respectively, were selected for peak-identification analyses, accompanied with their reference data. The peaks of accumulation of the reads were detected using six programs: CisGenome, MACS versions one and two, SISSRs, QuEST, and SPP. When using SISSRs, the p-value threshold was set to 0.1 and the threshold of the number of expected false-positive positions (e-value) was set to 500. Peak detection using QuEST was conducted with three different parameter settings: parameters for transcription factor (QuEST-TF), for polII-like factor (QuEST-PolII), and for histone-type ChIP (QuEST-His). Peak detection using SPP was performed by two methods: window tag density (WTD) and mirror tag correlation (MTC). The e-value was set to 1000 when using SPP (WTD and MTC). The default settings were used for all other program options.
Down-regulation of LMO1 and target genes using shRNA. Each shRNA construct was prepared by annealing the (a) strand to the (b) as follows: for shLMO1 (target sequence: 5’-GGCATTGGACAAG TACTGG-3’), (a) 5’-tcgagGGtATTGGAtAAGTAtTGGttcaagagaCC
AGTACTTGTCCAATGCC-ttttttacgcgta-3’ and (b) 5’-agcttacgc gtaaaaaaGGCATTGGAGAAGTACTGGtctcttgaa-CCAaTACTTaTCCAATaCCc-3’, for shLIMS1 (target sequence: 5’-GCATTATCCCAGAGAACGAA-3’), (a) 5’-tcgagGCATTgTC tCA GAGAgCGAAttcaagagaTTCGTTCTCTGGGATAATGCttttttacgcgtg-3’ and (b) 5’-gatccacgcgtaaaaaaGCATTATCCCAGAGAAC GAAtctcttgaaTTCGcTCTCTGaGAcAATGCc-3’, for shILK (target sequence: 5’-GGGACGCTGCTATGGACGAC-3’), (a) 5’-tcgag GGGAtGCTGCTgTGGAtGACttcaagagaGTCGTCCATAGCAGCGTCCCttttttacgcgtg-3’ and (b) 5’-gatccacgcgtaaaaaaGGGACGCTG CTATGGACGACtctcttgaaGTCaTCCAcAGCAGCaTCCCc-3’, for shRLN2 (target sequence: 5’-GCTAGGAGTCTGT TTACTAC-3’), (a) 5’-tcgagGtTAGGAGTCTGTTTgCTgCttcaagagaGTAGTAAA CAGACTCCTAGCttttttacgcgtg-3’ and (b) 5’-gatccacgcgtaaaaaa GCTAGGAGTCTGTTTACTACtctcttgaaGcAGcAAACAGACTCCTAaCc-3’, and for shGFP (target sequence: 5’-GCTACCT GTTCCATGGCCAA-3’), (a) 5’-tcgagGCTAtCTGTTCCgTGGCC gAttcaagagaTTGGCCATGGAACAGGTAGttttttacgcgtg -3’ and (b) 5’-gatccacgcgtaaaaaaCTACCTGTTCCATGGCCAAtctct tgaaTcGGCCAcGGAACAGaTAGCc-3’. The constructs have a Mlu I site and cohesive ends for Xho I and BamH I or Hind III and possess alteration in the sense strand of the shRNA. Each shRNA was inserted into pLVSIN-CMV neo (Takara Bio) whose CMV promoter was replaced by hU6 promoter. The pLVSIN-hU6-shRNA constructs were introduced into Lenti-X™ 293T Cells (Takara Bio) using Lenti-X™ HTX Packaging System (Takara Bio) and after 72 hours’ incubation, the medium was collected and its viral titer (infection units/ml) was determined by transduction to HT1080 cells. The NB cell lines were transducted with lentivirus (>100,000 infection units) in the presence of polybrene (10 μg/ml in culture medium, Sigma-Aldrich).
Cell growth assay. For the analysis of the effect of the suppression of LMO1 or the product of the target genes, each cell line was seeded on a 100-mm dish (1×10⁵ cells/dish, in triplicate) on the first day after transduced with the lentiviral particles containing the pLVSIN-hU6-shRNA construct, and was incubated for growth. The number of the cells on the dishes was counted on the fifth day of the assay. In the pathway inhibitory assay with Cpd22 (Merck Japan, Tokyo, Japan), the NB cells were prepared in five wells of 96-well plates (2000 cells /well). The inhibitors resolved in dimethylsulfoxide (DMSO, Merck Millipore) were added to the wells. The cells were incubated for 72 hours and the growth was evaluated by MTT (3-(4,5-dimethylthiazol-2-yl)-2,5-diphenyl tetrazolium bromide) assay using Cell Counting Kit-8 (Dojindo, Kumamoto, Japan).
Spheroid formation assay. On an Ultra Low Attachment 96-well plate (Corning Incorporated, NY, USA), NB cells (1×10³ cells/well) were incubated with 1 μM Cpd22 in the medium, which was a 1:1 mixture of DMEM (Wako) and Ham’s F12 (Wako) supplemented with epidermal growth factor (20 ng/ml, Sigma), basic fibroblast growth factor (20 ng/ml, Sigma) and B27 Supplement (Life Technology), or incubated with the solvent 0.01% DMSO, for five days. The number of spheroids per well was counted. The assay was conducted in quintuplicate.
Results
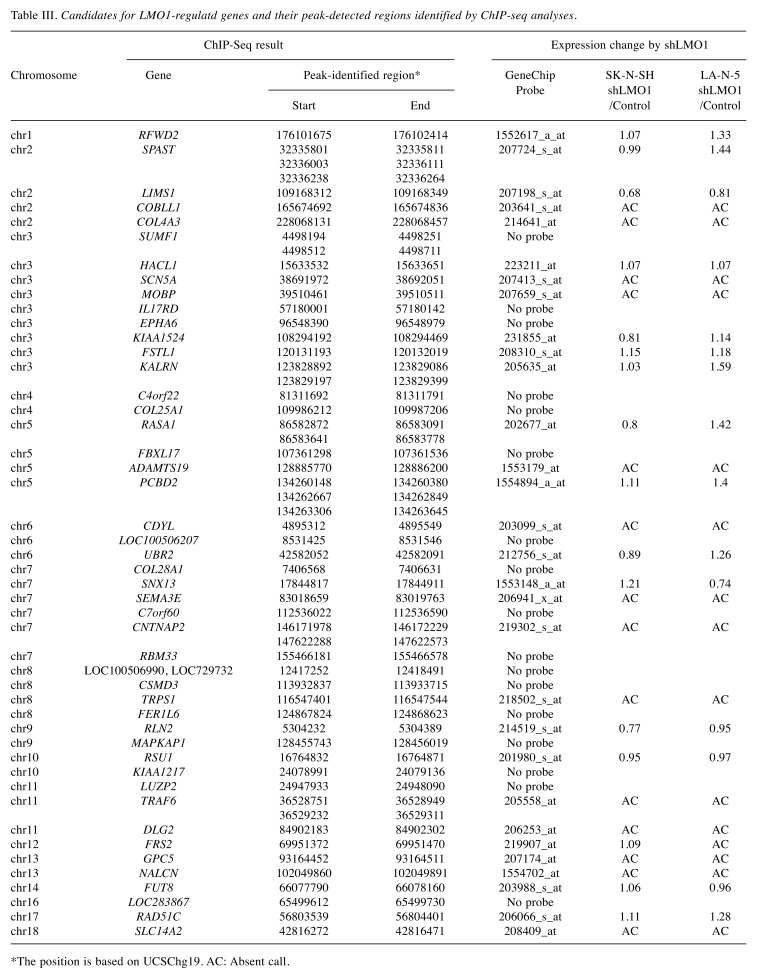
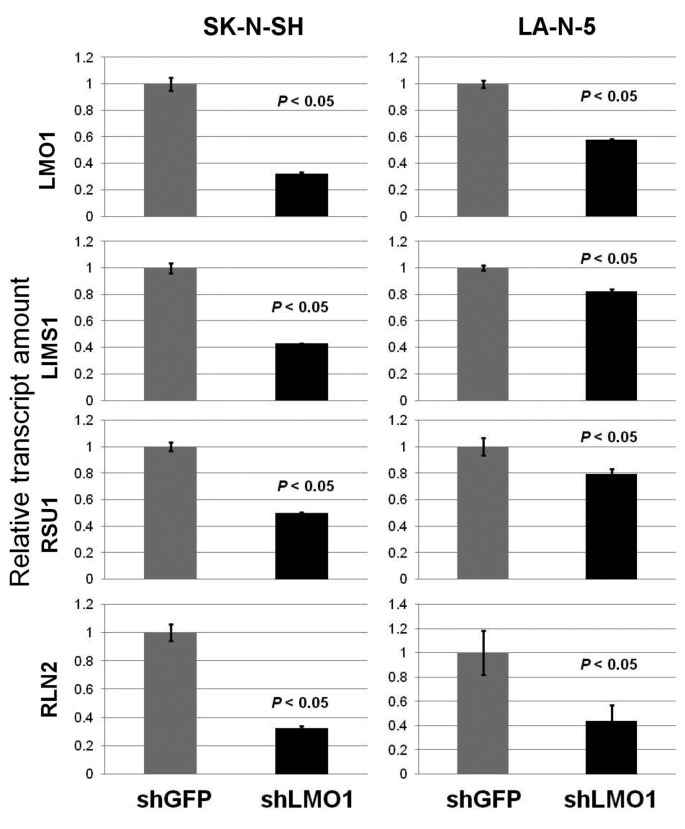
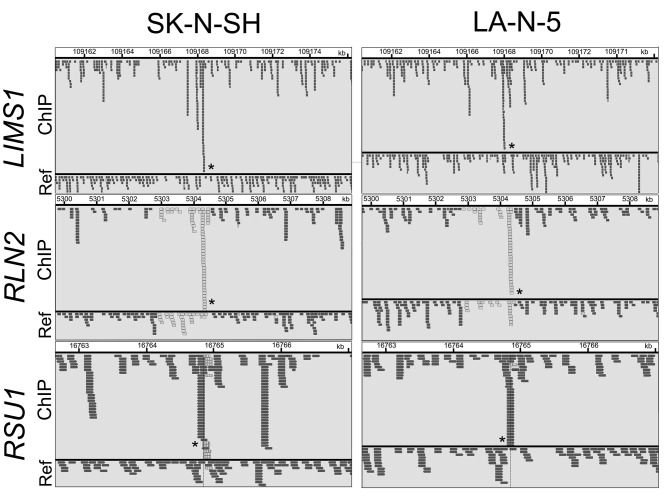
As the transcription regulator LMO1 has no DNA-binding domain and therefore no consensus sequence for DNA binding, chromatin immunoprecipitation followed by DNA sequencing (ChIP-Seq) seemed to be superior to any other method for genome-wide identification of the LMO1’s regulatory target genes. We performed ChIP-Seq on two NB cell lines expressing LMO1, SK-N-SH (SH), and LA-N-5 (LAN5), in which a cell-proliferation promoting activity of LMO1 was demonstrated in the previous study (9). The ChIP-Seq was performed with an anti-LMO1 antibody whose availability in immunoprecipitation had been confirmed (Figure 1). The immunoprecipitated DNA fragments and reference DNA fragments were sequenced by HiSeq2000. From the sequenced reads, those mapped to a reference genome sequence were selected for peak detection (Table I), and applied to 6 peak-detection programs with 9 different settings. Each program detected peaks (Table II), and, in this study, a definite peak was defined as the peaks detected by more than 5 of the 9 settings of the programs in each cell line. In the genome, many definite peaks were identified in which no gene was previously reported to reside. Although it is likely that these are true LMO1-binding sites and may have some biological significance, we focused on the definite peaks located in or near known genes (within a 5-kb proximity of known genes) encoding proteins. In the focused regions, we finally selected loci in which the definite peak was identified common to the two cell lines and obtained candidates for the target genes (Table III). To select the genes for further analyses, we examined the effect of LMO1 suppression on these genes by performing microarray expression analyses, comparing the original two NB cell lines and their counterparts in which LMO1 was suppressed with shRNA, which revealed that three genes, LIM and senescent cell antigen-like domains 1 (LIMS1), Ras suppressor protein 1 (RSU1) and relaxin 2 (RLN2), were down-regulated in the cell lines with LMO1 suppression (Table III). The down-regulation of the three genes was also observed in quantitative RT-PCR analyses (Figure 2), and accumulation of reads (peak) was demonstrated at the detected peak-identified regions for each gene in alignment analyses on the ChIP-seq data (Figure 3). Based on these results, we finally concluded that the three genes are direct regulatory targets of LMO1.
Figure 1. Immune precipitation revealed availability of an anti-LMO1 antibody in immune precipitation. Immune precipitation was conducted on cell lysate of a gastric cancer cell line HSC-59 introduced with3×FLAGLMO1 expression construct, using an anti-FLAG and an anti-LMO1 antibodies. Immune blotting with an anti-FLAG antibody demonstrated 3×FLAG-LMO1 fusion protein in the precipitated specimens.
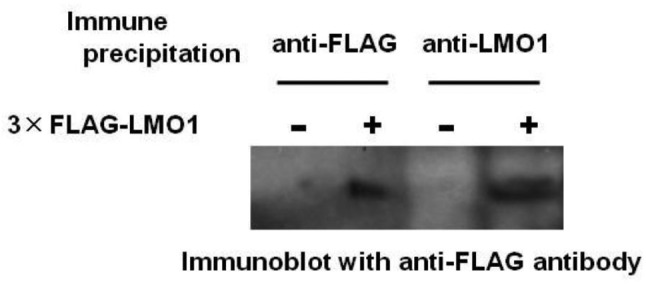
Table I. Summary of genome-mapping of ChIP-seq data.
Table II. Number of peaks detected by peak-detection programs.
Table III. Candidates for LMO1-regulatd genes and their peak-detected regions identified by ChIP-seq analyses.
*The position is based on UCSChg19. AC: Absent call.
Figure 2. Down-regulation of LMO1 suppressed the expression of LIMS1, RSU1 and RLN2 genes. Down-regulation of LMO1 by shRNA resulted in suppression of LIMS1, RSU1 and RLN2 genes in SK-N-SH and LA-N-5 cells, when compared to cells introduced with shGFP (real-time PCR). Bar, Standard deviation, P, p-value of Student’s t-test between the control and the subject.
Figure 3. Peak-identification analyses on ChIP-seq data identified peaks in the regions harbouring LIMS1, RSU1 and RLN2. This figure shows the result of alignment analyses on ChIP-seq data and each small box corresponds to a read, which was drawn by using a software Integrative Genomics Viewer (30). The identified peaks are indicated by asterisks. ChIP, ChIP sample data, Ref, reference DNA data. Note that reads that are displayed with light gray borders and white fill, have a mapping quality equal to zero which means the read could also be mapped to another location.
The ChIP-Seq identified three LMO1-target genes whose function in NB had not been thoroughly elucidated. Intriguingly, LIMS1 and RSU1 proteins have a role in integlin adhesome (16). LIMS1 protein, alternatively named PINCH, has a role in several subcellular signallings at focal adhesions or integlin adhesomes, as a complex with integrin-linked kinase (ILK) and parvin (IPP complex). ILK is a β1-integrin cytoplasmic domain interacting protein, and functions as a scaffold in forming multiprotein complexes connecting integrins to the actin cytoskeleton and signaling pathways, which is involved in the various oncogenic pathways related to cell proliferation, invasion, migration and angiogenesis (17). Some functions of RLN2 in carcinogenesis have been suggested, but remain to be investigated (18).
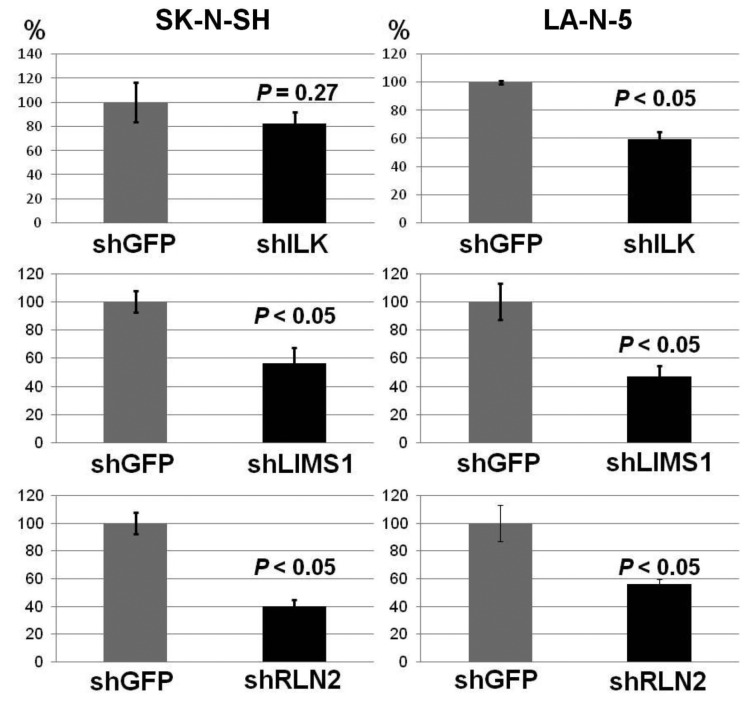
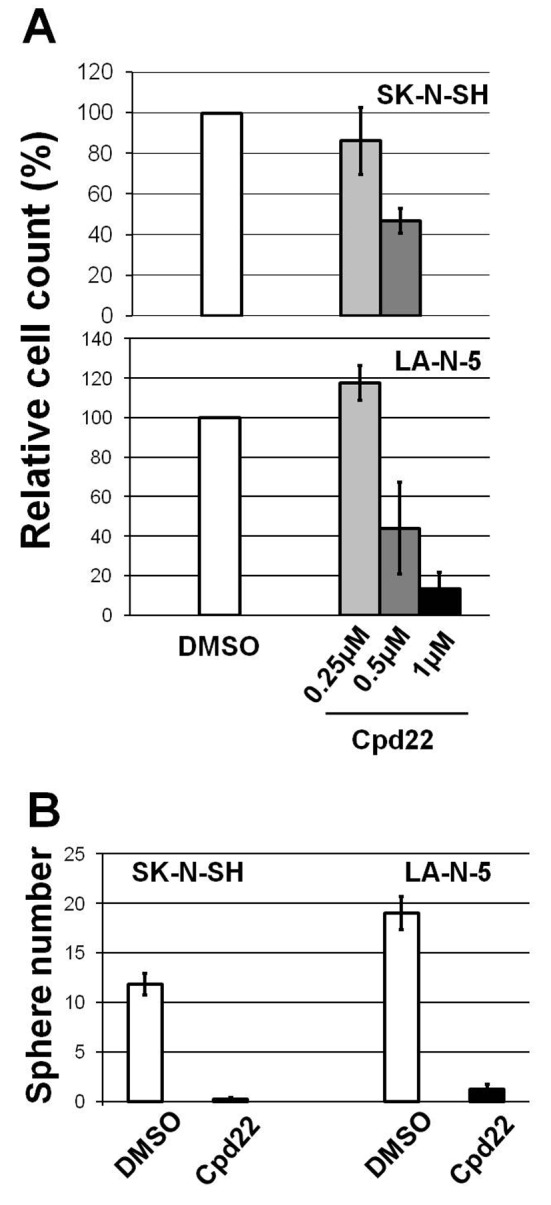
As the cell-proliferation promotion activity of LMO1 in the 2 NB cells was demonstrated in the previous study (9), we examined the consequences of suppression of the RLN2, LIMS1 and ILK genes. This revealed that, when those genes were suppressed independently by shRNA, the 2 NB cells had reduced proliferation compared to the cells to which shGFP was introduced, suggesting that each gene is involved in cell-proliferation promotion (Figure 4). Next, we tested the effect of Cpd22 (19), a commercially available inhibitor of the LIMS1/ILK pathway, on NB cell growth. The cell proliferation assays with 72-hour incubation demonstrated that Cpd22 reduced cell proliferation of the NB cell lines in vitro (Figure 5A). Moreover, it significantly suppressed anchorage-independent cell growth of the NB cells in a spheroid formation assay with a 5-day incubation (Figure 5B), suggesting treatment with Cpd22 could elicit a significant inhibitory effect on the NB cells.
Figure 4. Down-regulation of ILK, LIMS1 or RLN2 genes suppressed proliferation of the NB cells. Down-regulation of each gene resulted in reduced proliferation of SK-N-SH and LA-N-5 cells, when compared to cells introduced with shGFP. Bar, Standard deviation, P, p-value of Student’s t-test between the control and the subject.
Figure 5. An ILK inhibitor Cpd22 reduced cell proliferation of the NB cells. (A) Cpd22 reduced cell proliferation of SK-N-SH and LA-N-5 cells in dose dependent manner. The highest dose of the inhibitor showed statistically significant effect (p<0.05) on the cell proliferation compared to DMSO. bar, standard deviation. (B) Cpd22 suppressed spheroid formation of the NB cells. bar, standard deviation.
Discussion
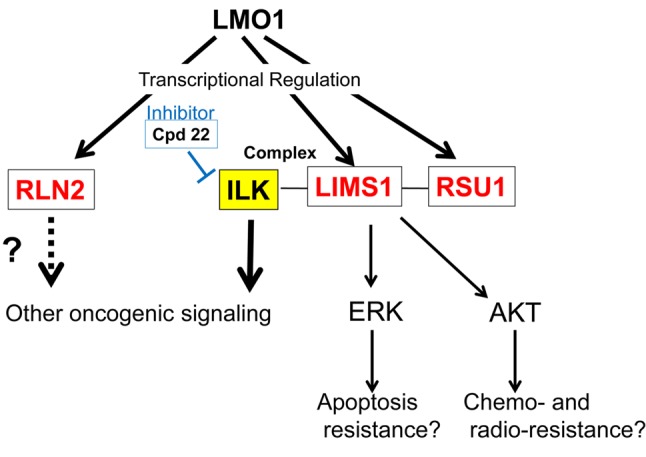
This study revealed that the LIMS1/ILK pathway is present in the downstream of the LMO1-regulatory cascade (Figure 6). LIMS1 protein has a role in several subcellular signallings at focal adhesions, as a complex with ILK and parvin (IPP complex), and the pathway involves several signallings related to carcinogenesis. Destabilization of the IPP complex enhances cell migration, which results from RAS signalling activation in tumorigenesis (20). Up-regulation of ILK is linked to EMT induction by thymosin β4 in colorectal cancer cells (21). In addition, LIMS1 protects cancer cells from apoptosis via extracellular signal-regulated kinase 1/2 (ERK1/2) activation, and also contributes to radio- and chemo-resistance by promoting Akt1 (serine-threonine protein kinase) activation (22,23). Moreover, the transforming growth factor β (TGFβ) up-regulates LIMS1, which induces epithelial-mesenchymal transition (EMT) in tubular cells of human kidney through down-regulation of E-cadherin and ZO-1 (Zona occludens 1) depending on ILK activity (24). ILK was reported to be expressed in 33% of Korean NB cases (3 in 9 cases) (25). In addition, supportive evidence was also obtained from clinical specimens. Microarray expression data set for 117 NB specimens (102 primary untreated neuroblastoma and 15 samples obtained at disease relapse) without MYCN amplification was available from ArrayExpress (E-GEOD-3446, http://www.ebi.ac.uk/arrayexpress/experiments/E-GEOD-3446/). The data set includes the expression data for three genes, LMO1, LIMS1 and ILK, which shows that the three genes are expressed in all of the117 NB specimens (data not shown). This suggests that these genes are expressed not only in the two cell lines, but also in a majority of clinical NB specimens. Although its precise function in NB remains to be elucidated, LMO1 was identified as an NB oncogene. Consequently, the LIMS1/ILK pathway is likely to have a critical role in NB carcinogenesis and a variety of potential therapeutic target molecules may be discovered in the pathway. Indeed, Cpd22 (1 μM in medium), an inhibitor of the LIMS1/ILK pathway showed cell-proliferation inhibition effects on the NB cell lines (Figure 5). The inhibitor previously showed the suppressive effect on prostate cancer cells: LNCaP (IC50: 1 μM) and PC-3 (2 μM); and breast cancer cells: MDA-MB-231 (1 μM), MDA-MB-468 (1.5 μM), SKBR3 (1.8 μM) and MCF-7 (2.5 μM) (19), while it significantly suppressed NB cell proliferation at 1 μM in our study, suggesting NB will respond well to treatment with the inhibitor. As Cpd22 is orally bioavailable and its tumor growth suppression was demonstrated in a mouse prostate cancer-xenograft model (19), it can be promptly applied to NB xenograft mice.
Figure 6. LMO1 regulates a LIMS1/ILK pathway. In this study, RLN2, RSU1 and LIMS1 genes are identified as LMO1’s regulatory targets. RSU1 and LIMS1 proteins act as a complex with ILK protein in focal adhesion, which is known to transduce several oncogenic signals. A cell proliferation inhibition effect of an ILK inhibitor Cpd22 is demonstrated in this study.
RLN2 was reported to promote proliferation of cultured leiomyoma cells and prostate cancer cells (26,27). It acted as an autocrine/paracrine factor and significantly increased anchorage-independent growth of thyroid carcinoma cell (28). In our study, shRLN2 decreased proliferation of the NB cells, which revealed, for the first time, the relevance of the gene to NB cell proliferation.
In this study, we searched for LMO1-target genes which are common to the 2 NB cell lines, and identified 3 genes. However, each cell line could have distinct LMO1-targets, reflecting a clinical heterogeneity of NB. In addition, definitions of the detected peaks in this study, peaks detected in more than 5 of the 9 settings of the peak-identification programs, might be overly strict, which may have resulted in the exclusion of other true LMO1-binding genomic regions. Therefore, the extension of an analytical approach could reveal other novel therapeutic targets.
This study revealed the presence of the LIMS1/ILK pathway downstream of the LMO1-regulating cascade, and many previous studies reported a carcinogenesis-relevant function of this pathway. This study offered strong evidence supporting the hypothesis suggested by the previous GWAS that LMO1 is an NB oncogene (9). As LMO1 is expressed in many NB cases, further studies on its downstream pathways should unveil other carcinogenesis-related pathways and molecules, which should lead to the development of a novel therapeutic strategy for HR-group NB patients. Intriguingly, other members of the LIM-domain-only proteins are known to be involved in oncogenic process of many types of cancer, and LMO3 is considered to be a neuroblastoma-associated oncogene, that could be a key molecule for discovery of novel oncogenic signalling in neuroblastoma (29).
Acknowledgements
This work was supported by the National Cancer Center Research and Development Fund (No. 23-B-18) and by JSPS KAKENHI Grant Number 26670510.
References
- 1.Maris JM, Hogarty MD, Bagatell R, Cohn SL. Neuroblastoma. Lancet. 2007;369:2106–2120. doi: 10.1016/S0140-6736(07)60983-0. [DOI] [PubMed] [Google Scholar]
- 2.Maris JM. Recent advances in neuroblastoma. N Engl J Med. 2010;362:2202–2211. doi: 10.1056/NEJMra0804577. [DOI] [PMC free article] [PubMed] [Google Scholar]
- 3.Cheung NK, Dyer MA. Neuroblastoma: developmental biology, cancer genomics and immunotherapy. Nat Rev Cancer. 2013;13:397–411. doi: 10.1038/nrc3526. [DOI] [PMC free article] [PubMed] [Google Scholar]
- 4.Morgenstern DA, Baruchel S, Irwin MS. Current and future strategies for relapsed neuroblastoma: challenges on the road to precision therapy. J Pediatr Hematol Oncol. 2013;35:337–347. doi: 10.1097/MPH.0b013e318299d637. [DOI] [PubMed] [Google Scholar]
- 5.Owens C, Irwin M. Neuroblastoma: The impact of biology and cooperation leading to personalized treatments. Crit Rev Clin Lab Sci. 2012;49:85–115. doi: 10.3109/10408363.2012.683483. [DOI] [PubMed] [Google Scholar]
- 6.Song HY, Rellinger EJ, Park SH, Paul P, Qiao J, Vasilopoulos A, Ozden O, Gius D, Chung DH. Inhibition of sirtuin 6 induces neuroblastoma differentiation. Anticancer Res. 2018;38:647–654. doi: 10.21873/anticanres.12268. [DOI] [PubMed] [Google Scholar]
- 7.Berger M, VON Schweinitz D. Therapeutic innovations for targeting childhood neuroblastoma: implications of the neurokinin-1 receptor system. Anticancer Res. 2017;37:5911–5918. doi: 10.21873/anticanres.12037. [DOI] [PubMed] [Google Scholar]
- 8.Abbou S, Lanvers-Kaminsky C, Daudigeos-Dubus E, LE Dret L, Laplace-Builhe C, Molenaar J, Vassal G, Geoerger B, within the ITCC Preclinical Evaluation Biology Committee Polo-like kinase inhibitor volasertib exhibits antitumor activity and synergy with vincristine in pediatric malignancies. Anticancer Res. 2016;36:599–609. [PubMed] [Google Scholar]
- 9.Wang K, Diskin SJ, Zhang H, Attiyeh EF, Winter C, Hou C, Schnepp RW, Diamond M, Bosse K, Mayes PA, Glessner J, Kim C, Frackelton E, Garris M, Wang Q, Glaberson W, Chiavacci R, Nguyen L, Jagannathan J, Saeki N, Sasaki H, Grant SF, Iolascon A, Mosse YP, Cole KA, Li H, Devoto M, McGrady PW, London WB, Capasso M, Rahman N, Hakonarson H, Maris JM. Integrative genomics identifies LMO1 as a neuroblastoma oncogene. Nature. 2011;469:216–220. doi: 10.1038/nature09609. [DOI] [PMC free article] [PubMed] [Google Scholar]
- 10.Oldridge DA, Wood AC, Weichert-Leahey N, Crimmins I, Sussman R, Winter C, McDaniel LD, Diamond M, Hart LS, Zhu S, Durbin AD, Abraham BJ, Anders L, Tian L, Zhang S, Wei JS, Khan J, Bramlett K, Rahman N, Capasso M, Iolascon A, Gerhard DS, Guidry Auvil JM, Young RA, Hakonarson H, Diskin SJ, Look AT, Maris JM. Genetic predisposition to neuroblastoma mediated by a LMO1 super-enhancer polymorphism. Nature. 2015;528:418–421. doi: 10.1038/nature15540. [DOI] [PMC free article] [PubMed] [Google Scholar]
- 11.Zhang J, Lin H, Wang J, He J, Zhang D, Qin P, Yang L, Yan L. LMO1 polymorphisms reduce neuroblastoma risk in Chinese children: a two-center case-control study. Oncotarget. 2017;8:65620–65626. doi: 10.18632/oncotarget.20018. [DOI] [PMC free article] [PubMed] [Google Scholar]
- 12.He J, Zou Y, Wang T, Zhang R, Yang T, Zhu J, Wang F, Xia H. Genetic variations of GWAS-identified genes and neuroblastoma susceptibility: a replication study in southern Chinese children. Transl Oncol. 2017;10:936–941. doi: 10.1016/j.tranon.2017.09.008. [DOI] [PMC free article] [PubMed] [Google Scholar]
- 13.Zhu S, Zhang X, Weichert-Leahey N, Dong Z, Zhang C, Lopez G, Tao T, He S, Wood AC, Oldridge D, Ung CY, van Ree JH, Khan A, Salazar BM, Lummertz da Rocha E, Zimmerman MW, Guo F, Cao H, Hou X, Weroha SJ, Perez-Atayde AR, Neuberg DS, Meves A, McNiven MA, van Deursen JM, Li H, Maris JM, Look AT. LMO1 Synergizes with MYCN to promote neuroblastoma initiation and metastasis. Cancer Cell. 2017;32:310–323. doi: 10.1016/j.ccell.2017.08.002. [DOI] [PMC free article] [PubMed] [Google Scholar]
- 14.Saeki N, Kim DH, Usui T, Aoyagi K, Tatsuta T, Aoki K, Yanagihara K, Tamura M, Mizushima H, Sakamoto H, Ogawa K, Ohki M, Shiroishi T, Yoshida T, Sasaki H. GASDERMIN, suppressed frequently in gastric cancer, is a target of LMO1 in TGF-beta-dependent apoptotic signalling. Oncogene. 2007;26:6488–6498. doi: 10.1038/sj.onc.1210475. [DOI] [PubMed] [Google Scholar]
- 15.Li H, Durbin R. Fast and accurate long-read alignment with Burrows-Wheeler transform. Bioinformatics. 2010;26:589–595. doi: 10.1093/bioinformatics/btp698. [DOI] [PMC free article] [PubMed] [Google Scholar]
- 16.Winograd-Katz SE, Fässler R, Geiger B, Legate KR. The integrin adhesome: from genes and proteins to human disease. Nat Rev Mol Cell Biol. 2014;15:273–288. doi: 10.1038/nrm3769. [DOI] [PubMed] [Google Scholar]
- 17.Hannigan G, Troussard AA, Dedhar S. Integrin-linked kinase: a cancer therapeutic target unique among its ILK. Nat Rev Cancer. 2005;5:51–63. doi: 10.1038/nrc1524. [DOI] [PubMed] [Google Scholar]
- 18.Nair VB, Samuel CS, Separovic F, Hossain MA, Wade JD. Human relaxin-2: historical perspectives and role in cancer biology. Amino Acids. 2012;43:1131–1140. doi: 10.1007/s00726-012-1375-y. [DOI] [PubMed] [Google Scholar]
- 19.Lee SL, Hsu EC, Chou CC, Chuang HC, Bai LY, Kulp SK, Chen CS. Identification and characterization of a novel integrin-linked kinase inhibitor. J Med Chem. 2011;54:6364–6374. doi: 10.1021/jm2007744. [DOI] [PMC free article] [PubMed] [Google Scholar]
- 20.Dougherty GW, Jose C, Gimona M, Cutler ML. The Rsu-1-PINCH1-ILK complex is regulated by Ras activation in tumor cells. Eur J Cell Biol. 2008;87:721–734. doi: 10.1016/j.ejcb.2008.02.011. [DOI] [PMC free article] [PubMed] [Google Scholar]
- 21.Huang HC, Hu CH, Tang MC, Wang WS, Chen PM, Su Y. Thymosin beta4 triggers an epithelial-mesenchymal transition in colorectal carcinoma by upregulating integrin-linked kinase. Oncogene. 2007;26:2781–2790. doi: 10.1038/sj.onc.1210078. [DOI] [PubMed] [Google Scholar]
- 22.Chen K, Tu Y, Zhang Y, Blair HC, Zhang L, Wu C. PINCH-1 regulates the ERK-Bim pathway and contributes to apoptosis resistance in cancer cells. J Biol Chem. 2008;283:2508–2517. doi: 10.1074/jbc.M707307200. [DOI] [PubMed] [Google Scholar]
- 23.Eke I, Koch U, Hehlgans S, Sandfort V, Stanchi F, Zips D, Baumann M, Shevchenko A, Pilarsky C, Haase M, Baretton GB, Calleja V, Larijani B, Fässler R, Cordes N. PINCH1 regulates Akt1 activation and enhances radioresistance by inhibiting PP1alpha. J Clin Invest. 2010;120:2516–2527. doi: 10.1172/JCI41078. [DOI] [PMC free article] [PubMed] [Google Scholar]
- 24.Li Y, Dai C, Wu C, Liu Y. PINCH-1 promotes tubular epithelial-to-mesenchymal transition by interacting with integrin-linked kinase. J Am Soc Nephrol. 2007;18:2534–2543. doi: 10.1681/ASN.2007030315. [DOI] [PubMed] [Google Scholar]
- 25.Chung DH, Lee JI, Kook MC, Kim JR, Kim SH, Choi EY, Park SH, Song HG. ILK (beta1-integrin-linked protein kinase): a novel immunohistochemical marker for Ewing’s sarcoma and primitive neuroectodermal tumour. Virchows Arch. 1998;433:113–117. doi: 10.1007/s004280050225. [DOI] [PubMed] [Google Scholar]
- 26.Suzuki K, Nakabayashi K, Yamada AY, Lodhi RS, Hazama R, Ebina Y, Yamada H. Recombinant H2 relaxin inhibits apoptosis and induces cell proliferation in cultured leiomyoma cells without affecting those in cultured normal myometrial cells. Fertil Steril. 2012;97:734–741. doi: 10.1016/j.fertnstert.2011.12.011. [DOI] [PubMed] [Google Scholar]
- 27.Silvertown JD, Ng J, Sato T, Summerlee AJ, Medin JA. H2 relaxin overexpression increases in vivo prostate xenograft tumor growth and angiogenesis. Int J Cancer. 2006;118:62–73. doi: 10.1002/ijc.21288. [DOI] [PubMed] [Google Scholar]
- 28.Hombach-Klonisch S, Bialek J, Trojanowicz B, Weber E, Holzhausen HJ, Silvertown JD, Summerlee AJ, Dralle H, Hoang-Vu C, Klonisch T. Relaxin enhances the oncogenic potential of human thyroid carcinoma cells. Am J Pathol. 2006;169:617–632. doi: 10.2353/ajpath.2006.050876. [DOI] [PMC free article] [PubMed] [Google Scholar]
- 29.Matthews JM, Lester K, Joseph S, Curtis DJ. LIM-domain-only proteins in cancer. Nat Rev Cancer. 2013;13:111–122. doi: 10.1038/nrc3418. [DOI] [PubMed] [Google Scholar]
- 30.Thorvaldsdóttir H, Robinson JT, Mesirov JP. Integrative Genomics Viewer (IGV): high-performance genomics data visualization and exploration. Brief Bioinform. 2013;14:178–192. doi: 10.1093/bib/bbs017. [DOI] [PMC free article] [PubMed] [Google Scholar]


