

Summary
Class switch recombination (CSR) at the immunoglobulin heavy-chain (IgH) locus is associated with the formation of R-loop structures over switch (S) regions. While these often occur co-transcriptionally between nascent RNA and template DNA, we now show that they also form as part of a post-transcriptional mechanism targeting AID to IgH S-regions. This depends on the RNA helicase DDX1 that is also required for CSR in vivo. DDX1 binds to G-quadruplex (G4) structures present in intronic switch transcripts and converts them into S-region R-loops. This in turn targets the cytidine deaminase enzyme AID to S-regions so promoting CSR. Notably R-loop levels over S-regions are diminished by chemical stabilization of G4 RNA or by the expression of a DDX1 ATPase-deficient mutant that acts as a dominant-negative protein to reduce CSR efficiency. In effect, we provide evidence for how S-region transcripts interconvert between G4 and R-loop structures to promote CSR in the IgH locus.
Keywords: R-loops, G-quadruplexes, DEAD-box RNA helicase 1, class switch recombination, activation-induced cytidine deaminase
Graphical Abstract
Highlights
-
•
DDX1 promotes R-loop formation and AID targeting to IgH S-regions
-
•
DDX1 binds to G4 structures present in intronic switch RNA
-
•
IgH S-region R-loops form post-transcriptionally, dependent on DDX1 and G4 RNA
-
•
DDX1 depletion or expression of a ATPase-deficient mutant impairs CSR in B cells
Ribeiro de Almeida and colleagues demonstrate that the RNA helicase DDX1 is required for IgH class switch recombination. DDX1 binds to G-quadruplex structures present in switch long non-coding RNA and promotes R-loop formation over S-region DNA, thereby targeting AID to the IgH locus.
Introduction
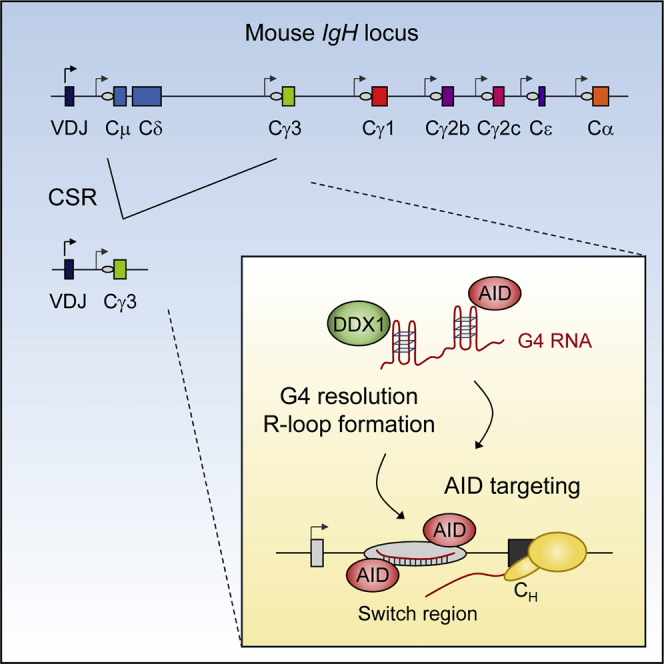
The mouse immunoglobulin heavy-chain (IgH) locus contains a set of constant (CH) region exons, which span a genomic sequence of approximately 220 kb and determine the isotype and effector function of antibodies. B cells activated by antigen undergo IgH class switch recombination (CSR), a DNA deletion mechanism that replaces the default Cμ constant region for one of several downstream CH exons (Cγ, Cε, or Cα) (Matthews et al., 2014). This process is strictly dependent on non-coding transcription initiated from intronic promoters located upstream of each set of CH exons (Chaudhuri et al., 2003, Ramiro et al., 2003). CSR long non-coding (lnc) RNAs are termed germline transcripts (GLTs) and include a non-coding first exon, which is spliced to downstream CH exons. Distinct sets of cytokines induce GLTs from distinct CH exons to promote CSR to that particular isotype, while GLTs upstream of the Cμ exon are produced constitutively (Stavnezer et al., 1988).
Transcription of each GLT first intron, which contain 1- to 10-kb-long sequences called switch (S) regions, promotes the formation of R-loops (Daniels and Lieber, 1995, Reaban and Griffin, 1990, Yu et al., 2003). These RNA:DNA hybrid structures are formed between the G-rich and highly repetitive lncRNA and the template DNA (Roy and Lieber, 2009, Roy et al., 2008, Zhang et al., 2014). R-loop formation results in non-template single-strand DNA (ssDNA) that may act as a substrate for activation-induced cytidine deaminase (AID), the enzyme that initiates CSR by deaminating cytidines to uracils (Chaudhuri et al., 2003). Resulting U:G mismatches are subsequently processed into DNA double-strand breaks (DSBs) by mismatch and base-excision DNA repair proteins and two distinct S-regions are ligated by non-homologous end-joining proteins (Matthews et al., 2014).
In support of this R-loop mechanism, transgenic mouse models showed that a synthetic DNA fragment with a G-rich non-template strand can support CSR and inversion of Sγ1 reduces R-loop formation and CSR to IgG1 (Shinkura et al., 2003). Both the negative supercoiling imposed by a transcribing polymerase (Parsa et al., 2012) and nascent RNA degradation by the RNA exosome complex (Basu et al., 2011) have been proposed to expose S-region DNA to deamination by AID. AID targeting may rely on components of the transcription machinery at sites of transcriptional stalling through AID association with Spt5 (Pavri et al., 2010). Recent evidence also supports a post-transcriptional, RNA-guided mechanism for the targeting of AID to complementary S-region DNA. AID was demonstrated to bind G-quadruplex (G4) structures present in μGLT and αGLT introns and an AID mutant unable to bind G4 RNA abolishes CSR to IgG1 (Zheng et al., 2015). Notably, switch G4 RNAs were shown to occur following intron lariat debranching catalyzed by DBR1 (Zheng et al., 2015). These findings may explain earlier observations implicating a direct role for GLT in CSR (Hein et al., 1998, Lorenz et al., 1995, Müller et al., 1998, Nowak et al., 2011). It was shown that induction of spliced switch transcripts is sufficient to target CSR to IgG1, whereas transcription alone is not (Lorenz et al., 1995). Possibly switch G4 RNA is closely regulated during CSR, even though it remains unclear how these highly structured RNAs can access DNA strands to target AID to IgH S-regions.
Recently, it has been shown that G4 or branched DNA structures act as preferred AID targets in vitro based on structural studies (Qiao et al., 2017). These reveal a bifurcated substrate binding-surface for AID that simultaneously binds two single-stranded sequences. Interestingly, AID appears to recognize both DNA and RNA with similar affinities, which may explain how AID binding to G4 RNA impacts on CSR (Pucella and Chaudhuri, 2017, Zheng et al., 2015). The exact nature of structured AID substrates in vivo is unclear but may involve both RNA and DNA counterparts (Pucella and Chaudhuri, 2017). Consequently, AID targeting to S-regions may require DEAD-box RNA helicase activity to reorganize G4 RNA and R-loop structures.
DEAD-box proteins share a highly conserved helicase core consisting of two RecA-like domains connected by a short flexible linker that bind or remodel RNA and RNA-protein complexes. They are characterized by at least 13 conserved sequence motifs involved in ATP binding, ATP hydrolysis, and RNA binding, including the Walker A motif I and Walker B motif II Asp-Glu-Ala-Asp (DEAD) (Linder and Jankowsky, 2011). The DEAD-box RNA helicase 1 (DDX1) has been implicated in various aspects of RNA metabolism including pre-mRNA 3′end processing (Bléoo et al., 2001, Chen et al., 2002), tRNA ligase catalyzed splicing (Jurkin et al., 2014, Popow et al., 2014), mRNA transport (Kanai et al., 2004), RNA export (Yasuda-Inoue et al., 2013), and the maturation of DNA damage-induced micro-RNAs (Han et al., 2014). Also, DDX1 may be part of the cellular response to DSBs occurring at sites of active transcription where it was shown to be required for efficient repair (Li et al., 2008, Li et al., 2016). A role for DDX1 in the innate immune response against viral infection has also been suggested as DDX1 together with DDX21 and DHX36 acts as a sensor of cytoplasmic double-strand RNA (dsRNA) (Zhang et al., 2011). Since DDX1 was previously identified in pull-down experiments using chromatin-bound AID as a bait (Willmann et al., 2012), we elected to investigate its potential role in CSR. We describe DDX1 as a critical effector of CSR that facilitates AID targeting to S-region DNA. We further elucidate the molecular mechanism whereby DDX1 acts on intronic switch G4 RNA to promote formation of S-region R-loops.
Results
DDX1 Knockout Impairs CSR in B Cells
In the spleen, B cells that encounter antigen are activated to proliferate as short-lived plasmablasts, undergo CSR and can enter into germinal centers (GCs). In the GC, B cells further differentiate into long-lived, antibody-secreting plasma cells. To examine whether changes in DDX1 gene expression accompany the differentiation of mature B cell subsets, we compared DDX1 mRNA levels in naive follicular B cells with activated plasmablasts, GC B cells and terminally differentiated plasma cells (Brazão et al., 2016). Interestingly, DDX1 expression increased 2-fold upon B cell activation and remained elevated in plasma cells residing in the spleen or the bone marrow (Figure S1A). This suggests that increased DDX1 expression occurs at stages when B cells undergo CSR and differentiate into antibody-secreting plasma cells.
To directly test whether DDX1 controls CSR we activated splenic B cells ex vivo. Stimulation with bacterial lipopolysaccharide (LPS) and LPS plus interleukin-4 (IL-4) induces naive B cell proliferation, and switching from IgM to IgG3 and IgG1, respectively. We observed induction of γ3 and γ1 GLT and a gradual decrease in μ GLT levels over 4 days (Figure S1B). Levels of AID encoding Aicda mRNA, were also markedly increased. Finally, a consistent increase in DDX1 protein levels upon LPS or LPS plus IL-4 stimulation was detected at day 3 (Figure S1C). For deletion of DDX1 we treated B cells isolated from DDX1loxP/loxP mice with recombinant TAT-Cre protein, which caused efficient excision of DDX1 exon 5 from the genome (Figures 1A and 1B) and a near complete loss of DDX1 protein (Figure 1C). As CSR is linked to cell division (Hodgkin et al., 1996), we labeled cells with the fluorescent cell tracking dye carboxyfluorescein succinimidyl ester (CFSE) to access CSR independently of cell proliferation. Notably, a 2-fold reduction in surface IgG3 and IgG1 expression was observed in DDX1-deleted cells as compared to control B cells (Figures 1D and 1E). This did not result from impaired cell proliferation, as a similar decrease in IgG1 CSR levels was observed in cells that underwent different numbers of cell divisions (Figure 1F). We conclude that DDX1 is required for efficient CSR in primary B cells.
Figure 1.

Impaired CSR in DDX1 Knockout B Cells
(A) Diagram of conditional DDX1 (DDX1loxP) and Cre-deleted DDX1 (DDX1del) alleles. PCR primers are indicated.
(B) PCR analysis of genomic DNA from DDX1loxP/loxP splenic B cells treated with TAT-Cre (2 replicates).
(C) Western blot of WT and DDX1-deleted (DDX1Δ) B cells (day 4, 2 replicates).
(D) Flow cytometric analysis for surface IgG3 and IgG1 expression and CFSE in WT and DDX1Δ B cells stimulated for 4 days.
(E) Quantification of CSR for cultures shown in (D). Each symbol represents B cell cultures from individual mice (n ≥ 3, mean ± SD).
(F) Percentage of IgG1+ cells analyzed per number of cell divisions in CFSE-labeled LPS plus IL-4 cultures at day 4. One representative experiment with 3 mice per genotype (mean ± SD).
(G) Serum Ig concentrations in naive WT and DDX1 cKO mice. Each symbol represents individual mice and horizontal lines indicate the mean.
(H) Antigen-specific IgG and IgM immune responses in WT and DDX1 cKO mice immunized with ovalbumin (OVA) antigen. Serum was analyzed by ELISA and endpoint titers were determined (n = 2, mean ± SD; 3–7 mice in each time point except week 10 where 2–3 mice were analyzed). See also Figure S1.
To further evaluate whether DDX1 is required for CSR in vivo, we used B cell-specific conditional DDX1 knockout mice. These were generated by expressing Cre recombinase specifically in activated B cells (DDX1loxP/loxP Aicda-Cre+/−, DDX1 cKO). Consistent with a role for DDX1 in CSR, sera from DDX1 cKO mice showed normal levels of IgM and a general decrease in the steady-state levels of switched IgH isotypes compared to wild-type (WT) mice (Figure 1G). Upon in vivo immunization with ovalbumin (OVA) antigen in complete Freund’s adjuvant, antigen-specific IgG responses were strongly increased in WT (Figure 1H). In contrast, serum levels of OVA-specific IgG were reduced in immunized DDX1 cKO mice, whereas OVA-specific IgM were slightly increased compared to WT (Figure 1H). Total levels of switched IgH isotypes were also decreased in DDX1 cKO mice after immunization, including IgG1 and IgG2c isotype that are strongly upregulated in WT mice (Figure S1D). Also, we observed induction of GC B cells and plasmablasts after DDX1 cKO mice immunization, albeit less than WT controls (Figures S1E and S1F). Remarkably, most plasmablasts in immunized DDX1 cKO mice have not undergone switching and retained expression of μ IgH (Figure S1F). Yet, both WT and DDX1 cKO splenocytes produce high levels of the switch-inducing cytokine interferon (IFN)-γ in response to OVA stimulation (Figure S1G). Taken together, these results demonstrate that DDX1 deficiency severely impairs CSR in vivo.
Transcription Is Largely Unaffected in DDX1-Depleted B Cells
To better characterize how DDX1 controls CSR, we employed the mouse CH12 cell line, which shows efficient IgM to IgA CSR following cytokine induction (Nakamura et al., 1996). CH12 cells were stably depleted of DDX1 using lentivirus-expressing short hairpin RNA (shRNA) (Figure 2A). CH12 cells transduced with a control shRNA (non-targeting, shCtrl) efficiently switch from IgM to IgA (∼50% IgA+IgM– cells), upon in vitro stimulation with anti-CD40, IL-4, and TGF-β (CIT) for 72 hr (Figure 2B). In contrast, DDX1 knockdown cell lines showed a 50% loss of IgA+IgM– cells in CIT cultures (Figures 2B and 2C). In control cells stimulated with CIT, we observed lower proliferation when compared to unstimulated conditions, as reflected by higher CFSE levels or lower dilution (Figure S2A). Cell-cycle analysis revealed an increased proportion of CIT cells in the G1-phase of the cell cycle (Figure S2B), likely due to AID-induced mutations and DNA repair mechanisms associated with CSR causing a G1 delay (Sharbeen et al., 2012). Surprisingly, knockdown of DDX1 resulted in increased proliferation rates and increased proportions of cells in the S-phase of the cell cycle upon CIT stimulation (Figures S2A and S2B). However, based on the frequency of IgA+ cells as a function of CFSE dilution, we conclude that DDX1 is required for efficient CSR in CH12 cells independently of cell proliferation (Figure S2C). We also performed CRISPR/Cas9-mediated gene inactivation of DDX1 (exon 5) in CH12 cells but no homozygous deletions were obtained, suggesting that DDX1 is essential for viability (Hildebrandt et al., 2015). A heterozygous clone with a frameshift mutation leading to a premature stop codon (Figure S2D) was obtained and expanded in culture. However, DDX1+/− CH12 cells show only a partial decrease in DDX1 protein levels and no effect on CSR as compared to WT cells (Figures S2E and S2F).
Figure 2.

Transcription Profiling in DDX1-Depleted CH12 Cells
CH12 cells transduced with shCtrl or shDDX1 were analyzed after 72 hr in unstimulated (UNS) or CIT-stimulated conditions.
(A) Western blot for DDX1 and Tubulin loading control.
(B) Flow cytometric analysis for surface IgM and IgA expression.
(C) Quantification of CSR for CIT cultures shown in (B) (average of 2 clones for each shRNA; n > 3, mean ± SD).
(D) Quantitative PCR analysis of chRNA after 24 hr in UNS or CIT conditions. Unspliced μGLT and αGLT levels were normalized to unspliced β-actin transcript and shCtrl UNS (n = 2, mean ± SD).
(E) Heatmap of 120 differentially expressed genes between shCtrl or shDDX1 CH12 cells in UNS or CIT conditions. Gene expression values (FPKM) are shown (fold change ≥2, false discovery rate [FDR] ≤0.05; n = 2). Hierarchical clustering identified 11 groups of genes (clusters I–XI) with similar patterns of expression change across the different samples analyzed. See also Figure S2.
To determine whether impaired CSR in DDX1-depleted cells is associated with changes in gene transcription, we analyzed nascent transcript levels in chromatin-associated RNA (chRNA) from shCtrl and shDDX1 CH12 cells. The purity of chRNA following nuclear fractionation was confirmed by the presence of unspliced β-actin RNA in the chromatin but not nucleoplasm fractions (Figure S2G). We next tested the effect of DDX1 depletion on nascent GLT levels in chRNA (Figure 2D). μGLT levels were relatively unaffected by CIT stimulation while αGLT increased significantly, consistent with constitutive μGLT and cytokine-induced αGLT transcription (Stavnezer et al., 1988). Of note, GLT levels were not substantially affected by DDX1 depletion (Figure 2D). Next, we performed high-throughput sequencing of chRNA (chRNA-seq) to measure genome-wide gene expression changes in DDX1-depleted CH12 cells. Most changes in differentially expressed genes were observed between unstimulated and CIT-stimulated conditions, irrespective of DDX1 knockdown (Figure 2E; Table S1). The few genes that were differentially expressed between shCtrl and shDDX1 cells (Figure 2E, clusters VII and VIII) were equally affected under unstimulated and CIT-stimulated conditions. Overall, we demonstrate that DDX1 is required for efficient CSR but does not affect gene expression levels per se.
Decreased R-Loop Levels over IgH S-Regions in DDX1-Depleted B Cells
Previous studies have reported the recruitment of DDX1 to sites of DNA damage containing RNA:DNA hybrids, where it may facilitate homologous recombination (Li et al., 2008, Li et al., 2016). Because R-loop structures over S-regions have been implicated in CSR (Shinkura et al., 2003, Yu et al., 2003), we evaluated R-loop levels over IgH genomic regions using the S9.6 RNA:DNA hybrid-specific antibody in DNA immunoprecipitation (DIP) assays (Figure 3A). We show that RNA:DNA hybrids were specifically enriched in regions flanking the Sμ repeats in unstimulated and CIT-stimulated shCtrl cells (Figure 3B) or upstream the Sα repeats in CIT-stimulated shCtrl cells (Figure 3C), consistent with previous studies (Huang et al., 2007, Kao et al., 2013). Note that the S-region core repeats cannot be directly measured for R-loops by PCR due to its repetitive sequence nature. Interestingly, reduced R-loop levels were detected in Sμ and Sα regions in shDDX1 CH12 cells following CIT stimulation (Figures 3B and 3C). Similar results were obtained when DDX1 was transiently depleted from CH12 cells using short-interfering RNA (siRNA), confirming that reduced R-loop levels is a direct effect of DDX1 depletion (Figures S3A–S3C). Validation of our DIP approach and the specificity of the S9.6 antibody was shown by loss of RNA:DNA hybrid signals upon treatment with recombinant RNaseH (Figures S3D and S3E). We conclude that DDX1 depletion results in reduced levels of R-loops over IgH S-regions once cells have been induced to undergo CSR.
Figure 3.

Reduced R-Loop Levels over IgH S-Regions in DDX1-Depleted Cells
(A) Diagram of the mouse IgH locus. Switch (S)-region core repeats (ovals) precede each set of constant region (CH) exons.
(B and C) A conserved transcription unit comprising a non-coding intervening (I)-exon, an intronic S-region and a downstream set of CH exons is expanded for μ (B) and α (C) regions. CH12 cells transduced with shCtrl or shDDX1 were analyzed by DIP with the S9.6 RNA:DNA hybrid-specific antibody (IP) or no antibody control (–), after 24 hr in UNS- or CIT-stimulated conditions. Probes employed (1–13) are indicated. Values were normalized both to probe 2 in each sample and probe 9 in shCtrl CIT cells in each experiment (n = 5, mean ± SD). Dashed line represents background signal (DIP levels for probe 2 in shCtrl UNS cells). See also Figure S3.
DDX1 Binds to G4 Structures in Intronic Switch RNAs
A notable feature of S-regions is that they are particularly enriched with clusters of guanines nucleotides (G-clusters) generally present among AID target motifs. Once transcribed as GLT, intronic G-clusters form G4 structures that have been shown to bind AID and somehow target it to S-region DNA (Zheng et al., 2015). We therefore tested the role of DDX1 in the G4 RNA-guided mechanism of CSR. We used biotinylated oligonucleotides containing four Sμ repeats in tandem (Sμ4G) in RNA pull-down assays (Figure 4A). Mutated Sμ4G lacking guanine clusters (Sμ4Gmut) cannot form G4 and was used as a negative control. We confirmed that Sμ4G forms G4 when stabilized by potassium (Sμ4G-K+) but not lithium (Sμ4G-Li+) cations, as shown by a higher molecular weight smear observed for Sμ4G-K+ samples following gel fractionation (Figure S4A). Also, circular dichroism spectroscopy showed a characteristic absorbance spectrum for parallel G4 structures in Sμ4G-K+, but not Sμ4G-Li+, samples (positive peak at ∼260 nm and negative peak at ∼240 nm, Figure S4B). We next mixed pre-folded RNA oligonucleotides with whole-cell extracts from CH12 cells stably expressing tagged AID (AIDFLAG-HA). As expected, AID was selectively pulled down with Sμ4G-K+ (Zheng et al., 2015). Notably, DDX1 was also pulled down using Sμ4G-K+ but not Sμ4G-Li+ or Sμ4Gmut oligonucleotides (Figure 4B). We then evaluated whether DDX1 binding was dependent on AID expression, as DDX1 has been shown to interact with chromatin-bound AID (Willmann et al., 2012). Extracts from AID-deficient CH12 cells obtained by CRISPR/Cas9-mediated gene inactivation (AID KO, Figures S4C–S4E) were used in the same pull-down experiment. Notably, DDX1 was still pulled down with Sμ4G-K+ oligonucleotides (Figure 4C) suggesting AID-independent interaction of DDX1 with G4 RNA. A RNA dot-blot assay confirmed that RNA amounts recovered from streptavidin beads in different conditions were equivalent (Figures 4B and 4C, bottom). We conclude that DDX1 specifically binds to Sμ4G RNA containing G4 structures independently of AID.
Figure 4.

DDX1 Binds to G4 Structures in Intronic Switch RNAs
(A) RNA oligonucleotides consisting of 4 tandem Sμ repeats (Sμ4G) or a G-to-C mutant (Sμ4Gmut).
(B and C) RNA pull-down assays with protein extracts from (B) AIDFLAG-HA or (C) AID KO CH12 cells, CIT stimulated for 48 hr. Western blots were analyzed for DDX1 and AID (FLAG tag) and RNA recovered from beads measured by dot blot. Representative results from at least 3 independent pull-downs.
(D) Native electrophoretic mobility shift assays (EMSA) with 32P-labeled Sμ4G and Sμ4Gmut RNA oligonucleotides and rDDX1 (WT) or rDDX1-K52A (ATPase mutant) proteins (1, 2, or 4 μg). Representative results from at least 3 independent assays.
(E–H) CH12 cells were transfected with a pcDNA3 vector expressing GFP or N-terminal GFP-tagged human DDX1-K52A cDNA (GFP::DDX1-K52A), and cultured in UNS or CIT-stimulated conditions.
(E) Percentage of GFP+ cells 24 hr and 40 hr after transfection measured by flow cytometry (n = 4, mean ± SD).
(F) Western blot of GFP+, fluorescence-activated cell sorted cells for DDX1 and Tubulin loading control (24 hr after transfection, 2 replicates).
(G) Quantification of CSR in GFP– and GFP+-gated cell populations (40 hr after transfection; n = 4, mean ± SD).
(H) DIP analyses with S9.6 antibody (IP) or no antibody control (–), 24 hr after transfection in CIT-stimulated conditions using Sα region probe 9.
Values were normalized to probe 2 in each sample and probe 9 in shCtrl CIT cells in each experiment (n = 3, mean ± SD). See also Figure S4.
We next performed native electrophoretic mobility shift assays (EMSAs) to show that recombinant human DDX1 (rDDX1) proteins (Kellner et al., 2015) directly bind 32P-labeled Sμ4G RNA oligonucleotides. RNA:protein complexes were readily detectable with increasing concentrations of rDDX1, as two major high-molecular-weight bands (Figure 4D). These two distinct complexes may reflect different conformations of the Sμ4G RNA or DDX1 dimer formation. Of note, binding of rDDX1 to Sμ4Gmut RNA was completely abolished (Figure 4D). A mutant version of rDDX1, where the conserved lysine residue in the Walker A motif I was mutated to alanine (rDDX1-K52A) (Kellner et al., 2015) was also tested. The Walker A motif is part of the ATP-binding site in DEAD-box helicases and is found in many NTPases (Pause and Sonenberg, 1992). Interestingly, rDDX1-K52A showed enhanced binding to Sμ4G RNA as compared to rDDX1 (Figure 4D). We confirmed rDDX1 and rDDX1-K52A bind specifically to G4 RNA and not G4 DNA (Figure S4F) or ssDNA (Figure S4G). Limiting amounts of rDDX1 proteins and oligonucleotides that form tetramolecular G4 substrates were used to compare protein binding affinity to G4 RNA and G4 DNA structures. As before, mutant rDDX1-K52A showed enhanced binding to G4 RNA compared to rDDX1 and a gel shift band of a higher molecular weight, which may reflect multiple rDDX1-K52A molecules binding to one or more G4 RNA. Notably, no G4 DNA interaction with either WT or mutant rDDX1 was detectible. Our observations reveal that DDX1 directly binds to G4 RNA and that an ATPase-deficient mutant forms a more stable complex, indicative of reduced substrate turnover.
The above findings prompted us to investigate whether DDX1-K52A functions as a dominant-negative mutant when introduced into CH12 cells. Following transient transfection of N-terminal GFP-tagged human DDX1-K52A cDNA into CH12 cells, we observed a strong selection against cells expressing DDX1-K52A (Figure 4E). Furthermore, GFP+ cells expressed only low levels of mutant DDX1 when compared to endogenous DDX1 protein levels (Figure 4F). Despite this, DDX1-K52A-expressing cells showed significantly reduced CSR toward IgA upon CIT stimulation (Figure 4G). The levels of IgA+ cells in CIT cultures was approximately half of that of cells expressing GFP only or untransfected cells (GFP–). Interestingly, we also detected reduced R-loop levels upstream of the Sα region in CIT-stimulated cells expressing DDX1-K52A when compared with cells expressing only GFP (Figure 4H). These results show that a DDX1 mutant deficient for ATP hydrolysis can compete effectively with an excess of WT DDX1 to reduce CSR. It is possible that DDX1-K52A sequesters G4 RNA away from WT DDX1. This will in turn impair the formation of RNA:DNA hybrids over IgH S-regions and so diminish efficient CSR.
DDX1 Modulates G4 and R-Loop Structures
We next aimed to connect our DDX1 and G4 RNA interaction data (Figures 4B–4D) with diminished R-loop levels over IgH S-region in DDX1-depleted cells (Figure 3). To do this, we employed pyridostatin (PDS), a generic G4-interacting small molecule. PDS has been show to bind and stabilize G4 structures at telomeres and other regions of the human genome where it induces DNA damage and cell-cycle arrest (Rodriguez et al., 2012). We therefore treated shCtrl and shDDX1 CH12 cells with PDS for a 4-hr period, which did not affect cell division (Figure S5A). DIP analysis confirmed that similar levels of R-loops were detected after 4 or 24 hr of CIT stimulation (Figure S5B). Interestingly, we observed a 2-fold decrease in R-loop levels upstream Sμ and Sα regions in PDS-treated shCtrl cells when compared with DMSO controls (Figures 5A and 5B). To rule out the possibility that decreased R-loop levels in PDS-treated cells is due to stabilization of G4 structures on the non-template DNA stand of S-regions (Dempsey et al., 1999, Duquette et al., 2004), we employed the G4 RNA-specific derivative carboxyPDS (cPDS) (Di Antonio et al., 2012). As with PDS, we observed a 2-fold decrease in R-loop levels upstream Sμ and Sα regions in cPDS-treated shCtrl cells (Figures 5A and 5B). In contrast, when DDX1 was depleted similar R-loop levels were detected between DMSO and PDS or cPDS conditions. These results suggest that G4 RNA stabilization reduces R-loops over IgH S-regions in effect antagonizing DDX1.
Figure 5.

DDX1 and G4 RNA-Dependent R-Loops in IgH S-Regions
(A and B) CH12 cells transduced with shCtrl or shDDX1 were analyzed by DIP with S9.6 antibody (IP) or no antibody control (–). Cells were cultured in CIT-stimulated conditions with DMSO (Control), the G4 stabilizer pyridostatin (PDS, 10 μM), the G4 RNA-specific derivative carboxypyridostatin (cPDS, 10–40 μM) or the splicing inhibitor Pladienolide B (PlaB, 1 μM) for 4 hr. DIP signals shown for upstream Sμ region (probe 4) (A) and Sα region (probe 10) (B). Values were normalized to shCtrl DMSO (n ≥ 3, mean ± SD).
(C–E) In vitro RNA:DNA hybrid assay using 32P-labeled tetramolecular G4 RNA and complementary DNA strands. Reactions were performed with 1 μg WT or an ATPase mutant (K52A) of rDDX1 at 25°C for 10 min (C and D) or 10, 20, and 30 min (E). (D) RNaseH treatment of RNA:DNA hybrids. Data shown in (C) and (D) are representative of at least 3 independent assays. See also Figure S5.
Next, we evaluated whether limiting the production of G4 RNA decreased R-loop levels over IgH S-regions. ShCtrl and shDDX1 CH12 cells were treated with the spliceosome inhibitor Pladienolide B (PlaB) as G4 RNA has been shown to derive from switch RNA introns (Zheng et al., 2015). When cells were treated with PlaB and CIT stimulation for 4 hr, we observed 50% lower levels of R-loops upstream Sμ and Sα regions in shCtrl cells as compared to DMSO controls (Figures 5A and 5B). Notably, this PlaB effect was not evident in DDX1-depleted cells. The possibility that splicing inhibition decreases R-loop levels per se and is not due to decreased accumulation of intronic G4 RNA was tested by treating cells with PlaB only after 20 hr of CIT stimulation (Figure S5C). In this case, a similar abundance of Sμ-region R-loops was observed in both PlaB-treated and DMSO control cells. Sα-region R-loops were however slightly decreased under these conditions. As a control, transcription elongation was inhibited using Actinomycin D (ActD) or 5,6-Dichloro-1-β-D-ribofuranosylbenzimidazole (DRB) after 20 hr of CIT stimulation. A marked decrease in S-region R-loop levels in shCtrl and shDDX1 CH12 cells was observed (Figure S5D). We used qPCR to confirm increased levels of unspliced GLT in the presence of PlaB and a robust inhibition of μ and α GLTs with both ActD and DRB (Figure S5E). We conclude that when the accumulation of intronic switch RNA is prevented from the onset of CIT stimulation, the levels of R-loops over IgH S-regions are decreased by half even in the presence of DDX1.
To directly test whether DDX1 can convert G4 RNA into RNA:DNA hybrids, in vitro assays were carried out using 32P-labeled tetramolecular G4 RNA and complementary DNA strands. Higher-order G4 RNA:protein complexes were detected in the presence of WT or K52A mutant rDDX1 protein, confirming DDX1 binding to G4 RNA structures (Figure 5C). Notably, a distinct band was also detected when both rDDX1 and complementary DNA strands were used (Figure 5C). To confirm that this band is a RNA:DNA hybrid, we verified its sensitivity to RNaseH treatment (Figure 5D). Importantly, the intensity of the RNA:DNA hybrid signal was diminished when the rDDX1-K52A mutant was used even when the reaction was allowed to proceed for longer periods of time (Figure 5E). These in vitro experiments demonstrate that rDDX1 acts on G4 RNA structures to convert them into RNA:DNA hybrids. Taken together, we predict that DDX1 acts to promote the conversion of switch G4 RNA into S-region R-loops at the IgH locus.
AID Binding to IgH S-Regions Is Dependent on DDX1
The ability of DDX1 to bind G4 RNA prompted us to investigate whether impaired CSR in DDX1-depleted cells is due to reduced AID binding to S-region DNA. We observed a significant reduction of AID occupancy upstream Sμ and Sα regions in DDX1-depleted cells by chromatin immunoprecipitation (ChIP) (Figures 6A and 6B), even though we detected near equal amounts of AID in whole-cell and nuclear extracts in shCtrl and shDDX1 CH12 cells (Figure 6C). To clearly distinguish AID-specific signal from background levels, we determined ChIP signals in AID KO CH12 cells (Figures 6A and 6B). Strikingly, AID binding to IgH S-regions in DDX1-depleted cells was reduced to background levels. Because AID is a DNA mutator enzyme, it has low nuclear abundance compared to the cytoplasm, as observed by immunofluorescence (IF) staining (Figure S6A). Although nuclear AID IF signals were slightly reduced in DDX1-depleted cells (Figure S6B), this small difference could not account for the strong decrease on AID occupancy at IgH S-regions (Figures 6B and 6C). Similarly, co-immunoprecipitation experiments showed that only a small proportion of nuclear AID (less than 5%) directly interacts with DDX1 (Figures 6D and 6E), possibly the fraction that is chromatin bound (Willmann et al., 2012). Thus, it is unlikely that DDX1 recruits AID through direct protein-protein interactions. Instead, we predict that, in B cells undergoing CSR, DDX1 is required for efficient AID targeting to S-regions via switch G4 RNA. In effect, DDX1 may act to increase AID retention on the non-template DNA strand by promoting R-loop formation over S-regions.
Figure 6.

Reduced AID Binding to IgH S-Regions in DDX1-Depleted Cells
CH12 cells transduced with shCtrl or shDDX1 were cultured in CIT-stimulated conditions and analyzed after 24 hr.
(A and B) AID ChIP analysis in μ (A) and α (B) regions. Values shown for antibody (IP) or IgG control are expressed as percentage of Input (n = 3, mean ± SD). AID KO CH12 cells were used to determine background levels (dashed line represents probe 2 signal).
(C) Western blot of whole-cell and nuclear protein extracts for DDX1 and AID. Purity of nuclear extracts is shown by absence of cytoplasmic Tubulin, and CTCF levels were used as loading control. Amount of nuclear extract loaded is 15 times increased compared to the equivalent amount of whole cell extracts (WCEs). Data are representative of 3 independent experiments.
(D and E) Co-immunoprecipitation assays with anti-DDX1 antibody and nuclear protein extracts from (D) AIDFLAG-HA or (E) WT CH12 cells CIT stimulated for 24 hr. Western blots were analyzed for DDX1, AID (or FLAG tag), and the tRNA ligase subunit RTCB as a positive control. Representative results from 2 independent pull-downs on each cell type.
(F) Frequency of Sμ mutations (shCtrl normalized; n = 4, mean ± SD). Number of mutations per total number of bp analyzed and percentage of mutation in recombined Sμ DNA sequences in each experiment are shown in Figure S7A.
(G) Number of Sμ mutations at each nucleotide, expressed per 103 bp (n = 4). Unique Sμ-Sα sequences were amplified from genomic DNA extracted from shCtrl (50 sequences) or shDDX1 (62 sequences) CH12 cells cultured in CIT conditions for 72 hr.
See also Figures S6 and S7.
Next, we determined the effect of DDX1 depletion on Sμ mutation frequency and nucleotide specificity in DNA sequences from Sμ-Sα recombination products in CH12 cells. Overall decreased levels of Sμ mutation were detected after DDX1 knockdown (Figure 6F and Figure S7A), specifically at G/C base pairs (Figure 6G), which is consistent with diminished AID occupancy. To further extend this analysis, we mapped recombination breakpoints across both Sμ and Sα regions in 100-bp bins relative to PCR primer positions (Figure S7B). We observed a clear overrepresentation of Sμ recombination sites within bin F, particularly in shDDX1 cells. Detailed analysis of these Sμ breakpoints in shCtrl cells revealed a strong preference for recombination with Sα sequences within bin L (Figure S7B) and a characteristic 9- to 10-nt length of complementary nucleotides or microhomology (MH) at the Sμ-Sα breakpoint (Table S2). In contrast, for shDDX1 cells around half of the Sμ breakpoints within the bin F were recombined to Sα sequences within bin R (Figure S7B) and showed 1 nucleotide length of Sμ-Sα MH (Table S3). The length of MH regions present at S-S junctions reflects the end-joining processes that ligate DSBs. CSR primarily depends on canonical non-homologous end joining (NHEJ) mechanisms for DSB repair but sometimes cells employ an alternative NHEJ repair pathway characterized by larger stretches of MH present at S-S junctions (Boboila et al., 2012). Therefore, we analyzed the length of MH regions at all Sμ-Sα recombination products. The majority of Sμ-Sα junctions in shCtrl CH12 cells share between 0 and 4 nt of MH between donor and acceptor sequences (Figure S7C). However, a considerable proportion of Sμ-Sα junctions revealed more than 4 nt of MH, reflective of alternative NHEJ mechanisms. This pattern was also observed in DDX1 knockdown cells, although there was a significant increase in the percentage of Sμ-Sα junctions with a single-nucleotide homology (Figure S7C). We conclude that the skewed distribution of Sμ-Sα recombination breakpoints in DDX1-depleted cells underlies the prevalence of Sμ-Sα junctions with a single-nucleotide homology. However, in the context of CSR both canonical and MH-mediated NHEJ mechanisms still operate upon DDX1 depletion.
Discussion
We identify DDX1 as a DEAD-box RNA helicase required for CSR at the IgH locus. We provide evidence that DDX1 directly binds to G4 structures present within intronic switch RNA and by so doing targets AID to S-region DNA to promote CSR. We suggest that switch G4 RNA is modulated by DDX1-dependent mechanisms leading to R-loop formation over IgH S-regions (Figure 7). This post-transcriptional mechanism of R-loop formation contrasts with the view that that R-loops exclusively form co-transcriptionally when RNA exits RNA polymerase II during transcription and anneals with the template DNA strand (Roy et al., 2008). The presence of G-clusters has been described as a key determinant of co-transcriptional R-loop formation as these clusters may act to nucleate thread-back of RNA into the DNA duplex behind the elongating polymerase (Roy and Lieber, 2009, Zhang et al., 2014). We propose that post-transcriptional R-loop formation also relies on the presence of G-clusters in intronic switch RNA to form G4 structures that are recognized by DDX1 and target AID to IgH S-regions through RNA:DNA base-pairing. Previous studies have reported that limiting the generation of switch RNA introns by shRNA-mediated knockdown of the lariat debranching enzyme DBR1 had no detectable effect on R-loop levels (Zheng et al., 2015). Possibly sufficient G4 RNA remained in these DBR1-depleted cells to still allow full R-loop formation. We predict that both co-transcriptional and post-transcriptional mechanisms may cooperate to allow efficient CSR (Figure 7).
Figure 7.

Model for DDX1 Role in CSR
(A) RNA polymerase II (Pol II) makes switch transcripts, which are spliced to release the G4 containing intron. Intron lariat intermediates are debranched by the DBR1 enzyme as previously shown (Zheng et al., 2015). This converts the intron lariat into its linear form prior to folding into G4 RNA structures. Presumably, switch transcripts are trimmed by 5′ and 3′ exonucleases. G4 RNA and AID are then targeted to the S-region DNA through the action of the RNA helicase DDX1 that promotes the formation of R-loops. Hypothetically, hybrid G4 RNA:DNA structures could also occur in the non-template DNA strand (Pucella and Chaudhuri, 2017).
(B) R-loops form behind elongating Pol II in S-region and recruit AID to the single-strand DNA.
Recent studies have demonstrated that G4 RNAs are globally unfolded in eukaryotic cells, presumably due to their deleterious effects on gene expression (Guo and Bartel, 2016). These findings have led to the suggestion that G4 RNAs are under tight regulation and are restricted to particular cell types or stages. We anticipated that B cells induced to undergo CSR provide a clear example of such regulation as a specific mechanism to target AID to the IgH locus (Zheng et al., 2015). Previously, only the DEAD/DEAH-box family RNA helicases DHX36, DHX9, and DDX21 have been shown to act on G4 RNA in vitro (Chakraborty and Grosse, 2011, Creacy et al., 2008, McRae et al., 2017). Our findings now demonstrate a physiological role for DDX1 in B cells undergoing CSR as part of the molecular machinery that modulates switch G4 RNA and R-loop structures. Importantly, we demonstrate that DDX1 cKO mice have reduced levels of switched Ig both at steady state and following immunization. While it is possible that DDX1 is involved in other aspects of B cell activation that can affect antibody responses, these data constitute definitive evidence for a role for G4 RNA in CSR physiology.
Recent studies show that AID deaminates ssDNA more robustly in the context of structured substrates, such as G4 or branched structures (Qiao et al., 2017). Interestingly, AID recognition occurs on single-stranded overhangs, either of DNA or RNA nature. In this context, G4 RNA-dependent targeting of AID to S-regions could rely on the DDX1-mediated formation of hybrid RNA:DNA structures, perhaps in the form of combined G4 and R-loops (Figure 7). However, whether such G4-R-loop structures are present at the IgH locus remains to be experimentally tested (Pucella and Chaudhuri, 2017). G4 DNA structures have been previously reported to be present on the non-template DNA strand of Sμ and Sγ regions in vitro (Dempsey et al., 1999, Duquette et al., 2004). However, other studies failed to detect such G4 DNA structures in Sγ3 and Sγ2b regions in LPS-stimulated B cells (Yu et al., 2003). It would be important to evaluate the exact nature of G4 structures present in vivo at the IgH locus, as a G4 RNA-mediated AID targeting mechanism may also occur at non-Ig loci (Zheng et al., 2015). So far, only anti-sense (Pefanis et al., 2014) and convergent transcription at super-enhancers (Meng et al., 2014, Qian et al., 2014, Wang et al., 2014) have been shown to be involved in inappropriate targeting of AID at non-Ig hotspots by providing ssDNA substrates.
Many DEAD-box family members can only catalyze the unwinding of short dsRNA (≤14 bp) by local strand separation, a process reduced by increased substrate stability (GC content) (Rogers et al., 2001). Interestingly, DHX36 has been suggested to resolve G4 RNA structures by a similar mechanism employed by DEAD-box helicases on dsRNA (Chen et al., 2015). Possibly the partial unwinding of switch G4 RNA by DDX1 is facilitated by simultaneous base-pairing of unfolded RNA to S-region DNA in a R-loop structure. In this context, exosome activity could expose the template DNA strand for RNA annealing (Basu et al., 2011). Alternatively, anti-sense transcription at S-regions could also render the template DNA strand free to base pair with switch RNA (Perlot et al., 2008). Also, exposed stretches of ssDNA have been proposed to occur in S-regions as a result of R-loop collapse following RNaseH action or negative supercoiling behind transcribing RNA polymerase II (Parsa et al., 2012, Yu et al., 2003).
DDX1-mediated R-loop formation downstream of G4 RNA may also be coordinated through interaction of DDX1 with other protein factors. Previous studies have demonstrated that DDX1 has higher affinity for ADP then ATP, which might cause the protein to be predominantly found in a dead-end ADP-bound form at cellular nucleotide concentrations (Kellner et al., 2015). It has been suggested that DDX1 recycling relies on interactions with other proteins through its unique SPRY domain, known to function as a protein-protein interaction platform (Kellner and Meinhart, 2015, Kellner et al., 2015). This may explain why our in vitro results show only partial DDX1-dependent conversion of G4 RNA into RNA:DNA hybrids. In a cellular context DDX1 is part of different multimeric protein complexes, such as tRNA ligase (Popow et al., 2014), the Drosha microprocessor (Han et al., 2014), and the dsRNA sensor DDX1-DDX21-DHX36 complex (Zhang et al., 2011). The tRNA ligase has been previously implicated in the control of antibody secretion in plasma cells, where it mediates unconventional splicing of the mRNA encoding for the transcription factor XBP1 as part of the unfolded protein response (Jurkin et al., 2014). It will be interesting to determine which interacting proteins are functionally linked to the role of DDX1 in CSR.
DDX1 has been associated with cellular events downstream of DNA damage and its phosphorylation by ATM precedes recruitment to sites of DSBs containing RNA:DNA structures (Li et al., 2008). In this context, DDX1 may be required to clear RNA from DSBs located within transcription units. This may preserve end-resected DNA in a single-strand conformation and so enable homology-directed DSB repair (Li et al., 2016). In DDX1-depleted cells, we detected a skewed distribution of recombination breakpoints in IgH S-regions, also reflected in the length of MH at S-S junctions. While these effects might be a direct consequence of defective AID targeting, the role of DDX1 in homology-directed DSB repair may also relate to IgH recombination. A recent study proposed that R-loops have important roles downstream of AID targeting, by contributing to replication origin specification that promotes DSB resolution in CSR (Wiedemann et al., 2016). Future experiments are required to establish whether DDX1 has a role on CSR steps downstream of AID targeting, such as in the resolution of DSBs.
In summary, we reveal the DEAD-box RNA helicase DDX1 as a molecular player in the post-transcriptional, RNA-guided mechanisms of AID targeting during CSR. Furthermore, we uncover a previously unanticipated role for DDX1-dependent G4 RNA remodeling in the regulation of R-loop levels over IgH S-regions. These findings may well extrapolate to other molecular functions of G4 RNA.
STAR★Methods
Key Resources Table
| REAGENT or RESOURCE | SOURCE | IDENTIFIER |
|---|---|---|
| Antibodies | ||
| Purified anti-mouse/rat CD40 (HM40-3) | eBioscience | 16-0402-81 |
| Purified anti-mouse CD16/CD32 (2.4G2) | BD Biosciences | 553141 |
| PE anti-mouse CD19 (1D3) | eBioscience | 12-0193-82 |
| PCP-Cy5.5 anti-mouse CD19 (1D3) | eBioscience | 45-0193-82 |
| PE anti-mouse CD95 (Jo2) | BD Biosciences | 561985 |
| Alexa Fluor 488 anti-human/mouse GL-7 (GL-7) | eBioscience | 53-5902-82 |
| PE anti-mouse CD138 (281-2) | Biolegend | 142503 |
| FITC anti-mouse IgM (eB121-15F9) | eBioscience | 11-5890-82 |
| Biotin anti-mouse IgA (11-44-2) | eBioscience | 13-5994-82 |
| Biotin anti-mouse IgG3 (R40-82) | BD Biosciences | 553401 |
| Biotin anti-mouse IgG1 (A85-1) | BD Biosciences | 553441 |
| Alexa Fluor 488 anti-mouse μ-heavy-chain | ThermoFischer | A21042 |
| Alexa Fluor 488 anti-rabbit IgG | ThermoFischer | A11034 |
| FITC anti-BrdU (clone 3D4) | BioLegend | 364104 |
| Mouse monoclonal anti-RNA:DNA hybrids (S9.6) | Hybridoma | |
| Mouse polyclonal anti-DDX1 | Novus Biologicals | H00001653-A01 |
| Rabbit polyclonal anti-DDX1 | ProteinTech | 11357-1-AP |
| Mouse monoclonal anti-HSPC117/FAAP (RTCB) | Santa Cruz | sc-393966 |
| Rabbit monoclonal anti-AID (30F12) | Cell Signaling | 4949 |
| Mouse monoclonal anti-AID (L7E7) | Cell Signaling | 4975 |
| Rabbit polyclonal anti-AID | Chaudhuri lab | Chaudhuri et al., 2003 |
| Rabbit polyclonal anti-FLAG tag (PA1-984B) | ThermoFischer | PA1-984B |
| Mouse monoclonal anti-FLAG tag (M2)-HRP | Sigma-Aldrich | A8592 |
| Rabbit polyclonal anti-Actin | Sigma-Aldrich | A2066 |
| Mouse monoclonal anti-Tubulin (B-5-1-2) | Sigma-Aldrich | T5168 |
| Rabbit polyclonal anti-Histone H3 | Abcam | ab1791 |
| Rabbit polyclonal anti-CTCF | Millipore | 07-729 |
| Anti-mouse IgG1 heavy-chain-HRP | Abcam | ab97240 |
| Anti-mouse IgG (h+l)-HRP (ELISA detection) | Bethyl | A90-516P |
| Purified anti-mouse IgM (II/41) (ELISA capture) | BD Biosciences | 553435 |
| Anti-mouse IgM-HRP (ELISA detection) | Sigma-Aldrich | A8786 |
| Chemicals, Peptides, and Recombinant Proteins | ||
| EndoFit Ovalbumin | InvivoGen | vac-pova |
| Albumin from chicken egg white (Grade V) | Sigma-Aldrich | A5503 |
| Complete Freund’s Adjuvant | Sigma-Aldrich | F5881 |
| Incomplete Freund’s Adjuvant | Sigma-Aldrich | F5506 |
| Lipopolysaccharide (LPS) E. coli O55:B5 | Sigma-Aldrich | L2880 |
| Lectin from Arachis hypogaea (PNA), biotin conjugate | Sigma-Aldrich | L6135 |
| Recombinant murine IL-4 | Peprotech | 214-14 |
| Recombinant human TGF-β1 | R&D | 240-B |
| Puromycin dihydrochloride | Sigma-Aldrich | P8833 |
| Pyridostatin trifluoroacetate salt (PDS) | Sigma-Aldrich | SML-0678 |
| Carboxypyridostatin trifluoroacetate salt (cPDS) | Balasubramanian lab | |
| Pladienolide B (PlaB) | Santa Cruz | Sc-391691 |
| Actinomycin D (ActD) | Sigma-Aldrich | A9415 |
| 5,6-Dichloro-1-β-D-ribofuranosylbenzimidazole (DRB) | Sigma-Aldrich | D1916 |
| Polybrene (Hexadimethrine bromide) | Sigma-Aldrich | H9268 |
| Carboxyfluorescein succinimidyl ester (CFSE) | Biolegend | 422701 |
| 5-bromo-2′-deoxyuridine (BrdU) | Sigma-Aldrich | B5002 |
| TAT-CRE Recombinase | Millipore | SCR508 |
| Recombinant human DDX1 (amino acids 1–728) | Meinhart Lab | Kellner et al., 2015 |
| Recombinant human DDX1-K52A (amino acids 1–728) | Meinhart Lab | Kellner et al., 2015 |
| Critical Commercial Assays | ||
| Amaxa Cell Line Nucleofector Kit R | Lonza | VCA-1001 |
| Mouse B cell isolation Kit | Miltenyi Biotec | 130-090-862 |
| ProcartaPlex mouse antibody isotyping kit | ThermoFischer | EPX070-20816-901 |
| Ribo-Zero rRNA Removal kit | Illumina | MRZH11124 |
| NEBNext Ultra Directional RNA Library Prep kit | New England Biolabs | E7420S |
| NEBnext multiplex Oligos (Index Primers Set 2) | New England Biolabs | E7500S |
| ProcartaPlex Mouse Antibody Isotyping Panel 2 7plex | ThermoFisher | EPX070-20826-901 |
| IFN gamma Mouse ELISA Kit | ThermoFisher | BMS606 |
| Deposited Data | ||
| chRNA-seq data | This paper | GEO: GSE95635 |
| Raw image files | Mendeley Data | https://data.mendeley.com/datasets/z747pf6sd9/draft?a=c2b73047-5f9c-4ad9-b65a-9894f4fedfb0 |
| Experimental Models: Cell Lines | ||
| Mouse: CH12 cells | Khamlichi Lab | Nakamura et al., 1996 |
| Mouse: CH12-AIDFLAG-HA cells | Reina-San-Martin Lab | Jeevan-Raj et al., 2011 |
| Mouse: CH12 shCtrl cells | This paper | N/A |
| Mouse: CH12 shDDX1 cells | This paper | N/A |
| Human: HEK293T | ATCC | CRL-11268 |
| Experimental Models: Organisms/Strains | ||
| C57BL/6N-Ddx1tm1a(EUCOMM)Hmgu/Cnrm mice | Infrafrontier/EMMA | EM:08387 |
| ROSA26::FLPe mice | The Jackson Lab | JAX stock 003946 |
| Aicda-Cre mice | Busslinger Lab | Kwon et al., 2008 |
| Oligonucleotides | ||
| Sμ4G RNA GAGCUGGGGUGAGCUGG GGUGAGCUGGGGUGAGCUGGGGU |
IDT | Zheng et al., 2015 |
| Sμ4G mut RNA GAGCUGCGCUGAGCUGCGCU GAGCUGCGCUGAGCUGCGCU |
IDT | Zheng et al., 2015 |
| Tetramolecular G4 RNA (A15G5A15) AAAAAAAAA AAAAAAGGGGGAAAAAAAAAAAAAAA |
Dharmacon | Creacy et al., 2008 |
| Complementary DNA (T15C5T15) TTTTTTTT TTTTTTTCCCCCTTTTTTTTTTTTTTT |
Sigma-Aldrich | N/A |
| Tetramolecular G4 DNA (A15G5A15) AAAAAAAAAA AAAAAGGGGGAAAAAAAAAAAAAAA |
Dharmacon | N/A |
| Single-stranded DNA ATCGGAATGTATGA GAATAGAAGAGATAATGAATAATAGAA |
Sigma-Aldrich | Dickerson et al., 2003 |
| shDDX1 (mouse DDX1 exon 19) GATGTGGT CTGAAGCTATTAA |
Sigma-Aldrich | N/A |
| SMARTpool: siGENOME Ddx1 siRNA | Dharmacon | M-052098-00 |
| Anti-Luc siRNA1 | Dharmacon | D-002050-01 |
|
DDX1 gRNA (mouse DDX1 exon 5) TCATACAC TATCTGGATAACGGG |
Sigma-Aldrich | N/A |
|
Aicda gRNA1 (mouse Aicda 5′UTR) CCTAAGA CTTTGAGGGAGTCAA |
IDT | N/A |
|
Aicda gRNA1 (mouse Aicda 5′UTR/exon1) GTCAC GCTGGAGACCGATATGG |
IDT | N/A |
| See Table S4 for primer sequences | Sigma-Aldrich | N/A |
| Recombinant DNA | ||
| Plasmid: pLKO.1-puro | Sigma-Aldrich | SHC001 |
| Plasmid: pLKO.1-shCtrl | Sigma-Aldrich | SHC002 |
| Plasmid: pLKO.1-shDDX1 | This paper | N/A |
| Plasmid: psPAX2 | Addgene | #12260 |
| Plasmid: pMD2.G | Addgene | #12259 |
| Plasmid: pSpCas9(BB)-2A-Puro (PX459) | Addgene | #62988 |
| Plasmid: hCas9_D10A | Addgene | #41816 |
| Plasmid: pcDNA3.1 | ThermoFischer | V790-20 |
| Software and Algorithms | ||
| BWA | Li and Durbin, 2009 | |
| Cutadapt 1.8.3 | Martin, 2011 | |
| Bedtools | Quinlan and Hall, 2010 | |
| UCSC bedGraphToBigWig tool | Kent et al., 2002 | |
| Cufflinks 2.2.0 | Trapnell et al., 2012 | |
Contact for Reagent and Resource Sharing
Further information and requests for resources and reagents should be directed to the Lead Contact, Nicholas J. Proudfoot (nicholas.proudfoot@path.ox.ac.uk).
Experimental Model and Subject Details
Cell lines
CH12 cells (Nakamura et al., 1996) were grown in RPMI-1640 culture medium containing 10% heat-inactivated fetal bovine serum (FBS, GIBCO), 100 U/mL of penicillin, 0.1 mg/mL of streptomycin (GIBCO), 5% NCTC-109 medium (Sigma-Aldrich), and 10 mM β-mercaptoethanol at 37°C in a 5% CO2 atmosphere. For CH12-AIDFLAG-HA (Jeevan-Raj et al., 2011) and shRNA-expressing CH12 cell lines the medium was further supplemented with puromycin (2 μg/mL; Sigma-Aldrich).
Mice
Mice with the conditional C57BL/6N-Ddx1tm1a(EUCOMM)Hmgu/Cnrm allele (obtained from Infrafrontier, European Mouse Mutant Archive (EMMA)) were crossed with FLPeR mice (obtained from the Jackson Laboratory) to generate the DDX1loxP allele. Both DDX1loxP/loxP and Aicda-Cre (Kwon et al., 2008) mice were maintained on the C57BL/6J genetic background and genotyping was performed by PCR (see Table S4 for primer sequences). The WT DDX1 allele was identified as a 777-bp and the DDX1loxP allele as a 919-bp PCR fragment. Mice were kept at specified pathogen free conditions and littermates of the same sex were randomly assigned to experimental groups. All animal experiments were performed in accordance with Home Office (UK) regulations and approved by the University of Oxford Local Ethical Committee.
Primary B cell cultures
Naive B cells were isolated from spleens of 8-10 week old mice by magnetic depletion using the B cell isolation kit (Miltenyi Biotech). For DDX1 deletion, purified B cells (> 95% CD19+ cells) were washed 3x with Opti-MEM (ThermoFischer) and cultured at 10 × 106 cells/ml in Opti-MEM with 200 U TAT-Cre recombinase for 45 min at 37°C. Subsequently, TAT-Cre was inactivated by adding FBS at a final concentration of 10%, cells were washed once with RPMI-1640 culture medium and then cultured at 37°C in a 5% CO2 atmosphere. Cells were harvested 1 day after TAT-Cre addition for analysis of deleted DDX1 alleles on genomic DNA, identified as a 380-bp PCR fragment (see Table S4 for primer sequences). DDX1 protein depletion was analyzed 4 days after TAT-Cre treatment on total protein extracts by western blot.
Method Details
Immunization
Mice (6-9 week old) were immunized subcutaneously in the flank with 100 μg endotoxin-depleted ovalbumin (EndoFit, Invivogen) formulated in Complete Freund’s adjuvant (Sigma-Aldrich) as prime, and 4 weeks later as booster in Incomplete Freund’s adjuvant (Sigma-Aldrich). Blood was taken every two weeks and sera separated and frozen at −80°C. Mice were euthanized at week 2 or week 10 post-immunization and spleens were harvested for further analyses.
ELISA and Multiplex Immunoassay
Serum Ig concentrations in naive (8-12 week old) and immunized mice were measured using a Procarta Multiplex Immunoassay (ThermoFischer) according to manufacturer’s instructions. Ovalbumin-specific IgG and IgM responses in immunized mice were measured by ELISA in SpectraPlate-96 HB plates (PerkinElmer). Ovalbumin-specific IgG levels were determined using 10 μg/mL ovalbumin (grade V, Sigma-Aldrich) in 0.1M NaHCO3 buffer pH 8.5 to coat plates at 4°C overnight. After blocking with 1% BSA in PBS, serum serial dilutions were incubated at room temperature for 2 hr. HRP-labeled anti-mouse IgG (Bethyl) antibody was used for detection. For ovalbumin-specific IgM detection, serum serial dilutions were incubated on plates coated with 1 μg/mL anti-mouse IgM capture antibody (BD Biosciences) in PBS. Subsequently, 10 μg/mL biotinylated ovalbumin was added and incubated at 4°C overnight followed by HRP-labeled anti-mouse IgM antibody detection. HRP activity was developed following addition of 1-Step Ultra TMB-ELISA Substrate Solution (ThermoFischer) according to manufacturer’s instructions. Endpoint titers were calculated as a measurement of relative concentration using a cutoff of 2x the mean of a negative control reading (naive serum).
In vitro antigen recall responses in splenocytes
Splenocytes were plated at 0.5 × 10⁶ cells/200 μL in RPMI-1640 culture medium in the presence of 50 μg/mL ovalbumin (EndoFit, Invivogen). After 3 days, IFNγ concentration in the culture supernatant was calculated using ELISA (ThermoFischer) according to manufacturer’s instructions.
CSR induction and chemical treatments
Primary B cells were activated at a density of 0.8 × 10⁶ cells/mL in the presence of 25 μg/ml lipopolysaccharide from Escherichia coli O55:B5 (LPS, Sigma-Aldrich) or LPS plus 10 ng/mL recombinant murine IL-4 (Peprotech) for 3-4 days, to induce proliferation and CSR to IgG3 and IgG1, respectively. To induce CSR to IgA, CH12 cells were cultured at a density of 0.02 × 10⁶ cells/mL in the presence of 1 μg/mL purified anti-mouse/rat CD40 (HM40-3, eBioscience), 10 ng/mL recombinant murine IL-4 (Peprotech) and 2 ng/mL recombinant human TGF-β1 (R&D Systems) (CIT) for 3 days. Cells were cultured at a density of 0.1 × 10⁶ cells per mL for analysis at 24 hr or 4 hr after CIT stimulation and treated at a final concentration of 10 μM pyridostatin (PDS, Sigma-Aldrich), 10-40 μM carboxypyridostatin (cPDS, (Di Antonio et al., 2012)), 1 μM pladienolide B (PlaB, Santa Cruz) (Kotake et al., 2007), 5 μg/mL actinomycin D (ActD, Sigma-Aldrich) or 150 μM 5,6-dichloro-1-β-D-ribofuranosylbenzimidazole (DRB, Sigma-Aldrich) for 4 hr using DMSO as vehicle.
Flow Cytometry analyses
CSR was evaluated by cell surface staining with purified anti-mouse CD16/CD32 (BD Biosciences), FITC-conjugated anti-mouse IgM (eBiosciences), biotin-conjugated anti-mouse IgA (eBiosciences), biotin-conjugated anti-mouse IgG3 (BD Biosciences), biotin-conjugated anti-mouse IgG1 (BD Biosciences), PE-conjugated anti-mouse CD19 (eBiosciences) and APC-conjugated Streptavidin (eBiosciences) in FACS buffer (PBS, 0.5% BSA and 2mM EDTA). Splenic cell suspensions were stained after red-blood cell lysis using purified anti-mouse CD16/CD32 (BD Biosciences), Alexa Fluor 488-conjugated anti-human/mouse GL-7 (eBiosciences), PE-conjugated anti-mouse CD95 (BD Biosciences), PCP-Cy5.5-conjugated anti-mouse CD19 (eBiosciences), biotin-conjugated peanut agglutinin (PNA) and APC-conjugated Streptavidin (eBiosciences) in FACS buffer. Dead cell exclusion was carried out by staining with 7-AAD or DAPI. For intracellular detection of μ heavy-chains, cells were stained on the cell surface with purified anti-mouse CD16/CD32 (BD Biosciences), PCP-Cy5.5-conjugated anti-mouse CD19 (eBiosciences), APC-conjugated anti-mouse B220 (eBiosciences) and PE-conjugated anti-mouse CD138 (Biolegend) and subsequently washed in PBS and fixed in PBS, 2% PFA. After permeabilization in 0.5% Saponin in FACS buffer, cells were stained with Alexa Fluor 488-conjugated anti-mouse μ heavy-chain (ThermoFischer). Samples were acquired on a FACSCalibur or LSRFortessa X-20 flow cytometer (BD Biosciences) and analyzed with FlowJo software (Tree Star).
Cell proliferation and cell cycle analyses
For analysis of cell proliferation, 10x106 cells were stained with 2.5 μM carboxyfluorescein succinimidyl ester (CFSE, Biolegend) in 2 mL staining buffer (0.1% BSA in PBS at 37°C) for 10 min at room temperature. The reaction was stopped by adding cells to 40 mL ice-cold RPMI-1640 culture medium. Cells were washed twice and cultured for 3 days before FACS analysis. Cell cycle profiles were obtained by adding 10 μM of 5-bromo-2′-deoxyuridine (BrdU, Sigma-Aldrich) to 0.5-1x10⁶ CH12 cells 1 hr before harvesting. Cells were washed in PBS, fixed in ice-cold 70% ethanol and kept overnight at 4°C. For BrdU staining, cells were incubated in 2N HCl, 0.5% Triton X-100 for 30 min at room temperature followed by a 2 min incubation in 0.1 M sodium tetraborate buffer, pH 8.0. Cells were washed in PBS, 1% BSA and incubated with 2 μL FITC-conjugated anti-BrdU antibody (BioLegend) diluted in PBS, 1% BSA and 0.5% Tween-20 for 1 hr at room temperature. Cells were washed once and stained with 0.02 mg/mL propidium iodide (PI) in PBS, 0.1% Triton X-100, 0.2 mg/mL RNase A for 30 min at room temperature before FACS analysis.
Lentiviral transduction of shRNA constructs and siRNA transfection
Stable expression of control shRNA (shCtrl, SHC002 Sigma-Aldrich) or DDX1-specific shRNA was obtained by lentiviral transduction of CH12 cells using the pLKO.1-puro system (SHC001 Sigma-Aldrich). Viral supernatants were produced in 293T cells (10 cm plates in DMEM supplemented with 10% heat-inactivated FBS) transfected with 9 μg psPAX2 packaging vector (Addgene), 3 μg pMD2.G envelope vector (Addgene) and 12 μg pLKO.1-puro shRNA vector using Lipofectamine 2000 according to manufacturer’s instructions (ThermoFischer). Medium was replaced to complete RPMI-1640 24 hr after transfection to begin viral production. Viral supernatant was collected 48-72 hr after transfection and mixed with polybrene (8 μg/mL; Sigma-Aldrich). CH12 cells were resuspended in viral supernatants at a density of 0.2 × 10⁶ cells per mL and selected in puromycin (2 μg/mL; Sigma-Aldrich) 24 hr after infection for up to 7 days. Individual clones were isolated by serial dilution assays in the presence of puromycin and grown as independent shCtrl and shDDX1 CH12 cell lines. For transient depletion of DDX1, 30 pmol of short-interfering (siRNA) was electroporated into 3x10⁶ CH12 cells using Amaxa Cell Line Nucleofector Kit R (Lonza). A pool of 4 siRNAs was used to target mouse DDX1 (SMARTpool: siGENOME DDX1 siRNA, Dharmacon) as well as a control siRNA against Luciferase (Anti-Luc siRNA-1, Dharmacon).
CRISPR/Cas9-mediated targeted deletion
Guide RNA sequences were designed using an online tool (http://tools.genome-engineering.org). A single guide RNA oligonucleotide targeting mouse DDX1 exon 5 was cloned into pSpCas9(BB)-2A-Puro (PX459) (Addgene). Gene blocks containing Aicda guide RNA sequences were cloned using TOPO PCR cloning kit (ThermoFischer) and used in combination with hCas9_D10A mutant plasmid (Addgene). Guide RNA/Cas9 expression vectors were electroporated into CH12 cells using Amaxa Cell Line Nucleofector Kit R (Lonza) and cells were cloned using serial dilution assays 72 hr after transfection. Individual clones were screened for homozygous deletion using PCR and the genomic sequence of candidate alleles obtained by Sanger sequencing. Gene deletion was confirmed at the protein level by immunoblot.
Expression of DDX1 dominant-negative mutant
Human DDX1 cDNA was amplified from HEK cells (see Table S4 for primer sequences) and cloned in frame with an N-terminal eGFP tag in the pcDNA3.1 vector (ThermoFischer). A mutant version of DDX1 where a conserved lysine residue in the Walker A motif I was mutated to alanine (K52A) was generated with QuikChange Site-Directed Mutagenesis kit (Agilent Technologies). CH12 cells were electroporated using Amaxa Cell Line Nucleofector Kit R (Lonza) and cultured at a density of 0.2 or 0.08 × 10⁶ cells per mL for analyses after 24 or 40 hr, respectively. GFP positive cells were FACS sorted using a MoFlo Astrios EQ (Beckman Coulter) before Immunoblot or DIP analyses.
Protein extracts and western blot analysis
Whole-cell extracts were prepared in RIPA lysis buffer (50 mM Tris-HCl, pH 7.5, 150 mM NaCl, 1% NP-40, 0.5% Na-deoxycholate, 0.1% SDS, 10% glycerol) supplemented with a cocktail of protease and phosphatase inhibitors (Pierce). Cells were resuspended in 250 μL lysis buffer (5x10⁶ cells), incubated for 30 min on ice and centrifuged (17,000 g at 4°C for 10 min). For nuclear protein extracts, 10x106 cells were resuspended in 500 μL cell lysis buffer (50 mM Tris-HCl, pH 8, 300 mM Sucrose, 4 mM MgAc, 12.5 mM KCl, 1 mM DTT, 10 mM β-mercaptoethanol, 0.3% NP-40 and 1mM PMSF) and incubated 5 min on ice followed by centrifugation (500 g for 10 min at 4°C). The nuclear pellet was resuspended in 250 μL buffer B (50 mM Tris-HCl pH 7.5, 25 mM KCl, 5 mM MgCl2 and 1 mM PMSF), overlaid in 250 μL buffer B containing 200 mM sucrose and centrifuged again to avoid cytoplasm carry over. High-salt extraction of nuclear proteins was carried out on ice for 30 min in 150 μL buffer C (20 mM HEPES pH 7.9, 400 mM NaCl, 1 mM EDTA, 1 mM EGTA, 2 mM DTT and 1 mM PMSF) followed by centrifugation (17,000 g at 4°C for 10 min). Protein concentration was measured using Bio-Rad Protein Assay. Typically, 10 μg of whole-cell and 20 μg of nuclear protein extracts were used for immunoblot with anti-DDX1 (NovusBiologicals or ProteinTech), anti-AID (Cell Signaling L7E7), anti-Tubulin (Sigma-Aldrich), anti-Actin (Sigma-Aldrich), anti-CTCF (Millipore) or anti-Histone H3 (Abcam) and HRP-conjugated secondary antibodies in TBST, 5% milk (Sigma-Aldrich). For immunoblot analysis of RNA pull-down or co-Immunoprecipitation assays the following antibodies were additionally used: anti-FLAG (ThermoScientific), anti-FLAG-HRP (Sigma) and anti- HSPC117/FAAP (RTCB) (Santa Cruz). Relative quantification of protein bands was done using ImageJ.
Nuclear RNA fractionation
Nuclear RNA fractionation was performed as previously described (Dye et al., 2006). Briefly, 2.5x10⁶ cells were resuspended in 500 μL of ice-cold RLB buffer (10 mM Tris-HCl, pH 7.5, 140 mM NaCl, 0.5% NP-40, 1.5 mM MgCl2) and lysed by adding an equal volume of RLB buffer with 24% (m/v) sucrose. Nuclei were isolated by centrifugation (900 g at 4°C for 10 min) and resuspended in 120 μL of NUN1 buffer (20 mM Tri-HCl, pH 7.9, 75mM NaCl, 0.5 mM EDTA, 50% Glycerol, 0.125 mM PMSF, 1mM DTT), followed by the addition of 1.2 mL NUN2 buffer (20 mM HEPES-NaOH pH 7.6, 7.5mM MgCl2, 0.2 mM EDTA, 300 mM NaCl, 1 M urea, 1% NP-40, 1 mM DTT). Nuclei were incubated on ice for 15 min and mixed by vortexing for 5 s every 5 min. Nucleoplasm and chromatin fractions were separated by centrifugation (14,000 g at 4°C for 10 min). The nucleoplasm fraction RNA was extracted with phenol-chloroform pH 4.3 and ethanol precipitated. The precipitate was resuspended in 200 μL of TURBO DNase buffer plus 4 U TURBO DNase (Ambion), incubated for 30 min at 37°C, then extracted with phenol-chloroform pH 4.3 and ethanol precipitated. Chromatin pellets were resuspended in 200 μL high salt buffer (10 mM Tris-HCl, pH 7.5, 500 mM NaCl, 10 mM MgCl2) and treated with 4U TURBO Dnase for 20 min at 37°C, followed by 200 μL Proteinase K/SDS mix (16 U Proteinase K (Roche), 2% SDS) for 20 min at 37°C. The chromatin-associated (chRNA) RNA was extracted with phenol-chloroform pH 4.3 and ethanol precipitated. The precipitate was twice resuspended in 200 μL of 1x TURBO DNase buffer plus 4 U TURBO Dnase, incubated for 30 min at 37°C, then extracted with phenol-chloroform pH 4.3 and ethanol precipitated. RNA was resuspended in 50 μL nuclease-free water (Ambion).
Quantitative PCR and High-throughput Sequencing Library preparation
Total RNA, extracted using TRIzol (ThermoFischer), or nuclear RNA fractions (1 μg) were used for cDNA synthesis with random hexamers and Superscript III Reverse Transcriptase according to manufacturer’s instructions (ThermoFischer). cDNA was diluted 10x in nuclease-free water (Ambion) before it was used for quantitative PCR analysis in a Rotor-Gene Q real-time PCR cycler (QIAGEN), using SYBR Green Master Mix (QIAGEN) and gene-specific primers (Table S4). Minus Superscript III Reverse Transcriptase reactions were used as a control for contaminating DNA and relative gene expression levels were calculated using the ΔCt method. Before high-throughput sequencing library preparation, 2.5 μg chRNA was depleted for rRNA using the Ribo-Zero rRNA Removal kit according to manufacturer’s instructions (Illumina). Libraries were prepared from 100 ng RNA using the NEBNext Ultra Directional RNA Library Prep kit and NEBnext Multiplex Oligos (Index Primers Set 2) for Illumina according to manufacturer’s instructions (NEB). High-throughput sequencing was performed on a HiSeq 4000 sequencer (Illumina) with 75 bp paired-end reads.
DNA immunoprecipitation (DIP) analysis to measure R-loop levels
DIP was performed as previously described (Skourti-Stathaki et al., 2011). Without prior cross-linking, 2.5-3x10⁶ cells were washed twice in PBS and lysed in 500 μL cell lysis buffer (5 mM PIPES pH 8.0, 85 mM KCl, 0.5% NP-40, 0.5 mM PMSF and complete protease inhibitor cocktail (Roche)) for 10 min on ice. Nuclei were isolated by centrifugation (900 g at 4°C for 5 min), resuspended in 400 μL ice-cold nuclear lysis buffer (50 mM Tris-HCl pH 8.0, 1% SDS, 10 mM EDTA, complete protease inhibitor cocktail) and incubated with 6 U of proteinase K (Roche) at 55°C for 3 hr. Genomic DNA was isolated, followed by sonication to 100-500 bp fragments in IP dilution buffer (16.7 mM Tris-HCl pH 8.0, 0.01% SDS, 1.1% Triton X-100, 1.2 mM EDTA, 167 mM NaCl, 0.5 mM PMSF, complete protease inhibitor cocktail) using a Bioruptor (Diagenode). DIP was carried out using the S9.6 antibody (Boguslawski et al., 1986) overnight at 4°C followed by 2 hr with Protein A Dynabeads (ThermoFischer). Immunoprecipitated (IP), no antibody control (-) and input DNA samples were used as templates for quantitative PCR analysis in a Rotor-Gene Q real-time PCR cycler (QIAGEN), using SYBR Green Master Mix (QIAGEN) and primers spanning the entire mouse IgH μ and α regions (Table S4). DIP signals were validated by sensitivity to 10 U of Rnase H (Roche) treatment for 2 hr at 37°C prior to the immunoprecipitation step.
Chromatin immunoprecipitation (ChIP) analysis
ChIP was performed using similar procedures to DIP with some modifications. Briefly, 2.5-3x10⁶ cells were cross-linked with 1% formaldehyde for 10 min at 37°C, quenched with 0.125 M Glycine and washed twice in PBS before resuspension in nuclear lysis buffer containing 0.5% SDS. Chromatin sonicated to 100-500 bp fragments was diluted in IP dilution buffer and pre-cleared with Protein G Dynabeads (ThermoFischer) for 1 hr at 4°C. Pre-cleared supernatants were immunoprecipitated with anti-AID antibody (Chaudhuri et al., 2003) or rabbit IgG overnight at 4°C, followed by 2 hr with Protein G Dynabeads. Immunoprecipitated (IP), IgG control and input DNA samples were used as templates for quantitative PCR analysis in a Rotor-Gene Q real-time PCR cycler (QIAGEN), using SYBR Green Master Mix (QIAGEN) and primers spanning the entire mouse IgH μ and α regions (Table S4).
RNA pull-down assay
RNA folding and pull-down assays were performed as previously described (Zheng et al., 2015). Synthetic 5′-biotinylated Sμ4G and Sμ4Gmut RNA oligonucleotides (Integrated DNA technologies) were diluted to 5 μM in folding buffer (20 mM Tris-HCl pH 7.6, 1 mM EDTA and 100 mM KCl or 100 mM LiCl), heated at 95°C for 5 min and then allowed to cool at room temperature. To confirm the presence of G4 RNA, circular dichroism (CD) spectra were obtained in a Chirascan CD Spectrometer (Applied Photophysics Limited) at 25°C, with wavelength scan range of 220-320 nm and path length of 1 mm. Spectra were subtracted for buffer controls and smoothing was performed using Prism software. Alternatively, 10 pmoles of Sμ4G-KCl, Sμ4G-LiCl, Sμ4Gmut-LiCl or Sμ4Gmut-KCl were resolved in a 6% TBE agarose gel, transferred to a positively charged nylon membrane (Hybond N+) in 0.5x TBE at 30V for 1 hr. After UV-crosslinking, biotinylated RNA on the membrane was detected with HRP-conjugated Streptavidin (ThermoScientific) in TBST, 5% BSA. For RNA pull-down, whole cell extracts where prepared from CH12 cells cultured at a density of 0.06 × 10⁶ cells per mL in CIT stimulated conditions for 48 hr. RIPA lysis buffer without glycerol and with 2 mM EDTA was used. Extracts were pre-cleared at 4°C for 1 hr with Streptavidin MagneSphere Paramagnetic beads (Promega). Pre-cleared lysate (the equivalent to 1x10⁶ cells) was diluted with an equal volume of 2x Binding buffer (50 mM Tris-Acetate pH 7.8,10 mM NaCl, 3mM MgCl2, 70 mM glycine, 10% glycerol containing 100 mM KCl or 100 mM LiCl) and incubated with biotinylated oligonucleotides (200 pmol) for 1 hr at room temperature. Streptavidin MagneSphere Paramagnetic beads (Promega) were then added and incubated for an additional 1 hr. Beads were washed thrice with RIPA and once with PBS before bound proteins were recovered in 2x SDS loading buffer (5 min at 65°C plus boiling at 95°C) and analyzed by immunoblot. Bound RNAs were recovered by incubating beads in Trizol (ThermoFischer) and analyzed by dot blot using HRP-conjugated Streptavidin.
Electromobility Shift Assay (EMSA)
Synthetic oligonucleotides (12.5 pmols, Integrated DNA Technologies; (Creacy et al., 2008, Dickerson et al., 2003, Zheng et al., 2015)) were 5′ end labeled by phosphorylation with [γ-32P]ATP and T4 polynucleotide kinase (PNK, NEB) for 1 h at 37 °C. Radiolabeled RNA was purified in a MicroSpin G-25 column (GE Healthcare) and precipitated in 0.3M sodium acetate, pH 5.2 and three volumes of ethanol. After centrifugation and a washing step with 70% ethanol the labeled oligos were resuspended in 200 μL of nuclease-free water (Ambion) and RNA was quantified by scintillation counting. Binding reactions were performed at 25°C for 10 min by mixing 1, 2 or 4 μg recombinant human DDX1 protein (amino acids 1-728 (Kellner et al., 2015); diluted to 0.25, 0.5 or 1 μg/μL in 10 mM HEPES-NaOH pH 7.9, 250 mM KCl, 5 mM MgCl2, 3 mM DTT) with 1 μL labeled oligo in a 20 μL final volume. Reactions were performed in binding buffer (10.4 mM HEPES-NaOH pH 7.9, 2 mM MgCl2, 1.6 mM MgAc, 1 mM DTT, 7.6% glycerol, 1.5 mM ATP and 2 mM GTP) and resolved on a native 4% polyacrylamide gel (19:1) at 25 mAmp for 3h in 1 × running buffer (75 mM Tris-HCL, 75 mM glycine pH 7.5-7.7) buffer at 4 °C. The gel was then dried on 3 MM Whatman filter paper and exposed with autoradiographic XAR film (Kodak).
In vitro RNA:DNA hybrid assay
Tetramolecular G4 RNA forming oligonucleotides (Creacy et al., 2008) (Dharmacon) were annealed in 10 mM Tris-HCl pH 8, 50 mM KCl buffer at a concentration of 100 μM, after heating at 99°C for 20 min and slowly cooling to 4°C over several hours. 5′ end labeling of G4 RNA followed by MicroSpin G-25 column purification was performed as described before. G4 RNA was further purified by electrophoresis on a native 12% polyacrylamide gel, band excision and elution in 0.5 M NaOAc, 1 mM EDTA and 0.1% SDS buffer for 3 hr at 4°C. After ethanol precipitation, G4 RNA was resuspended in nuclease-free water and quantified by scintillation counting. In vitro formation of RNA:DNA hybrids was determined by mixing 1 μg recombinant human DDX1 protein (amino acids 1-728, (Kellner et al., 2015); diluted to 1 μg/μL in 10 mM HEPES-NaOH pH 7.9, 250 mM KCl, 5 mM MgCl2, 3 mM DTT) with approximately 2.5 fmol labeled G4 RNA and an equivalent amount of complementary DNA strands (Sigma-Aldrich) in a 20 μL final volume. The reaction was performed in binding buffer containing 5 mM MgCl2 and 5 mM ATP at 25°C for 10, 20 or 30 min. The presence of RNA:DNA hybrids was confirmed by treatment with 0.5 U RNaseH (Roche) for 20 min at 37°C in a final concentration of 10 mM MgCl2 and 50 mM NaCl. Nucleic acids were resolved on a native 12% polyacrylamide gel (19:1) at 100 V for 1 h 15 min in 1 × TBE buffer at 4 °C. The gel was exposed with a phosphor screen (Fujifilm) at −80 °C.
Immunofluorescence assay
Approximately 2x10⁶ cells were fixed with PBS, 4% PFA and permeabilized with PBS, 0.25% Triton X-100. Before staining, cells were incubated in block buffer (PBS, 3% BSA) for 30 min at room temperature. Primary antibody anti-AID (Cell Signaling, clone 30F12) was added at 1:100 for 2 h at 4°C. Cells were washed 3x in wash buffer (PBS, 0.05% Tween20) by centrifugation (700 g at 4°C for 5 min). Secondary antibody Alexa Fluor 488-conjugated anti-rabbit IgG (ThermoFischer) was added at 1:500 for 1 hr at room temperature. Cells were washed 3x in wash buffer (PBS, 0.05% Tween20) and 2x in PBS by centrifugation (700 g at 4°C for 5 min). Cell slides were prepared by cytospin and mounted with Vectashield mounting media with DAPI (Vector Laboratories). Z stack images were collected with a FluoView1000 confocal microscope (Olympus) using a UPLSAPO 60.0X / 1.35 oil objective. Images were analyzed using ImageJ and prepared using OMERO software.
Co-Immunoprecipitation
Cells were resuspended in 1x packed cell volume (PCV) of buffer A (10 mM HEPES, pH 7.9, 1.5 mM MgCl2, 10 mM KCl) and incubated 15 min on ice, followed by cell disruption using a 25G needle. After centrifugation (900 g at 4°C for 10 min) the nuclear pellet was resuspended in 1x PCV buffer C (20 mM HEPES, pH 7.9, 1.5 mM MgCl2, 420 mM NaCl, 25% glycerol), vortexed 10x and incubated 30 min at 4°C on a rotating wheel. Subsequently, nuclear lysates were diluted 3x in 50 mM HEPES pH 7.9, 0.1% Triton X-100 and 1 μL Benzonase (Sigma) was added per each 100 μL lysate. Benzonase digestion was carried out at 37°C for 30 min followed by centrifugation (17,000 g at 4°C for 10 min). Protein concentration was measured using Bio-Rad Protein Assay and 200 μg of nuclear lysate was used per immunoprecipitation in a final volume of 500 μL IP buffer (50 mM HEPES pH 7.9, 0.1% Triton X-100, 150 mM NaCl) with 1.5 μg anti-DDX1 (ProteinTech) or rabbit IgG (Sigma). Immunoprecipitation reactions were incubated at 4°C overnight on a rotating wheel, followed by 2 hr with M280 anti-rabbit IgG Dynabeads (ThermoFischer). Beads were washed 3x with IP buffer and protein complexes were eluted in 15 μL 0.2 M Glycine pH 2.6 (10 min at room temperature). Eluates were neutralized with 5 μL 1M Tris-HCl pH 8 and analyzed by immunoblot.
Sμ mutations and microhomology analysis at Sμ-Sα junctions
Genomic DNA was isolated and recombined Sμ-Sα sequences were amplified by PCR (35 cycles of 98°C 10 s, 68°C 2 min 30 s) using high fidelity PrimeSTAR HS DNA Polymerase (Tanaka) (see Table S4 for primer sequences). PCR products spanning 1–2 kb were gel-extracted with QiaexII gel extraction kit (QIAGEN) and cloned using StrataClone Blunt PCR cloning kit (Agilent). DNA from individual clones was sequenced with T7 and T3 primers and NCBI blast was used for sequence alignment with germline switch sequences (obtained from Genome Reference Consortium Mouse Build 38). Sμ sequences were analyzed for mutation frequency as the number of individual mutations at each nucleotide out of the total number of nucleotides analyzed per experiment. The length of microhomology (MH) at Sμ–Sα junctions was measured as the number of consecutive nucleotides with perfect homology. Insertions were defined as nucleotides at the breakpoints with no homology to either of the S-regions. Only Sμ–Sα sequences with a unique pattern of Sμ mutation were considered for these analyses.
Quantification and Statistical Analysis
ChRNA-seq data processing and bioinformatics analysis
Chromatin-associated RNA (chRNA) sequencing reads were aligned to the mouse genome (mm10), obtained from University of California at Santa Cruz (UCSC) using BWA (Li and Durbin, 2009) with default parameters. Prior to alignment, adaptor sequences were trimmed using Cutadapt 1.8.3 (Martin, 2011), discarding reads with less than 10 bases. An in-house Perl script was used to remove the reads left unpaired. Only uniquely aligned reads with no more than two mismatches were kept for further analysis. Data were scaled to library size (genomeCoverageBed) using Bedtools (Quinlan and Hall, 2010). Bigwig track files were generated from the BWA output files using UCSC bedGraphToBigWig tool (Kent et al., 2002). Gene annotation information was downloaded from the UCSC table browser for Refseq Genes. Cufflinks 2.2.0 (Trapnell et al., 2012) was used for abundance estimation and quantification of transcripts. Differentially expressed genes between shCtrl and shDDX1 in unstimulated (UNS) or anti-CD40, IL-4 and TGF-β (CIT) stimulation conditions were identified using Cuffdiff 2.0.2. We included two biological replicates for each condition analyzed. A heatmap was generated with the R-package gplots using a subset of significantly altered genes (fold-change ≥ 2, False discovery rate (FDR) ≤ 0.05) identified by differential gene expression in either shCtrl/shDDX1 or UNS/CIT comparisons. Expression values for these genes were log transformed and quantile normalized before plotting the heatmap with rows denoting genes and columns denoting sample conditions.
Statistical analysis
Statistical details of experiments are described in the figure legends. Results are expressed as mean values and standard deviation (SD) and n corresponds to the number of independent experiments. Statistical significance was analyzed using a two-tailed Student’s t test and a paired test was used when samples were normalized. A Fisher’s exact test was used for the analyses of microhomology length at Sμ-Sα junctions (Figure S7C). ∗p ≤ 0.05 and ∗∗p ≤ 0.01 were considered significant.
Data Availability
The accession number for the ChRNA-seq data reported in this paper is GEO: GSE95635. Raw image files have been deposited in the Mendeley Data repository (https://data.mendeley.com/datasets/z747pf6sd9/draft?a=c2b73047-5f9c-4ad9-b65a-9894f4fedfb0).
Acknowledgments
We thank T. Honjo for CH12 cells, B. Reina-San-Martin for CH12 AIDFLAG-HA cells, J. Chaudhuri for anti-AID antibody, C. Lowe and S. Balasubramanian for cPDS, and M. Busslinger for Aicda-Cre mice. We thank Chris Tang for advice on animal experiments and Joan Monks, Michael Maj, and Andrew Basset for technical assistance, all at the Sir William Dunn School of Pathology. We thank Jerome Nicod (Wellcome Trust Centre for Human Genetics, Oxford, UK) for high-throughput sequencing, Samuel Cahill (Department of Chemistry, University of Oxford) for circular dichroism analysis, and Julian Kellner (Max Planck Institute for Medical Research) for rDDX1 proteins. This work was supported by a Welcome Trust Investigator Award (107928/Z/15/Z), an ERC Advanced Grant (339170) to N.J.P., and an EMBO Long-Term fellowship (ALTF 1351-2011) to C.R.d.A.
Author Contributions
C.R.d.A. conceived the study, designed and performed most experiments. S.D. performed bioinformatics analyses. A.D. helped with IF and the design of DDX1 biochemical analyses. A.E.M. and Q.S. helped with in vivo immunizations. A.M. provided recombinant DDX1 proteins. C.R.d.A. and N.J.P. discussed results and wrote the manuscript.
Declaration of Interests
The authors declare no competing interests.
Published: May 3, 2018
Footnotes
Supplemental Information includes seven figures and four tables and can be found with this article online at https://doi.org/10.1016/j.molcel.2018.04.001.
Contributor Information
Claudia Ribeiro de Almeida, Email: claudia.ribeirodealmeida@path.ox.ac.uk.
Nicholas J. Proudfoot, Email: nicholas.proudfoot@path.ox.ac.uk.
Supplemental Information
References
- Basu U., Meng F.L., Keim C., Grinstein V., Pefanis E., Eccleston J., Zhang T., Myers D., Wasserman C.R., Wesemann D.R. The RNA exosome targets the AID cytidine deaminase to both strands of transcribed duplex DNA substrates. Cell. 2011;144:353–363. doi: 10.1016/j.cell.2011.01.001. [DOI] [PMC free article] [PubMed] [Google Scholar]
- Bléoo S., Sun X., Hendzel M.J., Rowe J.M., Packer M., Godbout R. Association of human DEAD box protein DDX1 with a cleavage stimulation factor involved in 3′-end processing of pre-MRNA. Mol. Biol. Cell. 2001;12:3046–3059. doi: 10.1091/mbc.12.10.3046. [DOI] [PMC free article] [PubMed] [Google Scholar]
- Boboila C., Alt F.W., Schwer B. Classical and alternative end-joining pathways for repair of lymphocyte-specific and general DNA double-strand breaks. Adv. Immunol. 2012;116:1–49. doi: 10.1016/B978-0-12-394300-2.00001-6. [DOI] [PubMed] [Google Scholar]
- Boguslawski S.J., Smith D.E., Michalak M.A., Mickelson K.E., Yehle C.O., Patterson W.L., Carrico R.J. Characterization of monoclonal antibody to DNA.RNA and its application to immunodetection of hybrids. J. Immunol. Methods. 1986;89:123–130. doi: 10.1016/0022-1759(86)90040-2. [DOI] [PubMed] [Google Scholar]
- Brazão T.F., Johnson J.S., Müller J., Heger A., Ponting C.P., Tybulewicz V.L. Long noncoding RNAs in B-cell development and activation. Blood. 2016;128:e10–e19. doi: 10.1182/blood-2015-11-680843. [DOI] [PMC free article] [PubMed] [Google Scholar]
- Chakraborty P., Grosse F. Human DHX9 helicase preferentially unwinds RNA-containing displacement loops (R-loops) and G-quadruplexes. DNA Repair (Amst.) 2011;10:654–665. doi: 10.1016/j.dnarep.2011.04.013. [DOI] [PubMed] [Google Scholar]
- Chaudhuri J., Tian M., Khuong C., Chua K., Pinaud E., Alt F.W. Transcription-targeted DNA deamination by the AID antibody diversification enzyme. Nature. 2003;422:726–730. doi: 10.1038/nature01574. [DOI] [PubMed] [Google Scholar]
- Chen H.C., Lin W.C., Tsay Y.G., Lee S.C., Chang C.J. An RNA helicase, DDX1, interacting with poly(A) RNA and heterogeneous nuclear ribonucleoprotein K. J. Biol. Chem. 2002;277:40403–40409. doi: 10.1074/jbc.M206981200. [DOI] [PubMed] [Google Scholar]
- Chen M.C., Murat P., Abecassis K., Ferré-D’Amaré A.R., Balasubramanian S. Insights into the mechanism of a G-quadruplex-unwinding DEAH-box helicase. Nucleic Acids Res. 2015;43:2223–2231. doi: 10.1093/nar/gkv051. [DOI] [PMC free article] [PubMed] [Google Scholar]
- Creacy S.D., Routh E.D., Iwamoto F., Nagamine Y., Akman S.A., Vaughn J.P. G4 resolvase 1 binds both DNA and RNA tetramolecular quadruplex with high affinity and is the major source of tetramolecular quadruplex G4-DNA and G4-RNA resolving activity in HeLa cell lysates. J. Biol. Chem. 2008;283:34626–34634. doi: 10.1074/jbc.M806277200. [DOI] [PMC free article] [PubMed] [Google Scholar]
- Daniels G.A., Lieber M.R. RNA:DNA complex formation upon transcription of immunoglobulin switch regions: Implications for the mechanism and regulation of class switch recombination. Nucleic Acids Res. 1995;23:5006–5011. doi: 10.1093/nar/23.24.5006. [DOI] [PMC free article] [PubMed] [Google Scholar]
- Dempsey L.A., Sun H., Hanakahi L.A., Maizels N. G4 DNA binding by LR1 and its subunits, nucleolin and hnRNP D, A role for G-G pairing in immunoglobulin switch recombination. J. Biol. Chem. 1999;274:1066–1071. doi: 10.1074/jbc.274.2.1066. [DOI] [PubMed] [Google Scholar]
- Di Antonio M., Biffi G., Mariani A., Raiber E.A., Rodriguez R., Balasubramanian S. Selective RNA versus DNA G-quadruplex targeting by in situ click chemistry. Angew. Chem. Int. Ed. Engl. 2012;51:11073–11078. doi: 10.1002/anie.201206281. [DOI] [PMC free article] [PubMed] [Google Scholar]
- Dickerson S.K., Market E., Besmer E., Papavasiliou F.N. AID mediates hypermutation by deaminating single stranded DNA. J. Exp. Med. 2003;197:1291–1296. doi: 10.1084/jem.20030481. [DOI] [PMC free article] [PubMed] [Google Scholar]
- Duquette M.L., Handa P., Vincent J.A., Taylor A.F., Maizels N. Intracellular transcription of G-rich DNAs induces formation of G-loops, novel structures containing G4 DNA. Genes Dev. 2004;18:1618–1629. doi: 10.1101/gad.1200804. [DOI] [PMC free article] [PubMed] [Google Scholar]
- Dye M.J., Gromak N., Proudfoot N.J. Exon tethering in transcription by RNA polymerase II. Mol. Cell. 2006;21:849–859. doi: 10.1016/j.molcel.2006.01.032. [DOI] [PubMed] [Google Scholar]
- Guo J.U., Bartel D.P. RNA G-quadruplexes are globally unfolded in eukaryotic cells and depleted in bacteria. Science. 2016;353 doi: 10.1126/science.aaf5371. Published online September 23, 2016. [DOI] [PMC free article] [PubMed] [Google Scholar]
- Han C., Liu Y., Wan G., Choi H.J., Zhao L., Ivan C., He X., Sood A.K., Zhang X., Lu X. The RNA-binding protein DDX1 promotes primary microRNA maturation and inhibits ovarian tumor progression. Cell Rep. 2014;8:1447–1460. doi: 10.1016/j.celrep.2014.07.058. [DOI] [PMC free article] [PubMed] [Google Scholar]
- Hein K., Lorenz M.G., Siebenkotten G., Petry K., Christine R., Radbruch A. Processing of switch transcripts is required for targeting of antibody class switch recombination. J. Exp. Med. 1998;188:2369–2374. doi: 10.1084/jem.188.12.2369. [DOI] [PMC free article] [PubMed] [Google Scholar]
- Hildebrandt M.R., Germain D.R., Monckton E.A., Brun M., Godbout R. Ddx1 knockout results in transgenerational wild-type lethality in mice. Sci. Rep. 2015;5:9829. doi: 10.1038/srep09829. [DOI] [PMC free article] [PubMed] [Google Scholar]
- Hodgkin P.D., Lee J.H., Lyons A.B. B cell differentiation and isotype switching is related to division cycle number. J. Exp. Med. 1996;184:277–281. doi: 10.1084/jem.184.1.277. [DOI] [PMC free article] [PubMed] [Google Scholar]
- Huang F.T., Yu K., Balter B.B., Selsing E., Oruc Z., Khamlichi A.A., Hsieh C.L., Lieber M.R. Sequence dependence of chromosomal R-loops at the immunoglobulin heavy-chain Smu class switch region. Mol. Cell. Biol. 2007;27:5921–5932. doi: 10.1128/MCB.00702-07. [DOI] [PMC free article] [PubMed] [Google Scholar]
- Jeevan-Raj B.P., Robert I., Heyer V., Page A., Wang J.H., Cammas F., Alt F.W., Losson R., Reina-San-Martin B. Epigenetic tethering of AID to the donor switch region during immunoglobulin class switch recombination. J. Exp. Med. 2011;208:1649–1660. doi: 10.1084/jem.20110118. [DOI] [PMC free article] [PubMed] [Google Scholar]
- Jurkin J., Henkel T., Nielsen A.F., Minnich M., Popow J., Kaufmann T., Heindl K., Hoffmann T., Busslinger M., Martinez J. The mammalian tRNA ligase complex mediates splicing of XBP1 mRNA and controls antibody secretion in plasma cells. EMBO J. 2014;33:2922–2936. doi: 10.15252/embj.201490332. [DOI] [PMC free article] [PubMed] [Google Scholar]
- Kanai Y., Dohmae N., Hirokawa N. Kinesin transports RNA: Isolation and characterization of an RNA-transporting granule. Neuron. 2004;43:513–525. doi: 10.1016/j.neuron.2004.07.022. [DOI] [PubMed] [Google Scholar]
- Kao Y.P., Hsieh W.C., Hung S.T., Huang C.W., Lieber M.R., Huang F.T. Detection and characterization of R-loops at the murine immunoglobulin Sα region. Mol. Immunol. 2013;54:208–216. doi: 10.1016/j.molimm.2012.11.009. [DOI] [PubMed] [Google Scholar]
- Kellner J.N., Meinhart A. Structure of the SPRY domain of the human RNA helicase DDX1, a putative interaction platform within a DEAD-box protein. Acta Crystallogr. F Struct. Biol. Commun. 2015;71:1176–1188. doi: 10.1107/S2053230X15013709. [DOI] [PMC free article] [PubMed] [Google Scholar]
- Kellner J.N., Reinstein J., Meinhart A. Synergistic effects of ATP and RNA binding to human DEAD-box protein DDX1. Nucleic Acids Res. 2015;43:2813–2828. doi: 10.1093/nar/gkv106. [DOI] [PMC free article] [PubMed] [Google Scholar]
- Kent W.J., Sugnet C.W., Furey T.S., Roskin K.M., Pringle T.H., Zahler A.M., Haussler D. The human genome browser at UCSC. Genome Res. 2002;12:996–1006. doi: 10.1101/gr.229102. [DOI] [PMC free article] [PubMed] [Google Scholar]
- Kotake Y., Sagane K., Owa T., Mimori-Kiyosue Y., Shimizu H., Uesugi M., Ishihama Y., Iwata M., Mizui Y. Splicing factor SF3b as a target of the antitumor natural product pladienolide. Nat. Chem. Biol. 2007;3:570–575. doi: 10.1038/nchembio.2007.16. [DOI] [PubMed] [Google Scholar]
- Kwon K., Hutter C., Sun Q., Bilic I., Cobaleda C., Malin S., Busslinger M. Instructive role of the transcription factor E2A in early B lymphopoiesis and germinal center B cell development. Immunity. 2008;28:751–762. doi: 10.1016/j.immuni.2008.04.014. [DOI] [PubMed] [Google Scholar]
- Li H., Durbin R. Fast and accurate short read alignment with Burrows-Wheeler transform. Bioinformatics. 2009;25:1754–1760. doi: 10.1093/bioinformatics/btp324. [DOI] [PMC free article] [PubMed] [Google Scholar]
- Li L., Monckton E.A., Godbout R. A role for DEAD box 1 at DNA double-strand breaks. Mol. Cell. Biol. 2008;28:6413–6425. doi: 10.1128/MCB.01053-08. [DOI] [PMC free article] [PubMed] [Google Scholar]
- Li L., Germain D.R., Poon H.Y., Hildebrandt M.R., Monckton E.A., McDonald D., Hendzel M.J., Godbout R. DEAD Box 1 facilitates removal of RNA and homologous recombination at DNA double-strand breaks. Mol. Cell. Biol. 2016;36:2794–2810. doi: 10.1128/MCB.00415-16. [DOI] [PMC free article] [PubMed] [Google Scholar]
- Linder P., Jankowsky E. From unwinding to clamping - the DEAD box RNA helicase family. Nat. Rev. Mol. Cell Biol. 2011;12:505–516. doi: 10.1038/nrm3154. [DOI] [PubMed] [Google Scholar]
- Lorenz M., Jung S., Radbruch A. Switch transcripts in immunoglobulin class switching. Science. 1995;267:1825–1828. doi: 10.1126/science.7892607. [DOI] [PubMed] [Google Scholar]
- Martin M. Cutadapt removes adapter sequences from high-throughput sequencing reads. EMBnetjournal. 2011;17:10–13. [Google Scholar]
- Matthews A.J., Zheng S., DiMenna L.J., Chaudhuri J. Regulation of immunoglobulin class-switch recombination: Choreography of noncoding transcription, targeted DNA deamination, and long-range DNA repair. Adv. Immunol. 2014;122:1–57. doi: 10.1016/B978-0-12-800267-4.00001-8. [DOI] [PMC free article] [PubMed] [Google Scholar]
- McRae E.K.S., Booy E.P., Moya-Torres A., Ezzati P., Stetefeld J., McKenna S.A. Human DDX21 binds and unwinds RNA guanine quadruplexes. Nucleic Acids Res. 2017;45:6656–6668. doi: 10.1093/nar/gkx380. [DOI] [PMC free article] [PubMed] [Google Scholar]
- Meng F.L., Du Z., Federation A., Hu J., Wang Q., Kieffer-Kwon K.R., Meyers R.M., Amor C., Wasserman C.R., Neuberg D. Convergent transcription at intragenic super-enhancers targets AID-initiated genomic instability. Cell. 2014;159:1538–1548. doi: 10.1016/j.cell.2014.11.014. [DOI] [PMC free article] [PubMed] [Google Scholar]
- Müller J.R., Giese T., Henry D.L., Mushinski J.F., Marcu K.B. Generation of switch hybrid DNA between Ig heavy chain-mu and downstream switch regions in B lymphocytes. J. Immunol. 1998;161:1354–1362. [PubMed] [Google Scholar]
- Nakamura M., Kondo S., Sugai M., Nazarea M., Imamura S., Honjo T. High frequency class switching of an IgM+ B lymphoma clone CH12F3 to IgA+ cells. Int. Immunol. 1996;8:193–201. doi: 10.1093/intimm/8.2.193. [DOI] [PubMed] [Google Scholar]
- Nowak U., Matthews A.J., Zheng S., Chaudhuri J. The splicing regulator PTBP2 interacts with the cytidine deaminase AID and promotes binding of AID to switch-region DNA. Nat. Immunol. 2011;12:160–166. doi: 10.1038/ni.1977. [DOI] [PMC free article] [PubMed] [Google Scholar]
- Parsa J.Y., Ramachandran S., Zaheen A., Nepal R.M., Kapelnikov A., Belcheva A., Berru M., Ronai D., Martin A. Negative supercoiling creates single-stranded patches of DNA that are substrates for AID-mediated mutagenesis. PLoS Genet. 2012;8:e1002518. doi: 10.1371/journal.pgen.1002518. [DOI] [PMC free article] [PubMed] [Google Scholar]
- Pause A., Sonenberg N. Mutational analysis of a DEAD box RNA helicase: The mammalian translation initiation factor eIF-4A. EMBO J. 1992;11:2643–2654. doi: 10.1002/j.1460-2075.1992.tb05330.x. [DOI] [PMC free article] [PubMed] [Google Scholar]
- Pavri R., Gazumyan A., Jankovic M., Di Virgilio M., Klein I., Ansarah-Sobrinho C., Resch W., Yamane A., Reina San-Martin B., Barreto V. Activation-induced cytidine deaminase targets DNA at sites of RNA polymerase II stalling by interaction with Spt5. Cell. 2010;143:122–133. doi: 10.1016/j.cell.2010.09.017. [DOI] [PMC free article] [PubMed] [Google Scholar]
- Pefanis E., Wang J., Rothschild G., Lim J., Chao J., Rabadan R., Economides A.N., Basu U. Noncoding RNA transcription targets AID to divergently transcribed loci in B cells. Nature. 2014;514:389–393. doi: 10.1038/nature13580. [DOI] [PMC free article] [PubMed] [Google Scholar]
- Perlot T., Li G., Alt F.W. Antisense transcripts from immunoglobulin heavy-chain locus V(D)J and switch regions. Proc. Natl. Acad. Sci. USA. 2008;105:3843–3848. doi: 10.1073/pnas.0712291105. [DOI] [PMC free article] [PubMed] [Google Scholar]
- Popow J., Jurkin J., Schleiffer A., Martinez J. Analysis of orthologous groups reveals archease and DDX1 as tRNA splicing factors. Nature. 2014;511:104–107. doi: 10.1038/nature13284. [DOI] [PMC free article] [PubMed] [Google Scholar]
- Pucella J.N., Chaudhuri J. AID Invited to the G4 Summit. Mol. Cell. 2017;67:355–357. doi: 10.1016/j.molcel.2017.07.020. [DOI] [PubMed] [Google Scholar]
- Qian J., Wang Q., Dose M., Pruett N., Kieffer-Kwon K.R., Resch W., Liang G., Tang Z., Mathé E., Benner C. B cell super-enhancers and regulatory clusters recruit AID tumorigenic activity. Cell. 2014;159:1524–1537. doi: 10.1016/j.cell.2014.11.013. [DOI] [PMC free article] [PubMed] [Google Scholar]
- Qiao Q., Wang L., Meng F.L., Hwang J.K., Alt F.W., Wu H. AID recognizes structured DNA for class switch recombination. Mol. Cell. 2017;67:361–373. doi: 10.1016/j.molcel.2017.06.034. [DOI] [PMC free article] [PubMed] [Google Scholar]
- Quinlan A.R., Hall I.M. BEDTools: A flexible suite of utilities for comparing genomic features. Bioinformatics. 2010;26:841–842. doi: 10.1093/bioinformatics/btq033. [DOI] [PMC free article] [PubMed] [Google Scholar]
- Ramiro A.R., Stavropoulos P., Jankovic M., Nussenzweig M.C. Transcription enhances AID-mediated cytidine deamination by exposing single-stranded DNA on the nontemplate strand. Nat. Immunol. 2003;4:452–456. doi: 10.1038/ni920. [DOI] [PubMed] [Google Scholar]
- Reaban M.E., Griffin J.A. Induction of RNA-stabilized DNA conformers by transcription of an immunoglobulin switch region. Nature. 1990;348:342–344. doi: 10.1038/348342a0. [DOI] [PubMed] [Google Scholar]
- Rodriguez R., Miller K.M., Forment J.V., Bradshaw C.R., Nikan M., Britton S., Oelschlaegel T., Xhemalce B., Balasubramanian S., Jackson S.P. Small-molecule-induced DNA damage identifies alternative DNA structures in human genes. Nat. Chem. Biol. 2012;8:301–310. doi: 10.1038/nchembio.780. [DOI] [PMC free article] [PubMed] [Google Scholar]
- Rogers G.W., Jr., Lima W.F., Merrick W.C. Further characterization of the helicase activity of eIF4A. Substrate specificity. J. Biol. Chem. 2001;276:12598–12608. doi: 10.1074/jbc.M007560200. [DOI] [PubMed] [Google Scholar]
- Roy D., Lieber M.R. G clustering is important for the initiation of transcription-induced R-loops in vitro, whereas high G density without clustering is sufficient thereafter. Mol. Cell. Biol. 2009;29:3124–3133. doi: 10.1128/MCB.00139-09. [DOI] [PMC free article] [PubMed] [Google Scholar]
- Roy D., Yu K., Lieber M.R. Mechanism of R-loop formation at immunoglobulin class switch sequences. Mol. Cell. Biol. 2008;28:50–60. doi: 10.1128/MCB.01251-07. [DOI] [PMC free article] [PubMed] [Google Scholar]
- Sharbeen G., Yee C.W., Smith A.L., Jolly C.J. Ectopic restriction of DNA repair reveals that UNG2 excises AID-induced uracils predominantly or exclusively during G1 phase. J. Exp. Med. 2012;209:965–974. doi: 10.1084/jem.20112379. [DOI] [PMC free article] [PubMed] [Google Scholar]
- Shinkura R., Tian M., Smith M., Chua K., Fujiwara Y., Alt F.W. The influence of transcriptional orientation on endogenous switch region function. Nat. Immunol. 2003;4:435–441. doi: 10.1038/ni918. [DOI] [PubMed] [Google Scholar]
- Skourti-Stathaki K., Proudfoot N.J., Gromak N. Human senataxin resolves RNA/DNA hybrids formed at transcriptional pause sites to promote Xrn2-dependent termination. Mol. Cell. 2011;42:794–805. doi: 10.1016/j.molcel.2011.04.026. [DOI] [PMC free article] [PubMed] [Google Scholar]
- Stavnezer J., Radcliffe G., Lin Y.C., Nietupski J., Berggren L., Sitia R., Severinson E. Immunoglobulin heavy-chain switching may be directed by prior induction of transcripts from constant-region genes. Proc. Natl. Acad. Sci. USA. 1988;85:7704–7708. doi: 10.1073/pnas.85.20.7704. [DOI] [PMC free article] [PubMed] [Google Scholar]
- Trapnell C., Roberts A., Goff L., Pertea G., Kim D., Kelley D.R., Pimentel H., Salzberg S.L., Rinn J.L., Pachter L. Differential gene and transcript expression analysis of RNA-seq experiments with TopHat and Cufflinks. Nat. Protoc. 2012;7:562–578. doi: 10.1038/nprot.2012.016. [DOI] [PMC free article] [PubMed] [Google Scholar]
- Wang Q., Oliveira T., Jankovic M., Silva I.T., Hakim O., Yao K., Gazumyan A., Mayer C.T., Pavri R., Casellas R. Epigenetic targeting of activation-induced cytidine deaminase. Proc. Natl. Acad. Sci. USA. 2014;111:18667–18672. doi: 10.1073/pnas.1420575111. [DOI] [PMC free article] [PubMed] [Google Scholar]
- Wiedemann E.M., Peycheva M., Pavri R. DNA replication origins in immunoglobulin switch regions regulate class switch recombination in an R-loop-dependent manner. Cell Rep. 2016;17:2927–2942. doi: 10.1016/j.celrep.2016.11.041. [DOI] [PubMed] [Google Scholar]
- Willmann K.L., Milosevic S., Pauklin S., Schmitz K.M., Rangam G., Simon M.T., Maslen S., Skehel M., Robert I., Heyer V. A role for the RNA pol II-associated PAF complex in AID-induced immune diversification. J. Exp. Med. 2012;209:2099–2111. doi: 10.1084/jem.20112145. [DOI] [PMC free article] [PubMed] [Google Scholar]
- Yasuda-Inoue M., Kuroki M., Ariumi Y. Distinct DDX DEAD-box RNA helicases cooperate to modulate the HIV-1 Rev function. Biochem. Biophys. Res. Commun. 2013;434:803–808. doi: 10.1016/j.bbrc.2013.04.016. [DOI] [PMC free article] [PubMed] [Google Scholar]
- Yu K., Chedin F., Hsieh C.L., Wilson T.E., Lieber M.R. R-loops at immunoglobulin class switch regions in the chromosomes of stimulated B cells. Nat. Immunol. 2003;4:442–451. doi: 10.1038/ni919. [DOI] [PubMed] [Google Scholar]
- Zhang Z., Kim T., Bao M., Facchinetti V., Jung S.Y., Ghaffari A.A., Qin J., Cheng G., Liu Y.J. DDX1, DDX21, and DHX36 helicases form a complex with the adaptor molecule TRIF to sense dsRNA in dendritic cells. Immunity. 2011;34:866–878. doi: 10.1016/j.immuni.2011.03.027. [DOI] [PMC free article] [PubMed] [Google Scholar]
- Zhang Z.Z., Pannunzio N.R., Han L., Hsieh C.L., Yu K., Lieber M.R. The strength of an Ig switch region is determined by its ability to drive R loop formation and its number of WGCW sites. Cell Rep. 2014;8:557–569. doi: 10.1016/j.celrep.2014.06.021. [DOI] [PMC free article] [PubMed] [Google Scholar]
- Zheng S., Vuong B.Q., Vaidyanathan B., Lin J.Y., Huang F.T., Chaudhuri J. Non-coding RNA generated following Lariat debranching mediates targeting of AID to DNA. Cell. 2015;161:762–773. doi: 10.1016/j.cell.2015.03.020. [DOI] [PMC free article] [PubMed] [Google Scholar]
Associated Data
This section collects any data citations, data availability statements, or supplementary materials included in this article.
Supplementary Materials
Data Availability Statement
The accession number for the ChRNA-seq data reported in this paper is GEO: GSE95635. Raw image files have been deposited in the Mendeley Data repository (https://data.mendeley.com/datasets/z747pf6sd9/draft?a=c2b73047-5f9c-4ad9-b65a-9894f4fedfb0).