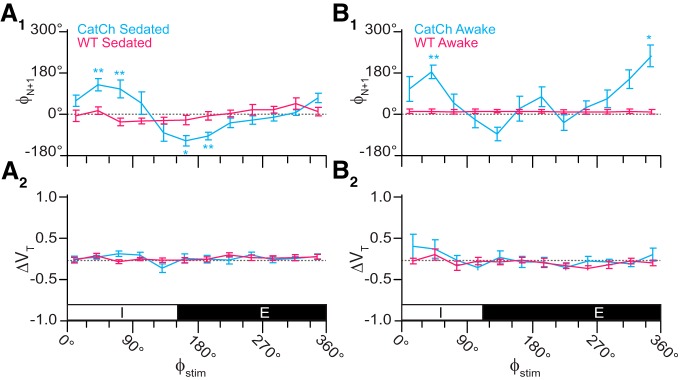
Figure 10.
Effects of brief photostimulation on VT and ΦN+1 in Dbx1;CatCh mice (n = 4, cyan) or wild-type littermates (n = 4, magenta). A1, Phase-response curve plotting ΦN+1 versus ΦStim throughout the breathing cycle in sedated mice. A2, Phase-response curve for changes in VT following photostimulation (i.e., the perturbed breath) in the same cohort of sedated mice (n = 4). The abscissa marks the inspiratory (I, 0–150°) and expiratory (E, 150–360°) phases of the breathing cycle (0–360°), which applies to A1, A2. B1, Phase-response curve plotting ΦN+1 versus ΦStim in awake unrestrained mice. B2, Phase-response curve for ΔVT versus ΦStim in the same cohort of awake unrestrained mice. The abscissa marks the inspiratory (I, 0–110°) and expiratory (E, 110–360°) phases of the complete breathing cycle (0–360°), which applies to B1, B2.

