

Abstract
Iron–sulfur (Fe-S) clusters are ancient cofactors in cells and participate in diverse biochemical functions, including electron transfer and enzymatic catalysis. Although cell lines derived from individuals carrying mutations in the Fe-S cluster biogenesis pathway or siRNA-mediated knockdown of the Fe-S assembly components provide excellent models for investigating Fe-S cluster formation in mammalian cells, these experimental strategies focus on the consequences of prolonged impairment of Fe-S assembly. Here, we constructed and expressed dominant–negative variants of the primary Fe-S biogenesis scaffold protein iron–sulfur cluster assembly enzyme 2 (ISCU2) in human HEK293 cells. This approach enabled us to study the early metabolic reprogramming associated with loss of Fe-S–containing proteins in several major cellular compartments. Using multiple metabolomics platforms, we observed a ∼12-fold increase in intracellular citrate content in Fe-S–deficient cells, a surge that was due to loss of aconitase activity. The excess citrate was generated from glucose-derived acetyl-CoA, and global analysis of cellular lipids revealed that fatty acid biosynthesis increased markedly relative to cellular proliferation rates in Fe-S–deficient cells. We also observed intracellular lipid droplet accumulation in both acutely Fe-S–deficient cells and iron-starved cells. We conclude that deficient Fe-S biogenesis and acute iron deficiency rapidly increase cellular citrate concentrations, leading to fatty acid synthesis and cytosolic lipid droplet formation. Our findings uncover a potential cause of cellular steatosis in nonadipose tissues.
Keywords: iron metabolism; iron-sulfur protein; fatty acid metabolism; cell metabolism; metabolomics; mitochondria; lipid synthesis; iron deficiency; metabolic reprogramming; steatosis; iron, Fe-S clusters; mitochondrial disease; lipoic acid; fatty acid biosynthesis
Introduction
Iron–sulfur (Fe-S) clusters are ancient components of the cellular machinery that provide essential cofactors for numerous proteins. In addition to serving as a conduit for electron transport in respiratory chain complexes, Fe-S clusters catalyze chemical oxidation–reduction reactions and participate in cellular regulatory signaling (1). In the nucleus, Fe-S clusters are cofactors in several crucial DNA repair enzymes (2, 3), and Fe-S clusters are essential for the function of the eukaryotic cytosolic RNA polymerases (4). Thus, Fe-S proteins are essential for cell survival and proliferation.
Fe-S assembly scaffolds have been a focus of attention since their discovery in nitrogen-fixing bacteria (5, 6), and mutations in the human Fe-S scaffold ISCU cause hereditary diseases in humans (7, 8). In human cells, Fe-S clusters are assembled on a multimeric complex containing the ISCU scaffold, cysteine desulfurase NFS1, and accessory proteins ISD11 and frataxin (9). Binding of the HSPA9/HSC20 chaperone/co-chaperone system facilitates ATP-dependent transfer of the nascent Fe-S clusters to recipient Fe-S proteins (10, 11), which is mediated by LYR tripeptide motifs in recipient proteins that bind to the HSC20 co-chaperone (12).
Fe-S clusters assembled on the ISCU scaffold are labile and transient, and clusters are often lost during protein purification, during exposure to oxygen, or by treatment with mild reducing agents (13–15). The Fe-S cluster lability of ISCU has been attributed to a conserved aspartate residue adjacent to one of the Fe-S cluster–ligating cysteines (Asp-37 in Azotobacter vinelandii NifU; Asp-71 in human ISCU) (13) and has been proposed to confer the ability of the scaffold to release nascent Fe-S clusters for transfer to recipient proteins (15, 16). A mutant of IscU (NifUD37A) that more stably bound [2Fe-2S] clusters (13) was later shown to trap the cysteine desulfurase IscS (14) and to inhibit transfer of Fe-S clusters to purified apo-aconitase in vitro (16), resulting in a dominant–negative growth phenotype in A. vinelandii (14). Molecular modeling based on the IscU-IscS crystal structure suggested that the conserved aspartate in IscU served as a fourth ligand for the nascent [2Fe-2S] cluster, allowing dissociation of a cluster-ligating cysteine in IscS and associated conformational changes (15).
Although complete loss of ISCU is lethal in all organisms tested to date (14, 17, 18), assessment of ISCU deficiency on cellular metabolism in mammalian cells has been limited to knockdown experiments (19) and/or study of patient tissues that are naturally deficient in ISCU (7, 18, 20, 21). In this study, we expressed dominant–negative mitochondrial ISCU variant proteins in a human cell line (HEK293) to investigate the effects of acute loss of Fe-S enzymes on cellular metabolism. We found that high cellular citrate levels and lipid accumulation are early and acute metabolic consequences of Fe-S cluster deficiency. These findings highlight the remodeling of cellular metabolism that occurs during acute iron deficiency and/or defective Fe-S cluster assembly and draw our attention to a previously unrecognized mechanism of intracellular lipid droplet accumulation, which is a process underlying numerous disease pathologies (e.g. see Ref. 22).
Results
ISCU variants disrupt cell growth and mitochondrial morphology
ISCU is the main scaffold protein upon which nascent Fe-S clusters are first assembled and then transferred to recipient proteins (9). Spectroscopic studies and crystallography have identified the crucial cysteine residues in the NifU/ISCU protein that are important for coordination of a labile [2Fe-2S] cluster in the scaffold (Fig. 1A). We used site-directed mutagenesis of the human mitochondrial ISCU2 ORF (hISCU2) that contained a C-terminal Myc tag sequence. ISCU2D71A-Myc contains a mutation analogous to that previously reported in the A. vinelandii NifU scaffold (D37A) (13); (Fig. 1B). The D71A substitution in hISCU2 was predicted to stabilize the Fe-S cluster on the ISCU scaffold by decreasing solvent accessibility (13). In addition, we constructed an ISCU2C69S-Myc mutant sequence that we predicted would be unable to effectively ligate a nascent Fe-S cluster (13), as this cysteine residue is a crucial iron-coordinating ligand of the nascent Fe-S cluster (Fig. 1C) (15).
Figure 1.

ISCU mutants disrupt cell growth and mitochondrial morphology. A–C, model of the Fe-S cluster ligating residues in the ISCU scaffold and predicted positions of the altered residues in the mutant proteins. D, immunoblots of total protein lysates showing expression of ISCU and the accessory Fe-S assembly factors cysteine desulfurase NFS1, the structural protein ISD11, and frataxin. *, predicted uncleaved mitochondrial precursor proteins; **, predicted protein degradation fragments. E, immunoprecipitation of recombinant ISCU protein using anti-Myc beads showed that NFS1 and ISD11, but not frataxin, were bound in a stable complex. F, real-time cell proliferation analysis revealed no change in cell growth following induction of ISCU2WT protein expression, whereas induction of ISCU2D71A or ISCU2C69S expression resulted in diminished cell proliferation. Arrows, time of addition of either vehicle (water) or 1 μg/ml doxycycline. Cell growth was monitored using an Incucyte FLR instrument (see “Experimental procedures”; n = 5, mean ± S.D.). G–J, EM demonstrated significant mitochondrial swelling and distorted cristae in cells induced to express ISCU2D71A or ISCU2C69S for 24 h.
To evaluate the functionality of our ISCU constructs, we stably integrated them into HEK293 Flp-InTM cells, in which transgene expression was tightly repressed until doxycycline was added to the culture medium. Control cell lines stably harboring either empty vector or Myc-tagged GFP were also generated. Immunoblotting demonstrated robust expression of the WT and the two mutant ISCU constructs in the cells (Fig. 1D). Notably, significant levels of the mitochondrial precursor ISCU protein were observed during overexpression of all three ISCU2 constructs (Fig. 1D, arrows). Expression of the ISCU binding partners NFS1, ISD11, and frataxin was consistent in all of the samples; however, the band corresponding to the partially processed intermediate mitochondrial precursor of frataxin (23) was not present in the lysates from cells expressing either ISCU2D71A or ISCU2C69S mutant constructs (Fig. 1D, asterisk). We immunoprecipitated the recombinant WT or mutant ISCU proteins from these cell lysates using anti-Myc beads and analyzed the eluates for the presence of known ISCU binding partners NFS1, ISD11, and frataxin (Fig. 1E). We observed abundant amounts of immunoprecipitated ISCU and found that NFS1 and ISD11 remained stably bound to ISCU during the immunoprecipitation procedure (Fig. 1E, middle panels); however, no frataxin protein was detected (Fig. 1E, bottom), probably due to the transient nature of its interaction with the NFS1-ISD11-ISCU initial complex. Together, these data suggest that the mutant ISCU2D71A or ISCU2C69S proteins retained the ability to bind stably to two proteins of the initial Fe-S assembly machinery in vivo.
Using an Incucyte FLRTM live-cell imager, we found that cell growth was halted in ISCU2D71A cells ∼12 h following induction of transgene expression, and cells remained quiescent for the remainder of the experiment (Fig. 1F). Cells expressing ISCU2C69S protein also showed diminished cell growth, whereas cells expressing WT ISCU2 (ISCU2WT) showed no appreciable change in proliferation rate. The growth defect in cells expressing ISCU2D71A and ISCU2C69S proteins appeared to be cytostatic, as the cells did not detach from the dish and die even after 96 h of protein induction. We also evaluated mitochondrial morphology by EM and found that, in contrast to cells expressing GFP (Fig. 1G) or ISCU2WT (Fig. 1H), cells expressing ISCU2D71A (Fig. 1I) and ISCU2C69S (Fig. 1J) showed dramatic alterations in mitochondrial morphology characterized by swollen mitochondria with disruption of cristae. These observations suggested that profound metabolic alterations were taking place in the cells following expression of ISCU2D71A and ISCU2C69S.
Cells expressing ISCU variants lose aconitase activity and activate iron-responsive element (IRE)-binding activity of IRP1 and IRP2
Loss of ISCU function, either as a result of siRNA-mediated knockdown in cultured cells (19) or in patients due to a splicing mutation of ISCU (7, 8), results in an inability of mitochondrial and cytosolic aconitases to acquire the [4Fe-4S] clusters needed for their enzymatic function. We evaluated aconitase activity using native gel activity assay (19) in our HEK293 cells (Fig. 2A). The results demonstrated that cells expressing ISCU2D71A or ISCU2C69S had undetectable levels of mitochondrial and cytosolic aconitase activities (Fig. 2A). In contrast, the IRE2 mRNA-binding activities of IRP1 and IRP2 robustly increased in cells expressing ISCU2D71A or ISCU2C69S (Fig. 2B), indicating that cytosolic iron levels were low.
Figure 2.
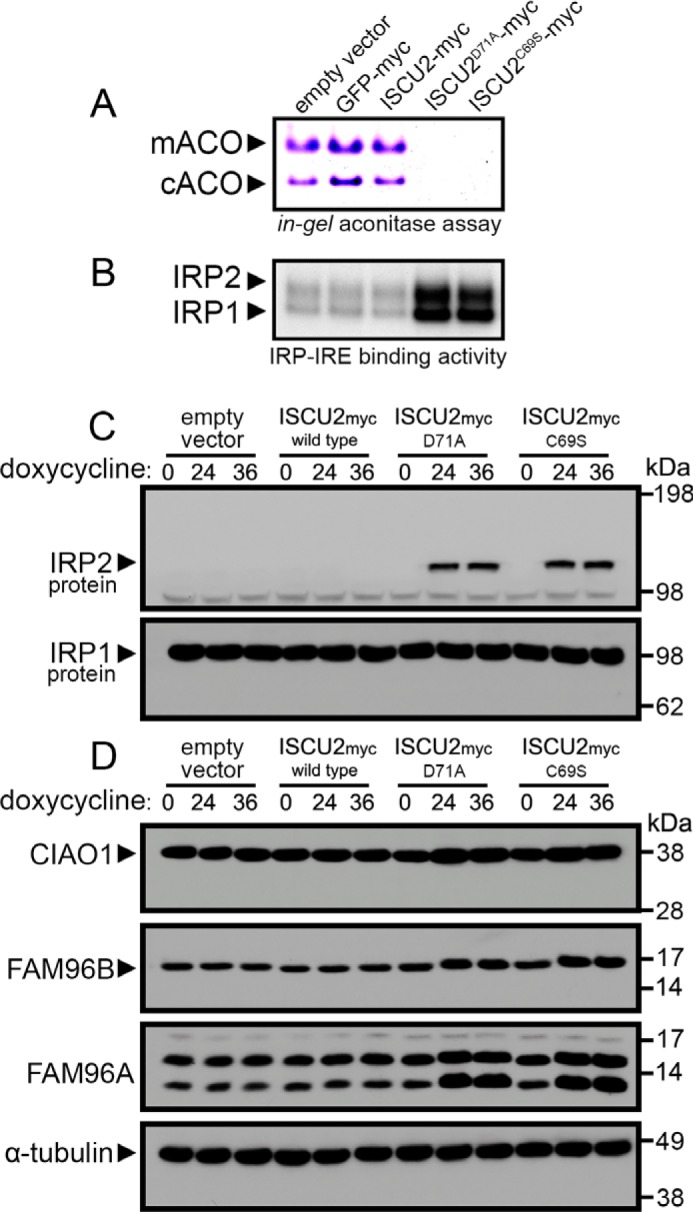
Loss of aconitase activity and activation of iron-regulatory proteins in cells expressing dominant–negative ISCU mutants. A, aconitase activity gel demonstrated decreased mitochondrial and cytosolic aconitase activities in cells expressing ISCU2D71A or ISCU2C69S following a 24-h incubation with doxycycline. B, analysis of ferritin IRE binding activity of IRP1 and IRP2 by an electrophoretic mobility shift assay demonstrated increased IRP activity in cells expressing ISCU2D71A or ISCU2C69S. C, immunoblot analyses of protein levels in cells expressing ISCU2D71A or ISCU2C69S for either 24 or 36 h demonstrated robust stabilization of IRP2 protein in cells expressing ISCU2D71A or ISCU2C69S, whereas IRP1 protein abundance was unchanged. D, protein abundance of CIAO1, FAM96B, and FAM96A were also evaluated by immunoblot. α-tubulin was the loading control for cytosolic proteins.
We performed a time course experiment in which cells harboring empty vector, ISCU2WT,ISCU2D71A, or ISCU2C69S were harvested following either no treatment or 24 or 36 h of induction of transgene expression. Immunoblotting revealed that IRP2 protein levels were greatly increased in cells expressing ISCU2D71A or ISCU2C69S, whereas expression levels of IRP1 protein were unchanged, consistent with the differential modes of activation of the IRPs under iron-deficient conditions; c-aconitase loses its Fe-S cluster and converts into an IRE-binding protein (24), whereas IRP2 protein is stabilized in iron-deficient cells, as it is not rapidly degraded by the iron-dependent, FBXL5-mediated ubiquitination and proteasomal degradation pathway (25, 26) (Fig. 2C). We also evaluated expression of proteins of the cytosolic iron–sulfur assembly pathway, CIAO1, FAM96B, and FAM96A (27), and found that levels of these proteins were moderately increased in cells expressing ISCU2D71A or ISCU2C69S for 24 or 36 h (Fig. 2D; Fig. S6). The molecular pathway underlying these changes in protein expression is the subject of a separate study (28).
Overexpression of ISCU2D71A and ISCU2C69S caused decreased abundance and activity of Fe-S and lipoate-containing proteins
Cells expressing ISCU2D71A and ISCU2C69S showed a profound misregulation of cellular iron homeostasis as assessed by increased IRE-binding activity of IRP1 and IRP2 (Fig. 2B) and loss of activity of cytosolic and mitochondrial aconitases. We analyzed the expression and activities of several other Fe-S proteins (Fig. 3A), including the mitochondrial enzyme ferrochelatase (FECH), cytosolic glutamine-phosphoribosylpyrophosphate amidotransferase (PPAT), and nuclear endonuclease III-like protein 1 (NTHL1). The abundance of these Fe-S proteins was markedly decreased in cells expressing ISCU2D71A and ISCU2C69S (Fig. 3A). In contrast, levels of CIV-IV (complex IV subunit 4), which does not possess an Fe-S cluster, were relatively unchanged (Fig. 3A). We next evaluated the activity of mitochondrial complex II by performing BN-PAGE and assaying for succinate dehydrogenase (SDH) activity. Our data showed a marked decrease in SDH activity in cells expressing ISCU2D71A and ISCU2C69S that was associated with decreased levels of the Fe-S cluster–containing subunit SDHB (Fig. 3B). In contrast, levels of the SDH flavoprotein subunit SDHA as well as mitochondrial import receptor subunit TOM20 were unchanged (Fig. 3B). Complex I activity was also significantly reduced in cells expressing ISCU2D71A and ISCU2C69S (Fig. 3C), as were protein levels of the Fe-S–containing complex I subunit NDUFS1 (Fig. 3C). In contrast, NFS1 protein levels remained unchanged (Fig. 3C).
Figure 3.

Widespread loss of Fe-S and lipoate-dependent proteins in cells expressing dominant–negative ISCU mutants. A, cells expressing ISCU2D71A or ISCU2C69S for either 24 or 36 h showed decreased protein levels of Fe-S enzymes in mitochondria (FECH), cytosol (PPAT), and nucleus (NTHL1) and a robust decrease in mitochondrial and cytosolic aconitase activities. B, analysis of complex II activity by in-gel activity assay revealed decreased SDH enzyme activity in cells expressing ISCU2D71A or ISCU2C69S. Immunoblots demonstrated decreased SDHB protein levels, but SDHA protein levels were unchanged in cells expressing ISCU2D71A or ISCU2C69S. Immunoblotting of TOM20 served as the loading control for mitochondrial proteins. C, in-gel assay of NADH-tetrazolium reductase activity showed decreased complex I activity in cells expressing ISCU2D71A or ISCU2C69S for 24 and 36 h. Immunoblotting showed decreased abundance of the complex I core subunit, NDUFS1, but no change in levels of cysteine desulfurase NFS1. Immunoblots revealed decreased protein levels of LIAS and decreased lipoylation of the subunits of pyruvate dehydrogenase (DLST) and α-ketoglutarate dehydrogenase (DLAT) (D) and GCSH (E). F, further immunoblotting showed that total protein levels of these subunits were not decreased.
The activity of several crucial mitochondrial enzymes depends on the cofactor lipoic acid, which must be enzymatically generated from octanoic acid by the addition of two sulfur atoms at the C6 and C8 positions before covalent attachment to lipoate-dependent enzymes (29, 30). Lipoic acid synthase (LIAS) possesses two [4Fe-4S] clusters per subunit that are crucial for its enzymatic activity (31, 32). Protein levels of LIAS were profoundly decreased in cells expressing ISCU2D71A and ISCU2C69S (Fig. 3D). Using an antibody specific for lipoylated lysine residues in proteins, we found that lipoylation of several proteins was variably decreased; the ∼62-kDa E2 dihydrolipoyllysine-residue subunit of pyruvate dehydrogenase (DLAT) was about 50% decreased, whereas the ∼49-kDa dihydrolipoyllysine residue subunit of α-ketoglutarate dehydrogenase (DLST), ∼49-kDa lipoamide acyltransferase component of branched-chain α-keto acid dehydrogenase complex (DBT) (Fig. 3D), and the ∼12-kDa glycine cleavage system H (GCSH) subunit were more markedly decreased (Fig. 3E). Immunoblots did not reveal decreased total protein levels of these enzymes in the Fe-S–deficient cells expressing ISCU2D71A and ISCU2C69S (Fig. 3F); rather, total protein levels of DLAT and DLST showed a moderate increase (Fig. 3F). Decreased lipoylation of proteins was also observed in muscle biopsies from patients with defective Fe-S cluster assembly due to long-term deficiency of ISCU (Fig. S1) (7, 20). Notably, loss of lipoylation of the pyruvate dehydrogenase subunit DLAT was more severe in these muscle biopsies (Fig. S1A). Total protein levels of the lipoate-containing enzyme subunits were not decreased in skeletal muscle (Fig. S1B), and mRNA expression levels for LIAS and lipoate-containing subunits significantly increased (Fig. S1D), suggesting that the lipoate synthesis pathway may have been up-regulated in response to defective lipoylation of target enzymes.
Elevated intracellular citrate in Fe-S–deficient cells
The widespread loss of Fe-S– and lipoate–dependent enzymes was expected to result in changes in the abundance and flux of intracellular metabolites. To identify which central metabolic pathways were most adversely affected, we performed a glucose tracer experiment in which proliferating control HEK293 cells harboring the empty vector or cells expressing the ISCU2D71A mutant for 12 h were switched to tracer medium containing [13C6] glucose and incubated for a further 24 h and then rapidly quenched with cold acetonitrile and extracted for metabolite analysis (Fig. 4A). 1H-{13C} HSQC NMR analysis of polar extracts of these cells revealed numerous changes in the distribution of carbon derived from the [13C6]glucose tracer following the 24-h labeling period (Fig. 4B). Notably, NMR analysis suggested that intracellular [13C6]glucose/glucose 6-phosphate levels increased in cells expressing ISCU2D71A (Fig. 4B), whereas several positions of the adenine ring (8, 2) in AXP and the ribose ring (1′) of AXP showed significantly less 13C signal (Fig. 4B), suggesting that purine synthesis was diminished, probably due to loss of [4Fe-4S]-containing PPAT enzyme activity (discussed further below). Finally, prominent doublet peak resonances at 2.66 and 2.69 ppm consistent with 13C labeling of the 2- and/or 4-position of citrate were observed in cells expressing ISCU2D71A, whereas only a smaller apparent triplet resonance (2.65, 2.68, 2.70 ppm) was observed in control cells, corresponding to 13C labeling of aspartate as well as citrate and malate (Fig. 4B).
Figure 4.

Increased cellular citrate levels in Fe-S–deficient cells. A, HEK293 cells harboring either empty vector or ISCU2D71A were induced with doxycycline treatment 12 h before metabolic labeling for 24 h with 25 mm [13C6]glucose. B, incorporation of [13C6]glucose into cellular metabolites in cells expressing either empty vector or ISCU2D71A was assessed by 1H-13C HSQC NMR. Spectra are normalized to total cellular protein content measured by a BCA assay (see “Experimental procedures”). C, total cellular quantities of TCA cycle intermediates were assessed by GC-MS, revealing an 11.4-fold increase in intracellular citrate (n = 4, mean ± S.D. (error bars)). D, analysis of the fractional distribution of citrate isotopologues by GC-MS showed a 15.2-fold increase in the m+2 fraction of citrate derived from [13C6]glucose in cells expressing ISCU2D71A (n = 3, mean ± S.D.). E, the predominant metabolic pathway leading to increased citrate levels in cells expressing ISCU2D71A. The large increase in m+2 citrate suggested that the majority of the increased cellular citrate was a result of the combined action of pyruvate dehydrogenase and citrate synthase reactions together with the loss of aconitase activity. Shown is analysis of glycolytic intermediates by IC-UHR-FTMS (F); hexoses and lactate (G); hexosamines GlcNAc 1/6-phosphate (GlcNAc-P), UDP-GlcNAc, and UDP-GalNAc (H); and pentose phosphate pathway metabolites (I) (n = 4; percentage of control ± S.D.). J, levels of adenylates ATP, AMP, and ADP in empty vector control and ISCU2D71A cells. *, p < 0.05; **, p < 0.01.
To further evaluate the metabolic alterations arising from overexpression of ISCU2D71A, we used GC-MS to measure the total abundance and 13C enrichment of tricarboxylic acid (TCA) cycle metabolites from the same polar cell extracts that were used for the NMR analysis described above. The most striking change observed in these analyses was an 11-fold increase in intracellular citrate levels in cells expressing ISCU2D71A (Fig. 4C), resulting in a marked elevation of cellular citrate concentrations to levels higher than most other measured metabolites (e.g. 168 nmol/mg protein citrate versus <10 nmol/mg for other TCA cycle intermediates in ISCU2D71A cells; see Fig. 4C and Fig. S2). Intracellular levels of cis-aconitate were also substantially increased, whereas α-ketoglutarate levels decreased significantly in ISCU2D71A cells (Fig. 4C and Fig. S2). Most (∼65%) of the elevated citrate in cells expressing ISCU2D71A contained two additional mass units (m+2; Fig. 4D), indicating that this pool of citrate arose from condensation of [13C6]glucose-derived acetyl-CoA generated from residual pyruvate dehydrogenase activity with unlabeled oxaloacetate via the citrate synthase reaction (Fig. 4E and Fig. S2). This m+2 citrate accumulated in cells expressing ISCU2D71A because both mitochondrial and cytosolic aconitase activities were undetectable in the ISCU2D71A cells (Figs. 2A and 3A), leading to citrate accumulation as well as depletion of the downstream product α-ketoglutarate (Fig. 4C and Fig. S2). Significant quantities of the m+4 citrate isotopologue were also observed in ISCU2D71A cells (Fig. 4D), probably due to residual amounts of aconitase-mediated TCA cycle activity present early in the 13C labeling period (Fig. 4E and Fig. S2).
Citrate is a known allosteric inhibitor of the glycolytic enzyme phosphofructokinase-1 (PFK-1) (33, 34), and elevated citrate decreased the rate of glycolysis in several in vivo animal studies (33, 35). We analyzed glycolytic metabolites in our polar cell extracts and observed a ∼93% decrease in the product of the PFK-1 reaction, fructose 1,6-bisphosphate, in cells expressing ISCU2D71A relative to control empty vector–containing cells (Fig. 4F). Downstream glycolysis intermediates 1,3-bisphosphoglycerate, 2- and 3-phosphoglycerate, and phosphoenolpyruvate also decreased, albeit to a lesser extent than fructose 1,6-bisphosphate, possibly indicating replenishment of these intermediates by glyceraldehyde 3-phosphate derived from flux of glucose through the pentose phosphate pathway. Consistent with our observations in the NMR spectra (Fig. 4B), increased amounts of intracellular glucose/hexoses as well as decreased lactate levels were observed in cells expressing ISCU2D71A (Fig. 4G), suggesting that glycolysis rates decreased. Levels of GlcNAc-phosphate, UDP-GlcNAc, UDP-GalNAc, and 6-phosphogluconate in ISCU2D71A cells increased 6-, 3-, 6-, and 3-fold relative to control, respectively (Fig. 4, H and I), indicating that glucose-derived carbon was significantly diverted into both the glucosamine and oxidative pentose phosphate pathways. Finally, our analyses revealed a significant decrease in total cellular AMP and ADP levels in cells expressing ISCU2D71A, whereas total ATP levels in these cells were not different from control cells (Fig. 4I), suggesting that adenylate homeostasis was altered in our acutely Fe-S cluster–deficient cells.
In-depth analysis of de novo purine biosynthesis by UHR-FTMS demonstrated intracellular buildup of the PPAT substrate 5-phosphoribosyl pyrophosphate (Fig. S3B), whereas total amounts and 13C incorporation from glucose into downstream de novo purine biosynthesis intermediates 5-phosphoribosyl-N-formylglycinamide, IMP, and adenylosuccinate decreased sharply in cells expressing ISCU2D71A (Fig. S3, D–F). We observed a sharp attenuation in 13C incorporation into the isotopologues of the adenylates AMP, ADP, and ATP (Fig. S3, G–I) and statistically significant decreases in total amounts of total ADP and AMP, but not ATP (Fig. 4J). Total cellular ATP concentrations appeared to be maintained by the presence of a larger pool of unlabeled, previously synthesized ATP (Fig. S3G), resulting in an increase in the total cellular ATP/ADP ratio from 7.3 ± 0.2 in control cells to 16.4 ± 0.9 in cells expressing ISCU2D71A.
Lipid biosynthesis in Fe-S–deficient cells
The robust increase in 13C-labeled citrate concentration in cells expressing ISCU2D71A suggested that non-Fe-S–dependent enzymatic reactions that utilize citrate might be stimulated. In particular, lipid biosynthesis can proceed when ATP-citrate lyase generates cytosolic acetyl-CoA from citrate driven by ATP hydrolysis. To calculate the predicted enrichment of lipids from [13C6]glucose during the tracer experiment expected for maintenance of cellular homeostasis, we first quantified the precise differences in cellular proliferation rate (Fig. 5A). During the [13C6]glucose labeling period, control cells underwent 1.12 ± 0.07 population doublings, whereas cells expressing ISCU2D71A underwent only 0.16 ± 0.01 population doublings (Fig. 5B). Using these data, we calculated that the maximum expected enrichment in lipids from [13C6]glucose would be ∼52% in control cells, whereas cells expressing ISCU2D71A, which had largely ceased to proliferate, would have been expected to show a lipid 13C enrichment of just 14%.
Figure 5.

Lipid biosynthesis proceeded in Fe-S–deficient cells despite lack of cell growth. A, ISCU2D71A cells were plated at a higher initial seeding density to obtain comparable amounts of cells at the end of the experiment, and cell proliferation was monitored by real-time imaging (n = 6, mean ± S.D. (error bars)). B, analysis of cell proliferation during the [13C6]glucose tracer experiment demonstrated that growth of cells was greatly diminished after 12 h of doxycycline-induced induction of ISCU2D71A expression (n = 6, mean ± S.D.). C, representative lipid HSQC NMR spectra from [13C6]glucose-labeled cells expressing empty vector (black trace) or ISCUD71A (blue trace). Unlabeled empty vector cells (gray) grown in the presence of unlabeled [12C]glucose are also shown for reference. These spectra reflect the combined resonances from all extracted lipid species in the sample. D, a glycerolipid structure is shown for partial HSQC NMR peak assignment. Side chain R can include a third acyl chain (triacylglycerol), a proton (diacylglycerol) phosphatidylcholine, phosphatidylethanolamine, etc. E, 13C enrichment of the various lipid functional groups was assessed by 1H-13C HSQC NMR. Integrated peak areas were normalized to the methanol solvent peak and plotted as a percentage of control (empty vector) peak areas (n = 3, mean ± S.D.). *, p < 0.05.
To assess the actual incorporation of [13C6]glucose-derived carbon into lipids during the [13C6]glucose tracer experiment, we performed 1H-{13C}- HSQC NMR analyses on the lipid fractions extracted from HEK293 cells expressing empty vector or ISCU2D71A (Fig. 5C). These fractions contain complex lipids in the form of triacylglycerols and glycerophospholipids as well as cholesterol and its esters. The spectra revealed that cells bearing either the empty vector or the ISCU2D71A synthesized new complex lipids, as both the fatty acyl chains and the glycerol subunits were much more intense than the unlabeled cells (Fig. 5C). Furthermore, the 13C intensities of the lipids in the [13C6]glucose experiments were similar in both the fatty acyl chains and the glycerol subunit in the control and ISCU2D71A samples (Fig. 5E), suggesting that robust synthesis of lipids from [13C6]glucose proceeded in ISCU2D71A cells, although they had ceased to proliferate. This is quite different from purine nucleotide biosynthesis, which largely ceased in the ISCU2D71A cells (see above). However, the incorporation of glucose-derived 13C into cholesterol methyl groups was significantly lower in ISCU2D71A cells (Fig. 5E), suggesting that cholesterol biosynthesis decreased, whereas the natural abundance choline methyl groups were on average 25% greater in the ISCU2D71A extracts (Fig. 5E), suggesting a small increase in total membrane phospholipids in these extracts.
To directly evaluate the 13C fractional enrichment of selected lipid functional groups in [13C6]glucose-labeled cells expressing empty vector or ISCU2D71A sequences, we quantified peak areas in selected regions of 2D TOCSY NMR spectra corresponding to the glycerol subunit and the fatty acyl chains, as shown in Fig. S4 (A and B). 13C enrichment in the three glycerol carbons was 49.7 ± 4.7% in the control sample and 41.7 ± 3.2% in the ISCU2D71A sample, whereas the fatty acyl chains reached 13C enrichment at the ω-methyl position of 11.0% in the empty vector control sample and 15.5% in the ISCU2D71A sample. The low 13C enrichment of ω-methyl groups in WT HEK293 cells suggests that they derived substantial components of their cellular lipid content from sources other than glucose under standard culture conditions (36, 37). In contrast, cells expressing ISCU2D71A showed 13C enrichment in their lipids that was far greater than expected when compared with the calculated maximum expected 13C enrichment values reported above, further demonstrating that de novo lipid biosynthesis proceeded in Fe-S cluster–deficient ISCU2D71A cells despite their greatly diminished proliferation.
To evaluate potential changes in the regulation of enzymes involved in fatty acid biosynthesis, we performed Western blotting using the protein residues that were obtained during our [13C6]glucose tracer experiment. Notably, the phosphorylation status of the energy-sensing protein kinase AMPKα and its target acetyl-CoA carboxylase (ACC1/2) did not change appreciably during the tracer experiment (Fig. S5, A and B), despite the profound changes in cellular metabolism brought on by Fe-S deficiency in ISCU2D71A cells. In contrast, Western blots confirmed decreased lipoylation of α-ketoglutarate dehydrogenase (Fig. S5C) as well as decreased abundance of the Fe-S–containing complex II subunit SDHB (Fig. S5D), confirming that Fe-S deficiency occurred during the tracer experiment. Notably, significant quantities of the pyruvate dehydrogenase subunit, DLAT, remained lipoylated at the end of the tracer experiment, thus allowing for the large accumulation of m+2 citrate in ISCU2D71A cells.
Lipid droplet accumulation in Fe-S–deficient and iron-deficient cells
The above data suggested that significant glycerolipid biosynthesis proceeded in Fe-S cluster–deficient ISCU2D71A cells despite the nearly complete termination of cell growth. This suggested that newly formed fatty acids in ISCU2D71A cells might be used for purposes other than making new cell membranes. A distinct possibility is the formation and accumulation of lipid droplets (22). To spatially evaluate cellular lipid distribution, we visualized lipids in control cells and in cells expressing ISCU2D71A using BODIPY 493/503 staining and fluorescence microscopy (Fig. 6). In uninduced HEK293 control cells, the BODIPY staining pattern was consistent with labeling of endoplasmic reticulum and plasma membrane, and few lipid droplets were observed (Fig. 6A). In contrast, cells induced to express ISCU2D71A or ISCU2C69S for 48 h showed accumulation of numerous small lipid droplets throughout the cytoplasm (Fig. 6, B and C). These data suggested that lipid droplets might constitute a storage depot for the de novo synthesized lipids in Fe-S–deficient cells. To test this further, we subjected HEK293 cells to acute iron deficiency for 24 h by treatment with the iron chelator desferrioxamine (DFO) and assayed for lipid droplet formation using BODIPY. Similar to expression of ISCU2D71A or ISCU2C69S, 24-h treatment of cells with DFO results in strong depletion of mitochondrial and cytosolic aconitase activities in cultured cells (19). In contrast to control cells, which showed very few lipid droplets (Fig. 6D), HEK293 cells treated with 100 or 300 μm DFO showed robust accumulation of cytoplasmic lipid droplets (Fig. 6, E and F). Finally, strong accumulation of lipid droplets was also seen in primary human renal cortical epithelial (HRCE) cells treated with 50 and 150 μm DFO (Fig. 6, G–I). Notably, HRCE cells are nontransformed primary cells and do not possess any known genetic abnormalities.
Figure 6.

Lipid droplet accumulation in Fe-S–deficient and iron-deficient cells. BODIPY staining was used to assess the presence of lipid droplets in HEK293 cells. A, ISCU2D71A cells without the addition of doxycycline. B, ISCU2D71A cells treated with doxycycline for 48 h. C, cells expressing ISCUC69S treated with doxycycline for 48 h. D, parental HEK293 control cells. E, HEK293 cells treated with 100 μm DFO for 24 h. F, HEK293 cells treated with 300 μm DFO for 24 h. G–I, primary cells derived from human kidney cortex tissue (HRCE cells) were treated with 0, 50, or 150 μm DFO for 48 h and stained for lipid droplets with BODIPY. The green channel shows BODIPY staining of cellular lipids, whereas the blue channel shows nuclei stained with DAPI. Bar, 10 μm.
Discussion
To date, biological studies of the human Fe-S cluster scaffold ISCU have relied on RNAi-mediated knockdown strategies (19), genetic studies in model organisms (17), and hypomorphic human disease models (7, 8, 20, 21). We reasoned that the acute effects of Fe-S cluster deficiency on cellular metabolism would be most clearly observed using a system that disrupted cellular Fe-S cluster biosynthesis more rapidly and completely. We engineered inducible dominant–negative forms of the ISCU scaffold in human cells that acutely disrupt the function of recipient Fe-S proteins, resulting in rapid loss of Fe-S proteins in multiple cellular compartments as well as decreases in lipoate-dependent mitochondrial enzymes. The major phenotypic effects resulting from acute Fe-S depletion were loss of proliferative ability, increased citrate levels, decreased overall metabolic rates, and increased deposition of newly synthesized lipids into cytoplasmic lipid droplets.
The rapid and acute loss of aconitase activity caused a dramatic increase in cellular glucose-derived citrate, which is a known allosteric inhibitor of PFK-1 (33, 34). Inhibition of PFK-1 by elevated citrate leads to accumulation of glucose 6-phosphate and decreased rates of glycolysis in diabetic animal muscles and during oxidation of fatty acids and ketone bodies in various tissues (33, 35). This acute, hormone-independent reciprocal control of intracellular glucose and fatty acid oxidation by citrate is part of a regulatory pathway termed the Randle cycle (38). We found that citrate accumulation caused by aconitase deficiency was an early and acute metabolic consequence of Fe-S cluster deficiency in ISCU2D71A-expressing HEK293 cells. Our data demonstrated that the immediate metabolic consequences of the >10-fold increase in intracellular citrate in Fe-S–deficient cells included acute inhibition of glycolysis at the level of PFK and the shunting of glucose 6-phosphate into the pentose phosphate pathway, probably enhancing production of NADPH in the cytosol. We also observed shunting of glucose carbon into hexosamines including UDP-GlcNAc, which is the donor molecule for glycosylation of cellular proteins. Recently, increased glycosylation of PFK-1 under hypoxic conditions was shown to decrease PFK-1 activity, leading to increased glucose flux through the pentose phosphate pathway (39). Thus, increased glycosylation of PFK-1 induced by the ∼3-fold increase in UDP-GlcNAc levels in our Fe-S–deficient cells probably contributed to shunting of glucose into the pentose phosphate pathway.
Increased citrate cleavage by ATP-citrate lyase in the cytosol probably resulted in abundant cytosolic acetyl-CoA and formation of malonyl-CoA by ACC1/2, leading to de novo fatty acid biosynthesis. Together, these metabolic alterations explain our observation that de novo biosynthesis of lipids from glucose-derived carbon proceeded in the Fe-S–deficient cells, although the cells had ceased to proliferate. These observations led us to discover that acute iron and/or Fe-S cluster deficiency resulted in formation of abundant cytosolic lipid droplets, a phenotype typically observed only following supplementation with excess exogenous lipids or fatty acids such as palmitate. Our observations support the concept that ISCU is crucial for the function of Fe-S proteins in all cellular compartments and that cellular carbon flux can be diverted to iron-independent pathways when Fe-S clusters are unavailable for recipient Fe-S proteins.
A major question raised by our work is whether fatty acid biosynthesis may provide an iron-independent enzymatic pathway for energy storage when cellular iron and/or Fe-S clusters are acutely deficient. Diversion of a portion of the glucose-derived citrate to lipid droplets may have provided a way for the cells to divert and store fuel-derived carbon when the aconitases were inactivated (Fig. 7). In this manner, fatty acids could be thought of as a terminal electron acceptor for reduced cofactors (e.g. NAD(P)H) and storage of glucose-derived energy during acute Fe-S cluster deficiency. Citrate allosterically activates acetyl-CoA carboxylases ACC1/2 (40), whereas phosphorylation by AMPK and other kinases leads to rapid inactivation of ACC1/2 (41). The elevated citrate and lack of change in ACC1/2 phosphorylation status suggest that the biochemical conditions were favorable for de novo fatty acid biosynthesis in our Fe-S–deficient cells. Notably, none of the enzymes of glycolysis, the pentose phosphate pathway, or the core steps of fatty acid biosynthesis have been reported to require iron or Fe-S clusters for their activity. Thus, the machinery required for maintenance of adequate ATP and NADPH production for lipid biosynthesis remained functional in our Fe-S– and iron-deficient cells. However, continued uptake of exogenous lipids and impairment of fatty acid oxidation probably also contributed significantly to lipid droplet formation in our Fe-S cluster–deficient cells (Fig. 7).
Figure 7.

Diversion of glucose-derived citrate to fatty acid biosynthesis in Fe-S–deficient and iron-deficient cells. A, in iron-replete cells with functional Fe-S cluster assembly machinery, mitochondrial and cytosolic aconitases facilitate the flow of glucose-derived carbon through the TCA cycle and respiratory chain, allowing for production of ATP via the respiratory chain. B, when Fe-S clusters are unavailable due to iron deficiency and/or disruption of the Fe-S cluster assembly machinery, iron-dependent enzymes are inactivated, fatty acid oxidation cannot occur, and citrate cannot be converted to isocitrate via mitochondrial and cytosolic aconitases. Apo-c-aconitase/IRP1 activates cellular iron starvation responses via increased IRE mRNA-binding activity. However, biochemical pathways that do not require iron cofactors, such as glycolysis, the pentose phosphate pathway, and fatty acid biosynthesis, remain active. The result is accumulation of lipids in the form of cytoplasmic lipid droplets.
Another notable finding in our work concerns the apparent differences in the rate of inactivation of lipoate-containing enzymes that occurred due to loss of the LIAS enzyme. In cells expressing ISCU2D71A, where Fe-S cluster deficiency occurred for a maximum of only 36 h, lipoylated pyruvate dehydrogenase was still relatively abundant, allowing for continued production of mitochondrial acetyl-CoA and citrate, export to the cytosol and accumulation of m+2 citrate, and cytosolic generation of acetyl-CoA by the cleavage of the citrate. In contrast, ISCU myopathy patient muscle biopsies showed nearly complete loss of pyruvate dehydrogenase lipoylation, probably a consequence of long-term Fe-S cluster and LIAS deficiency. Our data strongly suggest that a prolonged muscle-specific defect in lipoic acid synthesis contributes to the unique disease phenotype in ISCU myopathy patients due to loss of LIAS activity, as recently suggested (42). We also note that a prolonged inability to oxidize NADH in ISCU myopathy patient muscles probably resulted in a functional deficit of cellular NAD+ that may have resulted in the strong up-regulation of the NAD+ biosynthetic enzyme quinolinate phosphoribosyltransferase observed previously in these tissue biopsies (21). Finally, several recent papers have reported an interaction between the mitochondrial acyl carrier protein and Fe-S cluster assembly machinery components NFS1 and ISD11 (43, 44). It will be interesting to further investigate interactions between the acyl carrier protein domain of the cytosolic fatty acid synthase and the cytosolic Fe-S cluster assembly machinery, recently reported by Kim et al. (28).
Overaccumulations of lipid droplets in nonadipose tissues, such as heart, liver, and certain tumors, are clinically significant problems that are poorly understood (45–47). In models of Friedreich's ataxia, lipid droplet accumulation has been reported in frataxin-deficient cardiac muscle (48), isolated cardiomyocytes (49), and frataxin-deficient mouse livers (50). Additionally, large lipid droplet accumulation was observed in glial cells in a Drosophila model of Friedreich's ataxia (51). Recent studies suggest that between 30 and 40% of adults in the United States are affected by nonalcoholic fatty liver disease (52), and a significant fraction of these individuals will progress to nonalcoholic steatohepatitis, potentially leading to cirrhosis and hepatocellular carcinoma. Interestingly, nonalcoholic steatohepatitis has recently been linked to iron-deficiency anemia (53–55).
In our studies, treatment of cells with the iron chelator DFO, which is known to rapidly result in strong loss of cytosolic and mitochondrial aconitase activities (19), caused a robust accumulation of cytoplasmic lipid droplets. Whereas the effect of DFO in curbing cellular iron availability in our in vitro studies was probably stronger and more rapid than any living tissue could experience, it suggests that lipid accumulation due to iron deficiency in animals could occur through a similar mechanism by causing loss of activity of aconitase enzymes. Notably, inactivation of aconitase by mitochondrial reactive oxygen species resulted in elevated citrate and lipid droplet formation in an in vitro model of fructose-induced nonalcoholic fatty liver disease (56), whereas elevated oxidative stress in Sod1−/− primary hepatocytes also triggered lipid droplet formation (57). Significant elevations in citrate have also been reported in clear cell renal cell carcinoma (58), a tumor in which the defining histological feature is cytoplasmic lipid droplet accumulation (59). Thus, elucidation of the mechanisms of citrate and lipid droplet accumulation in nonadipose tissues during disease states may reveal important insights into the pathogenesis of a significant number of poorly understood diseases.
Experimental procedures
Quantitative real-time PCR
Quantitative real-time PCR was performed using SYBR® Green (Applied Biosystems) according to the manufacturer's instructions, following reverse transcription of total RNA into cDNA (Applied Biosystems). Relative transcript abundance was calculated using the 2−ΔΔCt method (60), with glyceraldehyde-3-phosphate dehydrogenase as the internal control. Nontransformed 2−ΔΔCt values were analyzed by paired t tests to evaluate statistical significance relative to controls. The correct quantitative real-time PCR product sizes were verified by agarose gel electrophoresis, and melting curves were performed after every experiment.
Tissue culture
HEK293 Flp-In cells (Gibco) and HRCE cells (Lonza) were cultured in T-75 flasks (BD Falcon) in Dulbecco's modified Eagle's medium, 10% fetal bovine serum, supplemented with 25 mm d-glucose, 2 mm l-glutamine, without added pyruvate, in a humidified atmosphere of 5% CO2.
Cloning and site-directed mutagenesis
PCR primers were designed flanking the ISCU2 or emerald green GFP (emGFP) protein coding sequence and included additional sequences possessing a 5′ HindIII recognition sequence. The 3′ primer sequences contained Myc tag sequences and an XhoI cleavage site (Table S1). The amplified ISCU2 and emGFP ORFs as well as the pcDNA5/FRT/TO plasmid were digested with HindIII and XhoI enzymes, and the products were purified by gel electrophoresis and ligated into pcDNA5/FRT/TO, and plasmid insert identities were confirmed by Sanger sequencing. Site-directed mutagenesis of the plasmid harboring hISCU2 was performed using standard techniques, and subclones containing point mutations resulting in hISCU2-D71A and hISCU-C69S were confirmed by sequencing. PCR primer sequences are listed in Table S1. Transgene expression was induced by the addition of 2 μg/ml doxycycline to the growth medium, and cells were harvested and extracted in nondenaturing lysis buffer.
ISCU myopathy patient skeletal muscle biopsies
Vastus lateralis skeletal muscle biopsies from adults were obtained and prepared as described previously (7). Written informed consent was given by all individuals involved in the study in accordance with the Institutional Review Board of the University of Texas Southwestern Medical Center and the Texas Health Presbyterian Hospital of Dallas. All human study procedures were performed in accordance with the principles outlined by the Declaration of Helsinki.
Western blotting
SDS-PAGE and Western blotting were performed as described previously (61) using 1.5-mm 4–12% precast bis-Tris gels (Invitrogen). Rabbit polyclonal anti-ferrochelatase serum was a kind gift from Dr. Harry Dailey. Anti-IRP1, IRP2, PPAT, ISCU, NFU, and NFS1 rabbit polyclonal sera were raised against synthetic peptide fragments (19). SDH-B, SDH-A, NDUFS1, and complex IV subunit 4 and frataxin antibodies were from Mitosciences. Rabbit anti-Tom-20 was from Santa Cruz Biotechnology. Rabbit anti-lipoate was from Chemicon. Rabbit anti-total DLAT and DLST as well as p-AMPK, total AMPK, p-ACC, and total ACC antibodies were from Cell Signaling. Anti-total GCSH was from ProteinTech Group, Inc. Anti-NTHL1 was from R&D Systems, Inc. Rabbit anti-citrate synthase was from Sigma-Aldrich.
Electron microscopy
HEK293 cells were grown in standard culture medium on borosilicate glass coverslips; treated as indicated; fixed with 2% glutaraldehyde, 2% formaldehyde for 90 min in 0.1 m sodium cacodylate, pH 7.2; postfixed in 1% osmium tetroxide; and stained en bloc with 2% uranyl acetate overnight. Samples were dehydrated in increasing concentrations of ethanol and penetrated with epoxy resin subsequently polymerized at 65 °C for 60 h. Coverslips were removed by treatment with hydrofluoric acid, and blocks were cut out and remounted on a holder. Thin sections were cut parallel to the surface of the block, mounted on copper grids covered with Formvar/carbon film, and stained with uranyl acetate and lead acetate. Samples were analyzed with a FEI Tecnai T20 microscope at 120 kV, and images were recorded with a Gatan US1000 CCD camera.
Aconitase in-gel assay and electrophoretic mobility shift assay
Aconitase was assayed using a coupled assay following native PAGE separation, as described previously (19). IRP-IRE binding activity was determined by an electrophoretic mobility shift assay using a 32P-labeled ferritin IRE probe, as described previously (19).
NMR and GC-MS analysis of polar cell extracts
Tracer experiments were carried out in triplicate with 25 mm [13C6]glucose in Dulbecco's modified Eagle's medium containing 2 mm glutamine and 10% dialyzed fetal bovine serum, without added sodium pyruvate. At the end of the tracing period, cells were washed three times in cold PBS, quenched in cold acetonitrile, and extracted in acetonitrile/water/chloroform (2:1.5:1) (62). The upper polar metabolite fractions were frozen in several aliquots each and lyophilized overnight. One fraction of the resulting residue was reconstituted in 55 μl of a mixture of 50% H2O, 50% D2O containing 25 nmol of DSS-d6 and transferred to disposable 1.7-mm glass NMR tubes (Wilmad). NMR spectra were recorded at 14.1 T, 20 °C, on an Agilent DD2 spectrometer, using standardized parameters as described previously (63, 64). Metabolite derivatization for GC/MS analysis was performed with N-methyl-N-(tert-butyldimethylsilyl) trifluoroacetamide, and analyses were performed with a Thermo GC-ion trap MS system as described previously (65), and spectra were processed and analyzed using Thermo Xcalibur software.
Polar metabolite analysis by IC-UHR-FTMS
IC-UHR-FTMS analyses were performed as described previously (66, 67) to assess 13C incorporation into various metabolites. For metabolites quantified with purified standards, data are expressed as nmol/mg protein. For metabolites for which a purified standard was not available for quantification purposes, compounds were identified by their exact mass, and data are expressed as ion intensities normalized to the internal standard (DSS-d6).
NMR analysis of lipids
A 1:1 mixture of chloroform and methanol containing 1 mm butylated hydroxytoluene was added to the lower nonpolar fractions obtained from the extracts described above, and the mixtures were then dried in an Eppendorf SpeedVac (62). The resulting lipid residues were dissolved in 210 μl of methanol-d4, vortexed vigorously, and centrifuged at 3000 × g for 5 min, and the 200 μl of supernatant was transferred to 3-mm methanol susceptibility–matched Shigemi NMR tubes. 1H NMR spectra were recorded with an acquisition time of 2 s and a relaxation delay of 3 s with low-power irradiation to saturate the residual HOD resonance. 1H-{13C} HSQC spectra were recorded with an acquisition time of 0.2 s and a relaxation delay of 1.8 s, with adiabatic decoupling. TOCSY spectra were recorded with acquisition times of 1.0 s in t2 and 0.043 s in t1 using a spin lock strength of 8 kHz for a duration of 50 ms. 1D spectra were apodized using an unshifted Gaussian function with 1-Hz line broadening exponential and one zero filling. The TOCSY spectra were similarly apodized, with one zero filling in each dimension and one linear prediction in t1. 1H spectra were referenced to the methanol proton resonance at 3.32 ppm, whereas 1H-13C HSQC NMR spectra were referenced to the natural abundance 1H-13C butylated hydroxytoluene tert-butyl resonance at 1.40 ppm. The satellite positions in the glycerol and fatty acyl chains were verified by the TOCSY experiment, and enrichments were determined by volume integration (68) for a pair of 2D TOCSY samples. A parametric unpaired Welch's t test was used to compare the control and ISCUD71A samples. 1D HSQC experiments were used to estimate the relative 13C content of different lipid functional group positions in all of the extracts. Peaks corresponding to the terminal ω-methyl resonance (0.90 ppm), the large saturated acyl methylene (e.g. C5–7,12–16) resonance (1.29 ppm), the 2- and 3-methylene resonances of acyl chains (2.33 and 1.60 ppm), the glycerol resonances (5.24, 4.45, 4.43, 4.17, and 4.00 ppm), cholesterol methyl groups (0.73 and 1.03 ppm), the unsaturated C=C double bond (5.35 ppm) and the adjacent vicinal protons (2.04 ppm), and the natural abundance choline methyl groups (3.23 ppm) were integrated and normalized to the solvent methanol 1H impurity resonance (3.31 ppm). Normalized peak areas obtained for ISCU2D71A samples were divided by the values obtained for the empty vector samples and expressed as a percentage of control.
Analysis of cell proliferation
For proliferating cells, the expected enrichment assuming constant lipid content per cell (cellular homeostasis) would be determined by the number of cell divisions that occurred after the cells were labeled with tracer. For one division, the enrichment would be expected to be about 50%. A higher enrichment would imply that additional synthesis and turnover occurred in excess of that needed to maintain homeostasis. Relative 13C enrichment of cellular lipids in the [13C6]glucose tracer experiment was calculated assuming complete incorporation of glucose into newly formed lipids and using the number of population doublings that occurred during the experiment, as measured by live-cell imaging using an Incucyte FLRTM instrument in phase-contrast mode with the confluence overlay application.
BODIPY staining and fluorescent microscopy
HEK293 cells were cultured in 4-well borosilicate chambers and imaged with an EVOS FL inverted fluorescence microscope (Life Technologies). Briefly, cells were incubated in treatment media for 48 h, after which a mixture of Live Cell Imaging Solution (Life Technologies) was added to the cultures to allow for a final concentration of 1 drop/ml NucBlue DAPI live-cell stain and a 1:1000 dilution of freshly prepared and filtered 1 mg/ml BODIPY 493/503 solution prepared in pure ethanol (Molecular Probes). The cells were returned to the incubator for 10 min, and then the staining solution was removed and replaced with fresh Live Cell Imaging Solution, and the coverslips were imaged at ×400 in DAPI (10% illumination and 60-ms exposure time) and GFP (60% illumination and 250-ms exposure time) channels.
Western blotting densitometry
Densitometry was performed using Image Studio LiteTM version 5.0 software configured for median background subtraction. Total protein loading was assessed by Ponceau S staining immediately following the electrophoretic transfer of the proteins to nitrocellulose membranes and quantified by performing densitometry on the stained proteins present in the 30–70-kDa region of the membrane. Western blotting band intensities were normalized to the relative amount of quantified total protein and are presented as arbitrary density units.
Statistical analyses
Unless otherwise noted, a two-tailed Student's t test was applied to assess differences between experimental groups, with equal variance assumed between groups. Sample sizes of experimental groups were chosen based on the ability to observe biologically relevant differences.
Author contributions
D.R.C. and T.A.R. conceptualization; D.R.C., A.N.L., and Y.Y. data curation; D.R.C., N.M., A.N.L., and T.W.M.F. formal analysis; D.R.C., N.M., M.J., and Y.Y. investigation; D.R.C., N.M., A.N.L., M.J., R.M.H., and T.W.M.F. methodology; D.R.C., N.M., A.N.L., and T.A.R. writing-original draft; D.R.C., T.W.M.F., M.L., and T.A.R. project administration; D.R.C., N.M., A.N.L., T.W.M.F., M.L., and T.A.R. writing-review and editing; N.M. validation; A.N.L., R.M.H., R.G.H., T.W.M.F., M.L., and T.A.R. resources; A.N.L., R.M.H., T.W.M.F., M.L., and T.A.R. supervision; A.N.L., R.M.H., R.G.H., T.W.M.F., M.L., and T.A.R. funding acquisition; R.M.H. software.
Supplementary Material
Acknowledgments
We thank Drs. Marc Warmoes, Qiushi Sun, Teresa Cassel, and Manik Ghosh for technical expertise and Hiroshi Nakai, Thanemoji Natarajan, and Wing-Hang Tong for providing ideas and suggestions that greatly improved the quality of this work. NMR spectra were recorded at the Center for Environmental Systems Biochemistry, University of Kentucky, supported in part by NCI, National Institutes of Health, Cancer Center Support Grant P30 CA177558.
This work was supported by the NICHD, National Institutes of Health (NIH), Intramural Research Program and the NCI/NIH Center for Cancer Research, NIAMS/NIH Grant R01 AR050597, NIDDK/NIH Grant 1U24DK097215-01A1, and NIEHS/NIH Grant 3R01ES022191-04S1. The authors declare that they have no conflicts of interest with the contents of this article. The content is solely the responsibility of the authors and does not necessarily represent the official views of the National Institutes of Health.
This article was selected as one of our Editors' Picks.
This article contains Table S1 and Figs. S1–S6.
- IRE
- iron-responsive element
- HSQC
- heteronuclear single quantum coherence
- IC
- ion chromatography
- UHR
- ultra-high-resolution
- FTMS
- Fourier transform mass spectrometry
- TOCSY
- total correlation spectroscopy
- BODIPY
- 4,4-difluoro-1,3,5,7,8-pentamethyl-4-bora-3a,4a-diaza-s-indacene
- DSS-d6
- deuterated 4,4-dimethyl-4-silapentane-1-sulfonic acid
- DAPI
- 4′,6-diamidino-2-phenylindole
- FECH
- ferrochelatase
- PPAT
- phosphoribosylpyrophosphate amidotransferase
- NTHL1
- nuclear endonuclease III-like protein 1
- SDH
- succinate dehydrogenase
- LIAS
- lipoic acid synthase
- GCSH
- glycine cleavage system H
- TCA
- tricarboxylic acid
- PFK-1
- phosphofructokinase-1
- AXP
- adenosine mono-, di-, and tri-phosphate
- ACC
- acetyl-CoA carboxylase
- DFO
- desferrioxamine
- HRCE
- human renal cortical epithelial
- bis-Tris
- 2-[bis(2-hydroxyethyl)amino]-2-(hydroxymethyl)propane-1,3-diol
- p-
- phosphorylated.
References
- 1. Rouault T. A. (2015) Mammalian iron-sulphur proteins: novel insights into biogenesis and function. Nat. Rev. Mol. Cell Biol. 16, 45–55 10.1038/nrm3909 [DOI] [PubMed] [Google Scholar]
- 2. Rudolf J., Makrantoni V., Ingledew W. J., Stark M. J., and White M. F. (2006) The DNA repair helicases XPD and FancJ have essential iron-sulfur domains. Mol. Cell 23, 801–808 10.1016/j.molcel.2006.07.019 [DOI] [PubMed] [Google Scholar]
- 3. Boal A. K., Yavin E., and Barton J. K. (2007) DNA repair glycosylases with a [4Fe-4S] cluster: a redox cofactor for DNA-mediated charge transport? J. Inorg Biochem. 101, 1913–1921 10.1016/j.jinorgbio.2007.05.001 [DOI] [PMC free article] [PubMed] [Google Scholar]
- 4. Netz D. J., Stith C. M., Stumpfig M., Köpf G., Vogel D., Genau H. M., Stodola J. L., Lill R., Burgers P. M., and Pierik A. J. (2011) Eukaryotic DNA polymerases require an iron-sulfur cluster for the formation of active complexes. Nat. Chem. Biol. 8, 125–132 [DOI] [PMC free article] [PubMed] [Google Scholar]
- 5. Fu W., Jack R. F., Morgan T. V., Dean D. R., and Johnson M. K. (1994) nifU gene product from Azotobacter vinelandii is a homodimer that contains two identical [2Fe-2S] clusters. Biochemistry 33, 13455–13463 10.1021/bi00249a034 [DOI] [PubMed] [Google Scholar]
- 6. Zheng L., Cash V. L., Flint D. H., and Dean D. R. (1998) Assembly of iron-sulfur clusters: identification of an iscSUA-hscBA-fdx gene cluster from Azotobacter vinelandii. J. Biol. Chem. 273, 13264–13272 10.1074/jbc.273.21.13264 [DOI] [PubMed] [Google Scholar]
- 7. Mochel F., Knight M. A., Tong W. H., Hernandez D., Ayyad K., Taivassalo T., Andersen P. M., Singleton A., Rouault T. A., Fischbeck K. H., and Haller R. G. (2008) Splice mutation in the iron-sulfur cluster scaffold protein ISCU causes myopathy with exercise intolerance. Am. J. Hum. Genet. 82, 652–660 10.1016/j.ajhg.2007.12.012 [DOI] [PMC free article] [PubMed] [Google Scholar]
- 8. Olsson A., Lind L., Thornell L. E., and Holmberg M. (2008) Myopathy with lactic acidosis is linked to chromosome 12q23.3–24.11 and caused by an intron mutation in the ISCU gene resulting in a splicing defect. Hum. Mol. Genet. 17, 1666–1672 10.1093/hmg/ddn057 [DOI] [PubMed] [Google Scholar]
- 9. Maio N., and Rouault T. A. (2015) Iron-sulfur cluster biogenesis in mammalian cells: new insights into the molecular mechanisms of cluster delivery. Biochim. Biophys. Acta 1853, 1493–1512 10.1016/j.bbamcr.2014.09.009 [DOI] [PMC free article] [PubMed] [Google Scholar]
- 10. Kim R., Saxena S., Gordon D. M., Pain D., and Dancis A. (2001) J-domain protein, Jac1p, of yeast mitochondria required for iron homeostasis and activity of Fe-S cluster proteins. J. Biol. Chem. 276, 17524–17532 10.1074/jbc.M010695200 [DOI] [PubMed] [Google Scholar]
- 11. Uhrigshardt H., Singh A., Kovtunovych G., Ghosh M., and Rouault T. A. (2010) Characterization of the human HSC20, an unusual DnaJ type III protein, involved in iron-sulfur cluster biogenesis. Hum. Mol. Genet. 19, 3816–3834 10.1093/hmg/ddq301 [DOI] [PMC free article] [PubMed] [Google Scholar]
- 12. Maio N., Singh A., Uhrigshardt H., Saxena N., Tong W. H., and Rouault T. A. (2014) Cochaperone binding to LYR motifs confers specificity of iron sulfur cluster delivery. Cell Metab. 19, 445–457 10.1016/j.cmet.2014.01.015 [DOI] [PMC free article] [PubMed] [Google Scholar]
- 13. Yuvaniyama P., Agar J. N., Cash V. L., Johnson M. K., and Dean D. R. (2000) NifS-directed assembly of a transient [2Fe-2S] cluster within the NifU protein. Proc. Natl. Acad. Sci. U.S.A. 97, 599–604 10.1073/pnas.97.2.599 [DOI] [PMC free article] [PubMed] [Google Scholar]
- 14. Raulfs E. C., O'Carroll I. P., Dos Santos P. C., Unciuleac M. C., and Dean D. R. (2008) In vivo iron-sulfur cluster formation. Proc. Natl. Acad. Sci. U.S.A. 105, 8591–8596 10.1073/pnas.0803173105 [DOI] [PMC free article] [PubMed] [Google Scholar]
- 15. Marinoni E. N., de Oliveira J. S., Nicolet Y., Raulfs E. C., Amara P., Dean D. R., and Fontecilla-Camps J. C. (2012) (IscS-IscU)2 complex structures provide insights into Fe2S2 biogenesis and transfer. Angew. Chem. Int. Ed. Engl. 51, 5439–5442 10.1002/anie.201201708 [DOI] [PubMed] [Google Scholar]
- 16. Unciuleac M. C., Chandramouli K., Naik S., Mayer S., Huynh B. H., Johnson M. K., and Dean D. R. (2007) In vitro activation of apo-aconitase using a [4Fe-4S] cluster-loaded form of the IscU [Fe-S] cluster scaffolding protein. Biochemistry 46, 6812–6821 10.1021/bi6026665 [DOI] [PubMed] [Google Scholar]
- 17. Gerber J., Neumann K., Prohl C., Mühlenhoff U., and Lill R. (2004) The yeast scaffold proteins Isu1p and Isu2p are required inside mitochondria for maturation of cytosolic Fe/S proteins. Mol. Cell. Biol. 24, 4848–4857 10.1128/MCB.24.11.4848-4857.2004 [DOI] [PMC free article] [PubMed] [Google Scholar]
- 18. Nordin A., Larsson E., Thornell L. E., and Holmberg M. (2011) Tissue-specific splicing of ISCU results in a skeletal muscle phenotype in myopathy with lactic acidosis, while complete loss of ISCU results in early embryonic death in mice. Hum. Genet. 129, 371–378 10.1007/s00439-010-0931-3 [DOI] [PubMed] [Google Scholar]
- 19. Tong W. H., and Rouault T. A. (2006) Functions of mitochondrial ISCU and cytosolic ISCU in mammalian iron-sulfur cluster biogenesis and iron homeostasis. Cell Metab. 3, 199–210 10.1016/j.cmet.2006.02.003 [DOI] [PubMed] [Google Scholar]
- 20. Crooks D. R., Jeong S. Y., Tong W. H., Ghosh M. C., Olivierre H., Haller R. G., and Rouault T. A. (2012) Tissue specificity of a human mitochondrial disease: differentiation-enhanced mis-splicing of the Fe-S scaffold gene ISCU renders patient cells more sensitive to oxidative stress in ISCU myopathy. J. Biol. Chem. 287, 40119–40130 10.1074/jbc.M112.418889 [DOI] [PMC free article] [PubMed] [Google Scholar]
- 21. Crooks D. R., Natarajan T. G., Jeong S. Y., Chen C., Park S. Y., Huang H., Ghosh M. C., Tong W. H., Haller R. G., Wu C., and Rouault T. A. (2014) Elevated FGF21 secretion, PGC-1α and ketogenic enzyme expression are hallmarks of iron-sulfur cluster depletion in human skeletal muscle. Hum. Mol. Genet. 23, 24–39 10.1093/hmg/ddt393 [DOI] [PMC free article] [PubMed] [Google Scholar]
- 22. Walther T. C., and Farese R. V. Jr. (2012) Lipid droplets and cellular lipid metabolism. Annu. Rev. Biochem. 81, 687–714 10.1146/annurev-biochem-061009-102430 [DOI] [PMC free article] [PubMed] [Google Scholar]
- 23. Li K., Besse E. K., Ha D., Kovtunovych G., and Rouault T. A. (2008) Iron-dependent regulation of frataxin expression: implications for treatment of Friedreich ataxia. Hum. Mol. Genet. 17, 2265–2273 10.1093/hmg/ddn127 [DOI] [PMC free article] [PubMed] [Google Scholar]
- 24. Rouault T. A. (2006) The role of iron regulatory proteins in mammalian iron homeostasis and disease. Nat. Chem. Biol. 2, 406–414 10.1038/nchembio807 [DOI] [PubMed] [Google Scholar]
- 25. Salahudeen A. A., Thompson J. W., Ruiz J. C., Ma H. W., Kinch L. N., Li Q., Grishin N. V., and Bruick R. K. (2009) An E3 ligase possessing an iron-responsive hemerythrin domain is a regulator of iron homeostasis. Science 326, 722–726 10.1126/science.1176326 [DOI] [PMC free article] [PubMed] [Google Scholar]
- 26. Vashisht A. A., Zumbrennen K. B., Huang X., Powers D. N., Durazo A., Sun D., Bhaskaran N., Persson A., Uhlen M., Sangfelt O., Spruck C., Leibold E. A., and Wohlschlegel J. A. (2009) Control of iron homeostasis by an iron-regulated ubiquitin ligase. Science 326, 718–721 10.1126/science.1176333 [DOI] [PMC free article] [PubMed] [Google Scholar]
- 27. Stehling O., Mascarenhas J., Vashisht A. A., Sheftel A. D., Niggemeyer B., Rösser R., Pierik A. J., Wohlschlegel J. A., and Lill R. (2013) Human CIA2A-FAM96A and CIA2B-FAM96B integrate iron homeostasis and maturation of different subsets of cytosolic-nuclear iron-sulfur proteins. Cell Metab. 18, 187–198 10.1016/j.cmet.2013.06.015 [DOI] [PMC free article] [PubMed] [Google Scholar]
- 28. Kim K. S., Maio N., Singh A., and Rouault T. A. (2018) Cytosolic HSC20 integrates de novo iron-sulfur cluster biogenesis with the CIAO1-mediated transfer to recipients. Hum. Mol. Genet. 27, 837–852 10.1093/hmg/ddy004 [DOI] [PMC free article] [PubMed] [Google Scholar]
- 29. Mayr J. A., Feichtinger R. G., Tort F., Ribes A., and Sperl W. (2014) Lipoic acid biosynthesis defects. J. Inherit. Metab. Dis. 37, 553–563 10.1007/s10545-014-9705-8 [DOI] [PubMed] [Google Scholar]
- 30. Witkowski A., Joshi A. K., and Smith S. (2007) Coupling of the de novo fatty acid biosynthesis and lipoylation pathways in mammalian mitochondria. J. Biol. Chem. 282, 14178–14185 10.1074/jbc.M701486200 [DOI] [PubMed] [Google Scholar]
- 31. Ollagnier-de Choudens S., and Fontecave M. (1999) The lipoate synthase from Escherichia coli is an iron-sulfur protein. FEBS Lett. 453, 25–28 10.1016/S0014-5793(99)00694-8 [DOI] [PubMed] [Google Scholar]
- 32. Landgraf B. J., McCarthy E. L., and Booker S. J. (2016) Radical S-adenosylmethionine enzymes in human health and disease. Annu. Rev. Biochem. 85, 485–514 10.1146/annurev-biochem-060713-035504 [DOI] [PubMed] [Google Scholar]
- 33. Parmeggiani A., and Bowman R. H. (1963) Regulation of phosphofructokinase activity by citrate in normal and diabetic muscle. Biochem. Biophys. Res. Commun. 12, 268–273 10.1016/0006-291X(63)90294-8 [DOI] [PubMed] [Google Scholar]
- 34. Vora S., Oskam R., and Staal G. E. (1985) Isoenzymes of phosphofructokinase in the rat: demonstration of the three non-identical subunits by biochemical, immunochemical and kinetic studies. Biochem. J. 229, 333–341 10.1042/bj2290333 [DOI] [PMC free article] [PubMed] [Google Scholar]
- 35. Garland P. B., Randle P. J., and Newsholme E. A. (1963) Citrate as an intermediary in the inhibition of phosphofructokinase in rat heart muscle by fatty acids, ketone bodies, pyruvate, diabetes, and starvation. Nature 200, 169–170 10.1038/200169a0 [DOI] [PubMed] [Google Scholar]
- 36. Yao C. H., Fowle-Grider R., Mahieu N. G., Liu G. Y., Chen Y. J., Wang R., Singh M., Potter G. S., Gross R. W., Schaefer J., Johnson S. L., and Patti G. J. (2016) Exogenous fatty acids are the preferred source of membrane lipids in proliferating fibroblasts. Cell Chem. Biol. 23, 483–493 10.1016/j.chembiol.2016.03.007 [DOI] [PMC free article] [PubMed] [Google Scholar]
- 37. Mackenzie C. G., Mackenzie J. B., Reiss O. K., and Wisneski J. A. (1970) Identification of albumin-bound fatty acids as the major factor in serum-induced lipid accumulation by cultured cells. J. Lipid Res. 11, 571–582 [PubMed] [Google Scholar]
- 38. Hue L., and Taegtmeyer H. (2009) The Randle cycle revisited: a new head for an old hat. Am. J. Physiol. Endocrinol. Metab. 297, E578–E591 10.1152/ajpendo.00093.2009 [DOI] [PMC free article] [PubMed] [Google Scholar]
- 39. Yi W., Clark P. M., Mason D. E., Keenan M. C., Hill C., Goddard W. A. 3rd, Peters E. C., Driggers E. M., and Hsieh-Wilson L. C. (2012) Phosphofructokinase 1 glycosylation regulates cell growth and metabolism. Science 337, 975–980 10.1126/science.1222278 [DOI] [PMC free article] [PubMed] [Google Scholar]
- 40. Gregolin C., Ryder E., Warner R. C., Kleinschmidt A. K., and Lane M. D. (1966) Liver acetyl CoA carboxylase: the dissociation-reassociation process and its relation to catalytic activity. Proc. Natl. Acad. Sci. U.S.A. 56, 1751–1758 10.1073/pnas.56.6.1751 [DOI] [PMC free article] [PubMed] [Google Scholar]
- 41. Kim K. H., López-Casillas F., Bai D. H., Luo X., and Pape M. E. (1989) Role of reversible phosphorylation of acetyl-CoA carboxylase in long-chain fatty acid synthesis. FASEB J. 3, 2250–2256 10.1096/fasebj.3.11.2570725 [DOI] [PubMed] [Google Scholar]
- 42. Tort F., Ferrer-Cortes X., and Ribes A. (2016) Differential diagnosis of lipoic acid synthesis defects. J. Inherit. Metab. Dis. 39, 781–793 10.1007/s10545-016-9975-4 [DOI] [PubMed] [Google Scholar]
- 43. Van Vranken J. G., Jeong M. Y., Wei P., Chen Y. C., Gygi S. P., Winge D. R., and Rutter J. (2016) The mitochondrial acyl carrier protein (ACP) coordinates mitochondrial fatty acid synthesis with iron sulfur cluster biogenesis. Elife 5, e17828 [DOI] [PMC free article] [PubMed] [Google Scholar]
- 44. Cai K., Frederick R. O., Tonelli M., and Markley J. L. (2017) Mitochondrial cysteine desulfurase and ISD11 coexpressed in Escherichia coli yield complex containing acyl carrier protein. ACS Chem. Biol. 12, 918–921 [DOI] [PMC free article] [PubMed] [Google Scholar]
- 45. Unger R. H., Clark G. O., Scherer P. E., and Orci L. (2010) Lipid homeostasis, lipotoxicity and the metabolic syndrome. Biochim. Biophys. Acta 1801, 209–214 10.1016/j.bbalip.2009.10.006 [DOI] [PubMed] [Google Scholar]
- 46. Krahmer N., Farese R. V. Jr, and Walther T. C. (2013) Balancing the fat: lipid droplets and human disease. EMBO Mol. Med. 5, 973–983 10.1002/emmm.201100671 [DOI] [PMC free article] [PubMed] [Google Scholar]
- 47. Carr R. M., Oranu A., and Khungar V. (2016) Nonalcoholic fatty liver disease: pathophysiology and management. Gastroenterol. Clin. North Am. 45, 639–652 10.1016/j.gtc.2016.07.003 [DOI] [PMC free article] [PubMed] [Google Scholar]
- 48. Puccio H., Simon D., Cossée M., Criqui-Filipe P., Tiziano F., Melki J., Hindelang C., Matyas R., Rustin P., and Koenig M. (2001) Mouse models for Friedreich ataxia exhibit cardiomyopathy, sensory nerve defect and Fe-S enzyme deficiency followed by intramitochondrial iron deposits. Nat. Genet. 27, 181–186 10.1038/84818 [DOI] [PubMed] [Google Scholar]
- 49. Obis È., Irazusta V., Sanchís D., Ros J., and Tamarit J. (2014) Frataxin deficiency in neonatal rat ventricular myocytes targets mitochondria and lipid metabolism. Free Radic. Biol. Med. 73, 21–33 10.1016/j.freeradbiomed.2014.04.016 [DOI] [PubMed] [Google Scholar]
- 50. Martelli A., Friedman L. S., Reutenauer L., Messaddeq N., Perlman S. L., Lynch D. R., Fedosov K., Schulz J. B., Pandolfo M., and Puccio H. (2012) Clinical data and characterization of the liver conditional mouse model exclude neoplasia as a non-neurological manifestation associated with Friedreich's ataxia. Dis. Model. Mech. 5, 860–869 10.1242/dmm.009829 [DOI] [PMC free article] [PubMed] [Google Scholar]
- 51. Navarro J. A., Ohmann E., Sanchez D., Botella J. A., Liebisch G., Moltó M. D., Ganfornina M. D., Schmitz G., and Schneuwly S. (2010) Altered lipid metabolism in a Drosophila model of Friedreich's ataxia. Hum. Mol. Genet. 19, 2828–2840 10.1093/hmg/ddq183 [DOI] [PMC free article] [PubMed] [Google Scholar]
- 52. Spengler E. K., and Loomba R. (2015) Recommendations for diagnosis, referral for liver biopsy, and treatment of nonalcoholic fatty liver disease and nonalcoholic steatohepatitis. Mayo Clin. Proc. 90, 1233–1246 10.1016/j.mayocp.2015.06.013 [DOI] [PMC free article] [PubMed] [Google Scholar]
- 53. Lee S. M., Nguyen D., Anand M., Kant R., Köhncke C., Lisewski U., Roepke T. K., Hu Z., and Abbott G. W. (2016) Kcne2 deletion causes early-onset nonalcoholic fatty liver disease via iron deficiency anemia. Sci. Rep. 6, 23118 10.1038/srep23118 [DOI] [PMC free article] [PubMed] [Google Scholar]
- 54. Siddique A., Nelson J. E., Aouizerat B., Yeh M. M., Kowdley K. V., and NASH Clinical Research Network (2014) Iron deficiency in patients with nonalcoholic fatty liver disease is associated with obesity, female gender, and low serum hepcidin. Clin. Gastroenterol. Hepatol. 12, 1170–1178 10.1016/j.cgh.2013.11.017 [DOI] [PMC free article] [PubMed] [Google Scholar]
- 55. Ahmed U., Latham P. S., and Oates P. S. (2012) Interactions between hepatic iron and lipid metabolism with possible relevance to steatohepatitis. World J. Gastroenterol. 18, 4651–4658 10.3748/wjg.v18.i34.4651 [DOI] [PMC free article] [PubMed] [Google Scholar]
- 56. Lanaspa M. A., Sanchez-Lozada L. G., Choi Y. J., Cicerchi C., Kanbay M., Roncal-Jimenez C. A., Ishimoto T., Li N., Marek G., Duranay M., Schreiner G., Rodriguez-Iturbe B., Nakagawa T., Kang D. H., Sautin Y. Y., and Johnson R. J. (2012) Uric acid induces hepatic steatosis by generation of mitochondrial oxidative stress: potential role in fructose-dependent and -independent fatty liver. J. Biol. Chem. 287, 40732–40744 10.1074/jbc.M112.399899 [DOI] [PMC free article] [PubMed] [Google Scholar]
- 57. Lee J., Homma T., Kurahashi T., Kang E. S., and Fujii J. (2015) Oxidative stress triggers lipid droplet accumulation in primary cultured hepatocytes by activating fatty acid synthesis. Biochem. Biophys. Res. Commun. 464, 229–235 10.1016/j.bbrc.2015.06.121 [DOI] [PubMed] [Google Scholar]
- 58. Wettersten H. I., Hakimi A. A., Morin D., Bianchi C., Johnstone M. E., Donohoe D. R., Trott J. F., Aboud O. A., Stirdivant S., Neri B., Wolfert R., Stewart B., Perego R., Hsieh J. J., and Weiss R. H. (2015) Grade-dependent metabolic reprogramming in kidney cancer revealed by combined proteomics and metabolomics analysis. Cancer Res. 75, 2541–2552 10.1158/0008-5472.CAN-14-1703 [DOI] [PMC free article] [PubMed] [Google Scholar]
- 59. Krishnan B., and Truong L. D. (2002) Renal epithelial neoplasms: the diagnostic implications of electron microscopic study in 55 cases. Hum. Pathol. 33, 68–79 10.1053/hupa.2002.30210 [DOI] [PubMed] [Google Scholar]
- 60. Livak K. J., and Schmittgen T. D. (2001) Analysis of relative gene expression data using real-time quantitative PCR and the 2(−ΔΔC(T)) method. Methods 25, 402–408 10.1006/meth.2001.1262 [DOI] [PubMed] [Google Scholar]
- 61. Crooks D. R., Ghosh M. C., Braun-Sommargren M., Rouault T. A., and Smith D. R. (2007) Manganese targets m-aconitase and activates iron regulatory protein 2 in AF5 GABAergic cells. J. Neurosci. Res. 85, 1797–1809 10.1002/jnr.21321 [DOI] [PubMed] [Google Scholar]
- 62. Higashi R. M., Fan T. W., Lorkiewicz P. K., Moseley H. N., and Lane A. N. (2014) Stable isotope-labeled tracers for metabolic pathway elucidation by GC-MS and FT-MS. Methods Mol. Biol. 1198, 147–167 10.1007/978-1-4939-1258-2_11 [DOI] [PMC free article] [PubMed] [Google Scholar]
- 63. Fan T. W., and Lane A. N. (2011) NMR-based stable isotope resolved metabolomics in systems biochemistry. J. Biomol. NMR 49, 267–280 10.1007/s10858-011-9484-6 [DOI] [PMC free article] [PubMed] [Google Scholar]
- 64. Fan T. W., Lane A. N., and Higashi R. M. (2016) Stable isotope resolved metabolomics studies in ex vivo tissue slices. Bio Protoc. 6, e1730 [DOI] [PMC free article] [PubMed] [Google Scholar]
- 65. Sellers K., Fox M. P., Bousamra M. 2nd, Slone S. P., Higashi R. M., Miller D. M., Wang Y., Yan J., Yuneva M. O., Deshpande R., Lane A. N., and Fan T. W. (2015) Pyruvate carboxylase is critical for non-small-cell lung cancer proliferation. J. Clin. Invest. 125, 687–698 10.1172/JCI72873 [DOI] [PMC free article] [PubMed] [Google Scholar]
- 66. Sun R. C., Fan T. W., Deng P., Higashi R. M., Lane A. N., Le A. T., Scott T. L., Sun Q., Warmoes M. O., and Yang Y. (2017) Noninvasive liquid diet delivery of stable isotopes into mouse models for deep metabolic network tracing. Nat. Commun. 8, 1646 10.1038/s41467-017-01518-z [DOI] [PMC free article] [PubMed] [Google Scholar]
- 67. Fan T. W., Warmoes M. O., Sun Q., Song H., Turchan-Cholewo J., Martin J. T., Mahan A., Higashi R. M., and Lane A. N. (2016) Distinctly perturbed metabolic networks underlie differential tumor tissue damages induced by immune modulator β-glucan in a two-case ex vivo non-small-cell lung cancer study. Cold Spring Harb. Mol. Case Stud. 2, a000893 10.1101/mcs.a000893 [DOI] [PMC free article] [PubMed] [Google Scholar]
- 68. Lane A. N., Fan T. W., Xie Z., Moseley H. N., and Higashi R. M. (2009) Isotopomer analysis of lipid biosynthesis by high resolution mass spectrometry and NMR. Anal. Chim. Acta 651, 201–208 10.1016/j.aca.2009.08.032 [DOI] [PMC free article] [PubMed] [Google Scholar]
Associated Data
This section collects any data citations, data availability statements, or supplementary materials included in this article.