ABSTRACT
Fosfomycin is the only expoxide antimicrobial and is currently under development in the United States as an intravenously administered product. We were interested in identifying the exposure indices most closely linked to its ability to kill bacterial cells and to suppress amplification of less susceptible subpopulations. We employed the hollow fiber infection model for this investigation and studied wild-type strain Pseudomonas aeruginosa PAO1. Because of anticipated rapid resistance emergence, we shortened the study duration to 24 h but sampled the system more intensively. Doses of 12 and 18 g/day and schedules of daily administration, administration every 8 h, and administration by continuous infusion for each daily dose were studied. We measured fosfomycin concentrations (by liquid chromatography-tandem mass spectrometry), the total bacterial burden, and the burden of less susceptible isolates. We applied a mathematical model to all the data simultaneously. There was a rapid emergence of resistance with all doses and schedules. Prior to resistance emergence, an initial kill of 2 to 3 log10(CFU/ml) was observed. The model demonstrated that the area under the concentration-time curve/MIC ratio was linked to total bacterial kill, while the time that the concentration remained above the MIC (or, equivalently, the minimum concentration/MIC ratio) was linked to resistance suppression. These findings were also seen in other investigations with Enterobacteriaceae (in vitro systems) and P. aeruginosa (murine system). We conclude that for serious infections with high bacterial burdens, fosfomycin may be of value as a new therapeutic and may be optimized by administering the agent as a continuous or prolonged infusion or by use of a short dosing interval. For indications such as ventilator-associated bacterial pneumonia, it may be prudent to administer fosfomycin as part of a combination regimen.
KEYWORDS: Pseudomonas aeruginosa, fosfomycin, hollow fiber infection model, pharmacodynamics
INTRODUCTION
We are in a crisis of resistance. New agents are requisite for addressing this problem. Fosfomycin, the only epoxide antibiotic, was discovered over 40 years ago. Currently, fosfomycin tromethamine is approved in the United States for the single-dose therapy of uncomplicated urinary tract infection. In much of the rest of the world, fosfomycin for intravenous administration is approved for many serious indications. Currently, fosfomycin for injection (Zolyd; Zavante Therapeutics) is being developed in the United States for therapy of serious infections.
Our group is interested in Pseudomonas aeruginosa, as this is a major problem pathogen. Specifically, we are also interested in the therapy of hospital-acquired bacterial pneumonia/ventilator-associated bacterial pneumonia (HABP/VABP). This process is characterized by a large bacterial burden, a high severity of infection, and a high mortality. Consequently, we felt it to be important to identify the dynamically linked exposure indices for fosfomycin for P. aeruginosa.
While linking the drug exposure profile to bacterial cell kill is important, we would contend that of equal importance is the linkage of the drug exposure profile to the activity of fosfomycin against less susceptible P. aeruginosa subpopulations with the goal of suppressing amplification of less susceptible populations (1, 2).
While animal models of infection provide important pharmacodynamic information, it needs to be recognized that murine pharmacokinetics may have an impact on the ability to robustly identify the linked index. Further, in the case of murine pneumonia, the overall bacterial burden is much smaller than that which would be desirable because of the size of the murine lung. Consequently, we decided to examine these issues in the hollow fiber infection model (HFIM).
RESULTS
Organism MIC and mutational frequency to resistance.
For this evaluation, we employed Pseudomonas aeruginosa PAO1. The broth microdilution fosfomycin MIC for this isolate was 64 mg/liter, and the agar dilution MIC was 32 mg/liter. The mutational frequency to resistance was 1/4.71 log10(CFU/ml) (1/51,286 CFU/ml) with a concentration at 3× the baseline MIC incorporated into the selecting agar.
Fosfomycin concentration-time profiles.
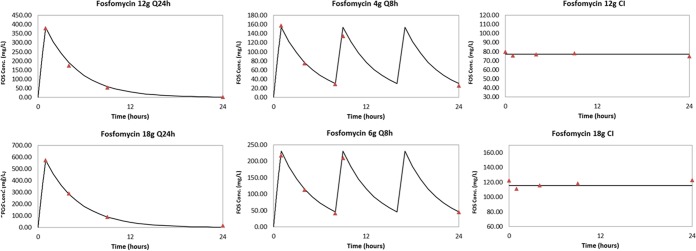
The desired concentration-time profiles were accurately attained. They are displayed in Fig. 1.
FIG 1.
Fosfomycin (FOS) concentration-time profiles for 12 g and 18 g per day with each daily dose administered once daily every 24 h [Q24h], every 8 h (Q8h), and by continuous infusion (CI) after a loading dose.
Pseudomonas aeruginosa bacterial kill and resistance emergence.
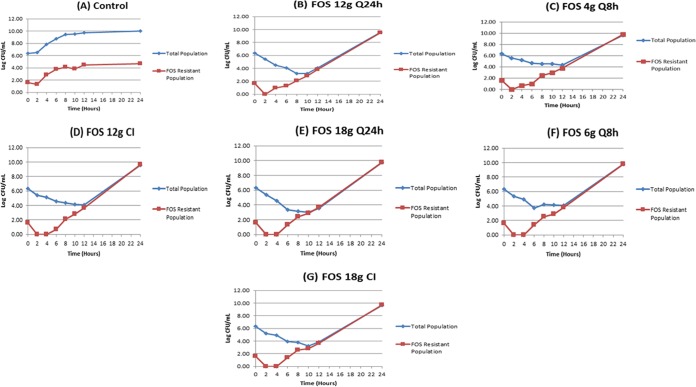
The impact of each of the regimens on the total population of P. aeruginosa and on the amplification of less susceptible, preexistent subpopulations is displayed in Fig. 2A to G.
FIG 2.
Bacterial cell kill and resistance emergence with different fractionated schedules of administration of 12 and 18 g of fosfomycin per day.
The initial bacterial inoculum was 6.34 log10(CFU/ml). At the baseline there were 1.63 log10(CFU/ml) less susceptible organisms in the population. The impact of fosfomycin pressure for all regimens is seen in Fig. 2B to G. All fosfomycin regimens rapidly selected for resistant isolates, irrespective of the dose or fractionation schedule. However, there were differences across doses and schedules of administration with regard to the time when the resistant subpopulation went above that at the baseline. In the 12-g-per-day group, administration every 24 h and every 8 h allowed an increase in the size of the resistant mutant population above that at the baseline to be seen at hour 4, while with the continuous infusion regimen, resistant mutants did not show up until hour 6. In all 18-g-per-day regimens, an increase in the size of the resistant mutant population above that seen at the baseline was seen at hour 6. This provides us with a hypothesis that resistance suppression may be linked to the time that concentration remains above the MIC (TMIC) or, equivalently, the minimum concentration (Cmin)/MIC ratio.
Modeling bacterial cell kill and resistance suppression.
We employed the model described in Materials and Methods and fit all the data simultaneously as a function of three system outputs (drug concentrations, total bacterial burden, and resistant bacterial burden). The mean and median parameter vectors and the standard deviation of the parameter values are displayed in Table 1.
TABLE 1.
Parameter values for the fosfomycin dose fractionation experimenta
| Parameter | Units | Mean value | Median value | SD |
|---|---|---|---|---|
| Vc | liters | 27.0 | 25.2 | 6.48 |
| CL | liters/h | 7.15 | 6.88 | 1.23 |
| Kg-s | h−1 | 0.918 | 0.926 | 0.381 |
| Kg-r | h−1 | 1.36 | 1.42 | 0.307 |
| Kk-s | h−1 | 2.15 | 2.14 | 0.183 |
| Kk-r | h−1 | 1.91 | 1.80 | 0.624 |
| C50-s | mg/liter | 62.4 | 58.3 | 32.1 |
| C50-r | mg/liter | 119.0 | 81.8 | 43.3 |
| Hs | 7.07 | 3.33 | 5.83 | |
| Hr | 14.5 | 19.8 | 7.08 | |
| POPMAX | CFU/ml | 2.37 × 10¹⁰ | 2.97 × 10¹⁰ | 9.98 × 10¹⁰ |
| IC_2 | CFU/ml | 2.02 × 10⁶ | 2.00 × 10⁶ | 3.07 × 10⁴ |
| IC_3 | CFU/ml | 28.3 | 37.4 | 13.6 |
Vc, volume of distribution of the central compartment; CL, clearance; Kg-s, growth rate of the susceptible population; Kg-r, growth rate of the resistant population; Kk-s, kill rate of the susceptible population; Kk-r, kill rate of the resistant population; C50-s, fosfomycin concentration at which the kill rate for the susceptible population was half maximal; C50-r, fosfomycin concentration at which the kill rate for the resistant population was half maximal; Hs and Hr, Hill constants for the susceptible and resistant populations, respectively; POPMAX, maximal total population burden; IC_2 and IC_3, the initial conditions for the total and resistant bacterial burdens, respectively.
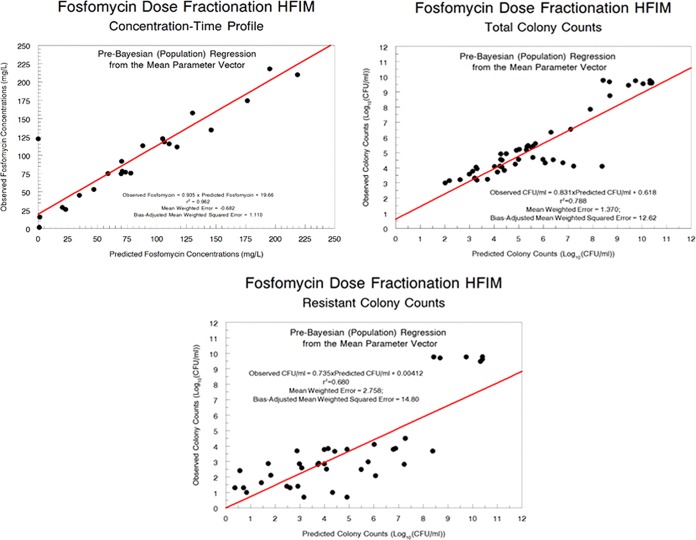
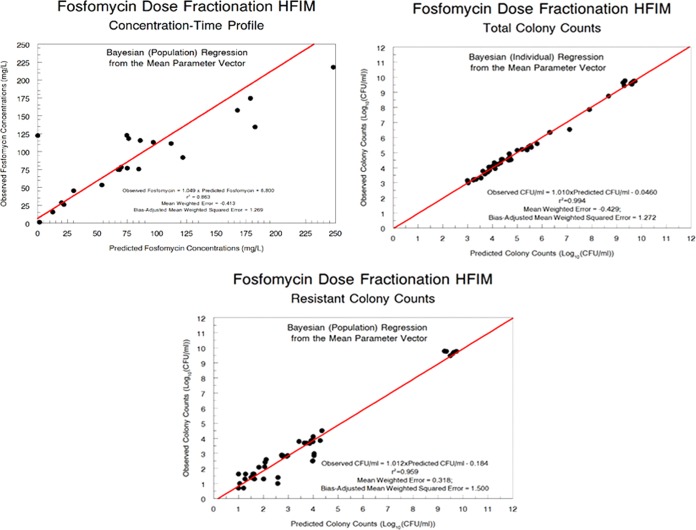
The fit of the model to the data was quite acceptable. The pre-Bayesian (population) predicted-observed plots and the measures of bias and imprecision are displayed in Fig. 3 for each output. The Bayesian (individual) predicted-observed plots and the measures of bias and imprecision are displayed in Fig. 4 for each output.
FIG 3.
Pre-Bayesian (population) predicted-observed plots for fosfomycin concentrations, total population bacterial burden, and resistant bacterial burden.
FIG 4.
Bayesian (individual) predicted-observed plots for fosfomycin concentrations, total population bacterial burden, and resistant bacterial burden.
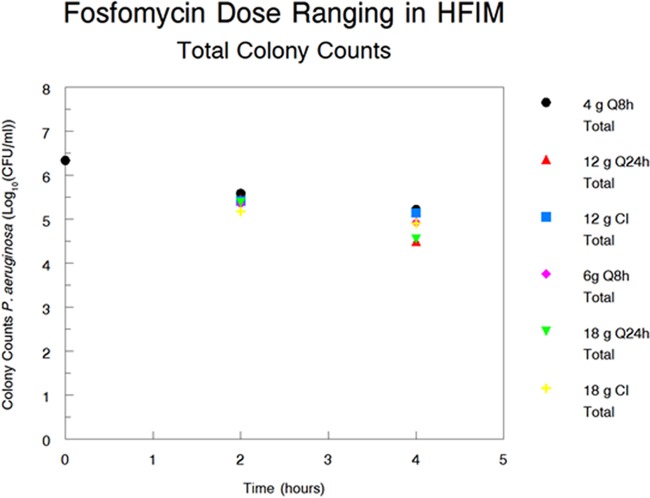
In order to understand the impact of the different administration schedules, it is important to examine the Bayesian kill rate constants for the susceptible and resistant populations by regimen. These are presented in Table 2. When examining the parameter values, it is important to compare values by administration schedule within dosing group (12 versus 18 g per day). There were only minor differences in the values for the maximal first-order kill rate constant for the susceptible bacterial population (Kkill-s) for each of the contrasts by schedule within each dosing group. This would indicate that for overall bacterial cell kill, the area under the concentration-time curve (AUC)/MIC ratio is the dynamically linked index. It is important to note that only data from hours 2 and 4 were examined. That is because at these time points, resistance emergence was either nonexistent or minimal, allowing us to dissociate cell kill from resistance amplification. In addition, when the raw colony counts are displayed by regimen in Fig. 5, we see the same story, in that there are minimal colony count differences, again implying that the AUC/MIC ratio is the driver for bacterial cell kill for fosfomycin.
TABLE 2.
Bayesian parameter estimates for kill rates for both sensitive and resistant populationsa
| Dosing regimen | Kkill-s (h−1) | Kkill-r (h−1) |
|---|---|---|
| 12 g q24h | 2.315 | 1.652 |
| 4 g q8h | 2.007 | 1.803 |
| 12 g CI | 1.991 | 3.290 |
| 18 g q24h | 2.406 | 1.690 |
| 6 g q8h | 2.322 | 1.831 |
| 18 g CI | 2.147 | 2.019 |
Kkill-s and Kkill-r, maximal first-order kill rate constants for the susceptible and resistant bacterial populations, respectively; q24h, every 24 h; q8h, every 8 h; CI, continuous infusion.
FIG 5.
Total colony counts of P. aeruginosa in the hollow fiber infection model at hours 0, 2, and 4 as a function of the dose fractionation regimen.
The story changes when resistance emergence is examined. Again, Table 2 shows the parameter values by schedule for maximal first-order kill rate constants for the resistant bacterial population (Kkill-r). Now, there is a clear-cut hierarchy, with continuous infusion giving the greater estimates, followed by a schedule of administration every 8 h, with the daily administration schedule providing the smallest estimates. This strongly links TMIC (or, equivalently, the Cmin/MIC ratio) as the dynamically linked index for resistance suppression. Nonetheless, it should be noted that no schedule of administration at either daily dose was able to counterselect resistance amplification.
DISCUSSION
Given the crisis of resistance, good patient care demands the rapid identification of new agents for the therapy of serious infections with nosocomial pathogens. Pseudomonas aeruginosa remains a difficult-to-treat organism. Drugs with a different mechanism of action may provide a better ability to treat these organisms, which are frequently multiresistant.
However, to identify optimal combination regimens, it is critical to identify the dynamically linked indices for both bacterial cell kill and suppression of emergence of resistance for each drug in the combination.
Fosfomycin was discovered over 40 years ago (3) and has been used extensively around the world for the therapy of serious bacterial infections. Ironically, the United States has available only the oral salt of fosfomycin, and the only indication for its use listed in the package insert is as single-dose therapy for uncomplicated urinary tract infection. Fosfomycin for injection (Zolyd) has entered development in the United States.
There have been three preclinical investigations of fosfomycin's pharmacodynamically linked indices (4–6). The first two were performed in the HFIM, while the last one employed a granulocytopenic murine thigh infection model. Both of the HFIM experiments examined only Enterobacteriaceae, whereas the murine model studied both Enterobacteriaceae and Pseudomonas aeruginosa. The HFIM experiments looked at resistance emergence, but the murine studies did not.
Our ultimate aim was to identify optimal combination chemotherapy regimens for serious infections with P. aeruginosa that include fosfomycin. In order to attain this end, we felt that we would need to delineate drivers for both bacterial cell kill and resistance suppression for fosfomycin alone.
Given the mutational frequency to resistance [4.71−1 log10(CFU/ml)], we felt that there would be a high probability of rapid and complete resistance emergence at the doses and schedules employed. Consequently, we decided to employ a short-term experiment but one that used relatively intensive sampling. We chose daily doses of 12 and 18 g, as 18 g is the highest dose being explored in U.S. clinical trials.
As expected, all regimens amplified the less susceptible subpopulation rapidly, and the resistant bacterial burden exceeded that at the baseline [1.63 log10(CFU/ml)] by 8 h. Of note, however, all regimens also achieved 2 to 3 log10(CFU/ml) kill early in that time frame. This degree of early bacterial cell kill may be important when fosfomycin is employed in a combination therapy regimen if the second drug can counterselect resistance amplification.
There was quite a good fit of the model to the data, with the Bayesian estimates providing regressions with slopes near 1.0, with small y intercepts and with r2 values exceeding 0.9 (which indicates that the model explained >90% of the overall variance). The model parameters also provided insight. The growth rate constants for the susceptible and resistant populations were not significantly different, likely indicating that the less susceptible organisms were biologically fit. The resistant subpopulation also had lower maximal kill rate constants and higher concentrations at which the kill rate was half maximal (C50s), indicating that the MIC of fosfomycin had shifted. In fact, when we checked multiple colonies from the resistance-selecting plates for each regimen, all MICs had shifted from a baseline broth microdilution MIC of 64 mg/liter to a minimum MIC of 512 mg/liter, with the vast majority of colonies having an MIC of >1,024 mg/liter. It is unlikely that fosfomycin resistance amplification can be counterselected by dosing of this agent as monotherapy in P. aeruginosa.
VanScoy et al. (5) studied 3 isolates of Escherichia coli in an in vitro infection model and were able to suppress resistance amplification with a simulated fosfomycin dose of 2 g every 6 h. The MIC by either broth microdilution or agar dilution, however, was either 0.5 or 1 mg/liter, respectively.
Lepak et al. (6) examined P. aeruginosa in a neutropenic murine thigh model. They attained quite good bacterial cell kill with isolates whose MIC values for fosfomycin were either 8.0 or 16.0 mg/liter. The authors did not look for less susceptible isolates in this evaluation. Also, the mutational frequency to resistance was not determined. Finally, murine infection models may be suboptimal, in some instances, for resistance evaluation because the total bacterial burden may be low and may not exceed the inverse of the mutational frequency to resistance.
For this study, when the Bayesian estimates of the maximal kill rate constants for the susceptible organisms were examined for each regimen (Table 2), the values were quite close for each of the total daily doses (12 versus 18 g per day), indicating that the AUC/MIC ratio is the pharmacodynamically linked driver for bacterial cell kill. Further, Fig. 5 shows the plots of the colony counts at hours 2 and 4 for each regimen. These times were chosen because the less susceptible population is either zero or below the value seen at the baseline, which minimizes the confounding between these endpoints. Here, the values of burden are virtually identical within each group, again indicating that the AUC/MIC ratio is most closely linked to bacterial cell kill.
This conclusion is supported by the findings presented in the paper by Lepak et al. (6), where this driver was identified for bacterial cell kill. Docobo-Pérez and colleagues (4) examined E. coli isolates in the HFIM and also identified the AUC/MIC ratio to be the pharmacodynamic driver for bacterial cell kill. On the basis of the totality of evidence, it is highly likely that the AUC/MIC ratio is the pharmacodynamic index most closely linked to bacterial cell kill.
The story changes when resistance suppression is the endpoint examined. In looking at the Bayesian maximal kill rate constants for the less susceptible population (Table 2), it is clear that for the two daily doses, the highest value for this kill rate constant is generated by continuous infusion, followed by administration every 8 h, with the lowest values being generated by once-daily administration. This strongly implies that TMIC (or, equivalently, the Cmin/MIC ratio) is the pharmacodynamic driver for resistance suppression in P. aeruginosa.
Again, this conclusion is supported by the findings presented in the paper of VanScoy et al. (5). The authors dubbed the critical time that the concentration remains above the threshold concentration as the time that the concentration remains above the resistance-inhibitory concentration (TRIC). We can infer that there is a different pharmacodynamic driver for resistance suppression and that instead of the AUC/MIC ratio we have a time-dependent driver for resistance suppression.
There are some limitations of the experiment and its analysis. The first is that it was performed in the hollow fiber infection model, and as such, it completely ignores the contribution of the immune system. This makes the findings conservative, but this does not have an impact on delineation of the dynamically linked indices for cell kill and resistance suppression. It is also true that a single isolate was examined. Finally, the human pharmacokinetic profile was derived from volunteers and not HABP/VABP patients, as these data are not currently available.
In summary, fosfomycin was evaluated against Pseudomonas aeruginosa in the HFIM with the goal of identifying the pharmacodynamic indices for bacterial cell kill as well as resistance suppression. These differed, with the AUC/MIC ratio being linked to bacterial cell kill and the Cmin/MIC ratio being linked to resistance suppression. This may be an important issue for fosfomycin and allows identification of optimal doses and schedules to achieve both goals, particularly for organisms with lower MIC values. Fosfomycin as monotherapy generated 2 to 3 log kill for 12 to 18 g per day prior to resistance emergence overwhelming the kill. This indicates that it would be prudent to use fosfomycin in combination with a second active agent to counterselect resistance emergence in Pseudomonas infections in high-burden circumstances, such as ventilator-associated bacterial pneumonia.
MATERIALS AND METHODS
Microorganisms.
Pseudomonas aeruginosa PAO1, a well-studied organism in our laboratory, was the isolate examined in these studies.
Drugs.
Fosfomycin disodium salt (fosfomycin for injection; Zolyd; Zavante Therapeutics) was used for the susceptibility testing, preparation of resistance-selecting plates, and bioanalytical methods (liquid chromatography-tandem mass spectrometry [LC/MS/MS]) and in the medium for the hollow fiber infection model studies. The drug was kindly supplied by Zavante Therapeutics.
In vitro susceptibility testing.
The in vitro susceptibility to fosfomycin was measured using both broth dilution and agar dilution according to the CLSI methodology (7). Cation-adjusted Mueller-Hinton II (MH II) agar (Ca-MHA) plates (Becton Dickinson, Sparks, MD) containing fosfomycin (3× baseline MIC) were prepared. The plates were incubated for 18 to 24 h in ambient air at 35°C.
Mutation frequency.
An overnight incubation in Mueller-Hinton II (MH II) broth of P. aeruginosa PAO1 was subsequently serially diluted and plated on drug-free Ca-MHA plates to estimate the total bacterial burden and also on drug (3× baseline MIC)-containing Ca-MHA plates to estimate the less susceptible subpopulation burden. To investigate whether the mutants that grew on drug-containing plates had an elevated fosfomycin MIC, 3 colonies were selected and the fosfomycin MICs were reestimated using the agar dilution and broth microdilution methods, as described above.
Hollow fiber infection model.
An HFIM was used to investigate the pharmacodynamics of fosfomycin against P. aeruginosa PAO1. Mueller-Hinton II broth was pumped from a central compartment through a hollow fiber cartridge (FiberCell Systems, Frederick, MD, USA) before being returned to the central compartment. A peristaltic pump was employed. Fosfomycin was administered into the central compartment by using a programmable syringe pump. Fresh Mueller-Hinton II broth was pumped from a reservoir into the central compartment, and the same volume of drug-containing medium was removed as waste. The rate was controlled to simulate the pharmacokinetic profiles for fosfomycin (modern data for the fosfomycin pharmacokinetic parameter values in volunteers were kindly provided by E. J. Ellis-Grosse of Zavante Therapeutics). The extracapillary space of each HFIM was inoculated with 12 ml of bacterial suspension. The desired inoculum was confirmed with quantitative cultures. The HFIM was incubated at 37°C in ambient air. Bacterial densities were determined by removing 0.4 ml from the extracapillary space via a sampling port. Serial dilutions in 0.1-ml volumes were then plated on both drug-free and drug-containing Ca-MHA plates to enumerate total and resistant subpopulations, respectively.
Study design.
Because of the mutational frequency to resistance identified, we decided to shorten the experiment to 24 h but to increase the frequency of sampling. We sampled the system at 1, 4, 9, and 24 h for once-daily administration, at 1, 4, 8, 9, and 24 h for administration every 8 h, and at 0, 1, 4, 9, and 24 h for continuous infusion for fosfomycin concentration determination in the central compartment. A loading dose was administered for the continuous infusion arm to provide rapid steady-state concentrations. For microbiological endpoints, we sampled the system at hours 2, 4, 6, 8, 10, 12, and 24 for the total bacterial burden as well as the less susceptible bacterial burden, with the selecting pressure being as indicated for determination of the mutational frequency to resistance. The regimens examined were a no-treatment control arm, as well as 12 g per day and 18 g per day, with each daily dose being administered once daily, every 8 h, and by continuous infusion.
Mathematical modeling.
The differential equations applied to all the data simultaneously are Equation 1 listed below:
| (1) |
where X1 is the amount of fosfomycin in the central compartment, t is time, R(1) is a piecewise input function for a time-delimited constant-rate infusion of fosfomycin, CL is the fosfomycin clearance, and Vc is the apparent volume of distribution in the central compartment.
| (2) |
| (3) |
where X2 is the number of fosfomycin-susceptible organisms; X3 is the number of fosfomycin-resistant organisms; Kgmax-s and Kgmax-r represent the maximal growth rate constants for the susceptible and resistant populations, respectively; POPMAX is the maximal bacterial population (in CFU per milliliter), Kkmax-s and Kkmax-r represent the maximal kill rate constants for the susceptible and resistant populations, respectively; C50k-s and C50k-r denote the concentrations (in milligrams per liter) for which the effect of fosfomycin against the susceptible and resistant populations is half maximal, respectively; and Hk-s and Hk-r represent Hill's constants for killing of the sensitive and resistant populations, respectively.
Population modeling employed the Big NPAG program of Leary et al. (8). To approximate the homoscedastic assumption, the adaptive γ feature was employed. The goodness of fit was assessed by predicted-observed regression for each system output. The measure of bias was the mean weighted error. The measure of imprecision was the bias-adjusted mean weighted squared error.
Fosfomycin LC/MS/MS assay for Mueller-Hinton II broth.
Mueller-Hinton II broth samples were stored at −80°C until analysis. After thawing at room temperature, 0.010 ml of each sample and 10 μl of internal standard (ethylphosphonic acid) was diluted using 1 ml of water. The resulting sample was transferred to an LC/MS vial, and 2 μl was used as the injection volume for analysis. Determination of fosfomycin was performed using liquid chromatography-dual mass spectrometry in a system consisting of a Prominence high-performance liquid chromatograph (HPLC; Shimadzu) and an API 5000 triple quadrupole mass spectrometer (AB Sciex). Separation was achieved using a Synergi Polar-RP HPLC column (150 by 4.6 mm; particle size, 4 μm; Phenomenex) at 40°C with a run time of 6 min. Mobile phases consisted of 10 mM ammonium acetate (pH 5) (mobile phase A) and acetonitrile (mobile phase B) at a flow rate of 0.750 ml/min in gradient mode.
The mass spectrometer was operated in the negative ion mode using the turbo ion spray (TIS) probe interface. Multiple-reaction monitoring (MRM) m/z 137/63 (quantifier) and m/z 137/80 (qualifier) were used for fosfomycin, and m/z 109/79 was used for the internal standard, ethylphosphonic acid. API 5000 parameters were as follows (arbitrary units): collision cell gas setting (CAD), 6; curtain plate gas setting (CUR), 30; nebulizer gas (gas 1) setting (GS1), 60; auxiliary gas (gas 2) setting (GS2), 60; ion spray voltage (IS), −4,500; temperature of heater gas (TEM), 650°C; for MRM m/z 137/63, declustering potential (DP), −15; collision cell energy (CE), −22; collision cell exit potential (CXP), −11; and dwell time, 200 ms; for MRM m/z 137/80, DP, −15; CE, −20; CXP, −9; and dwell time 200 ms; for MRM m/z 109/79; DP, −70; CE, −70; CXP, −5; and dwell time 200 ms. Calculation of concentrations was performed using Analyst software (v1.6.2; AB Sciex).
Linearity for fosfomycin in Mueller-Hinton-II broth, with a range of 7.8125 to 500 mg/liter, was demonstrated for each calibration curve over 2 separate runs with a correlation coefficient (R) of ≥0.9990 and a linear regression (R2) value of ≥0.9979. Within-run as well as between-run accuracies for each calibration curve were within ±10% of the nominal concentrations and <4.6% for the respective coefficients of variation of the mean values. Calibration curve precisions within runs ranged from 0.1% to 7.8%, and calibration curve precisions between runs ranged from 1% to 6.8%. The performance of quality control (QC) samples according to the within-run as well as between-run accuracies was within ±7% of the nominal concentrations and <1.6% for the respective coefficients of variation of the mean values. QC precision within runs ranged from 2.2% to 5.1%, and QC precision between runs ranged from 3.5% to 4.3%.
ACKNOWLEDGMENT
These studies were supported by R01 AI121430 from NIAID.
REFERENCES
- 1.Drusano GL, Louie A, MacGowan A, Hope W. 2015. Suppression of emergence of resistance in pathogenic bacteria: keeping our powder dry, part 1. Antimicrob Agents Chemother 60:1183–1193. doi: 10.1128/AAC.02177-15. [DOI] [PMC free article] [PubMed] [Google Scholar]
- 2.Drusano GL, Hope W, MacGowan A, Louie A. 2015. Suppression of emergence of resistance in pathogenic bacteria: keeping our powder dry, part 2. Antimicrob Agents Chemother 60:1194–1201. doi: 10.1128/AAC.02231-15. [DOI] [PMC free article] [PubMed] [Google Scholar]
- 3.Hendlin D, Stapley EO, Jackson M, Wallick H, Miller AK, Wolf EJ, Miller TW, Chaiet L, Kahan FM, Foltz EL, Woodruff HB, Mata JM, Hernandez S, Mochales S. 1969. Phosphonomycin, a new antibiotic produced by strains of Streptomyces. Science 166:122–123. doi: 10.1126/science.166.3901.122. [DOI] [PubMed] [Google Scholar]
- 4.Docobo-Pérez F, Drusano GL, Johnson A, Goodwin J, Whalley S, Ramos-Martín V, Ballestero-Tellez M, Rodriguez-Martinez JM, Conejo C, van Guilder M, Rodríguez-Baño J, Pascual A, Hope WW. 2015. Pharmacodynamics of fosfomycin: insights into clinical use for antimicrobial resistance. Antimicrob Agents Chemother 59:5602–5610. doi: 10.1128/AAC.00752-15. [DOI] [PMC free article] [PubMed] [Google Scholar]
- 5.VanScoy BD, McCauley J, Ellis-Grosse EJ, Okusanya OO, Bhavnani SM, Forrest A, Ambrose PG. 2015. Exploration of the pharmacokinetic-pharmacodynamic relationships for fosfomycin efficacy using an in vitro infection model. Antimicrob Agents Chemother 59:7170–7177. doi: 10.1128/AAC.04955-14. [DOI] [PMC free article] [PubMed] [Google Scholar]
- 6.Lepak AJ, Zhao M, VanScoy B, Taylor DS, Ellis-Grosse E, Ambrose PG, Andes DR. 2017. In vivo pharmacokinetics and pharmacodynamics of ZTI-01 (fosfomycin for injection) in the neutropenic murine thigh infection model against Escherichia coli, Klebsiella pneumoniae, and Pseudomonas aeruginosa. Antimicrob Agents Chemother 61:e00476-17. doi: 10.1128/AAC.00476-17. [DOI] [PMC free article] [PubMed] [Google Scholar]
- 7.Clinical and Laboratory Standards Institute. 2012. Methods for dilution antimicrobial susceptibility tests for bacteria that grow aerobically. Approved standard, 9th ed CLSI document M07-A9. Clinical and Laboratory Standards Institute, Wayne, PA. [Google Scholar]
- 8.Leary RH, Jelliffe R, Schumitzky A, Van Guilder M. 2001. An adaptive grid non-parametric approach to population pharmacokinetic/dynamic (PK/PD) population models, p 389–394. In Proceedings of the 14th IEEE Symposium on Computer-Based Medical Systems. IEEE, New York, NY. [Google Scholar]


