Abstract
The development of spatially offset Raman spectroscopy (SORS) has enabled deep, non-invasive chemical characterization of turbid media. Here, we use SORS to measure subcortical bone tissue and depth-resolved biochemical variability in intact, exposed murine bones. We also apply the technique to study a mouse model of the genetic bone disorder osteogenesis imperfecta. The results suggest that SORS is more sensitive to disease-related biochemical differences in subcortical trabecular bone and marrow than conventional Raman measurements.
Graphical abstract
1. Introduction
Vibrational spectroscopy has been used extensively to characterize and monitor the biochemical properties of bone. Raman spectroscopy (RS) is a particularly attractive approach because it requires minimal sample preparation and can be applied to intact bones. RS has been used to measure both bone mineral and organic matrix components in animal studies of osteogenesis imperfecta [1, 2], early-onset osteoarthritis [3], lead exposure [4], rheumatoid arthritis [5], glucocorticoid-induced osteoporosis [6, 7], and aging [8]. Correlations have also been observed between Raman and biomechanical properties of bone [8–10] with preliminary studies suggesting that RS can generate more accurate predictions of biomechanical strength than the clinical standard measurement of bone mineral density [4–6].
Various illumination and detection schemes have been combined with RS providing different trade-offs in resolution, penetration depth, and contrast. Confocal detection, for example, provides high spatial resolution up to approximately one transport length below the sample surface [11, 12]. When measuring bone, confocal RS is primarily sensitive to the cortex, as the transport length of near-infrared light in bone is only about 500 microns [13]. Diffuse Raman measurements, such as those acquired with coded aperture spectrometers [14], can sense significantly deeper within the tissue, but provide much coarser resolution that may preclude the separation of signals from different bone layers. Spatially offset Raman spectroscopy (SORS) is another approach that was specifically developed to measure turbid, layered media [15]. This technique introduces a spatial offset between illumination and collection regions, s, on the surface of the sample. The magnitude of the offset affects the relative sampling depth of the measurement; small offsets primarily measure superficial regions while larger offsets preferentially probe deeper layers.
The primary biomedical application of SORS has been transcutaneous bone detection where cortical bone is treated as the lower layer beneath overlying soft tissue [2]; however, few studies have applied SORS directly to exposed bone in order to characterize the underlying, subcortical tissue. A recent study explored the sampling volume of SORS by measuring thin slices of polytetrafluoroethylene (Teflon®) beneath equine metacarpal bone [16]. The data were used to establish the spectral signal-to-noise ratio (SNR) of the Teflon as a function of spatial offset and depth below the metacarpal bone. With this approach, the penetration depth into bone (defined as the maximum depth where the SNR of the 735 cm−1 Teflon peak was greater than or equal to 3) was 3.8 mm and was achieved with a spatial offset of s = 7 mm.
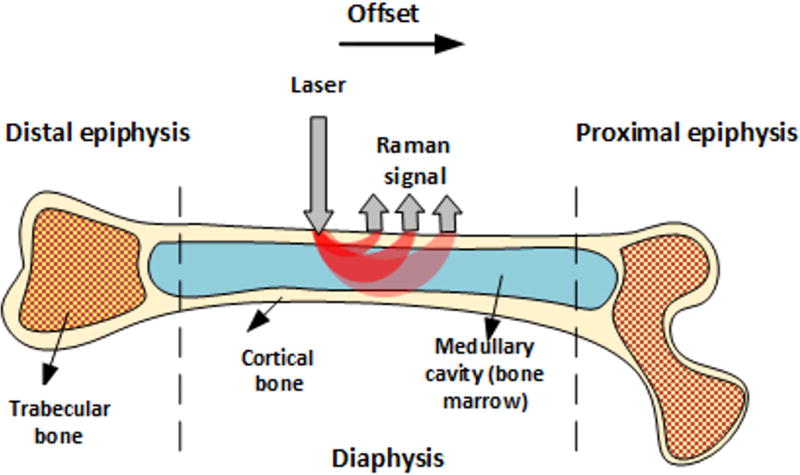
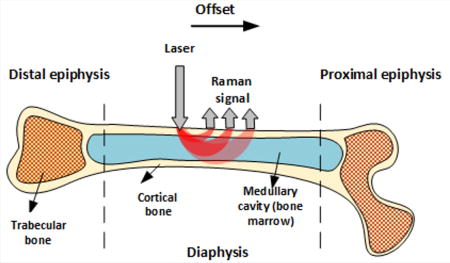
Like other tissues, bones are layered structures with features on submicroscopic, microscopic, and macroscopic length scales [17]. Long bones including the femur and tibia, for example, have an outer shell of dense cortical bone that is reinforced internally at each end with a more porous, mesh-like trabecular bone. Bone marrow is also contained within the cortical shell of long bones, with red marrow concentrated at the epiphyseal ends and yellow marrow within the medullary cavity. These macroscopic bone components are depicted in Figure 1.
Figure 1.
Macroscopic bone components and SORS measurement geometry.
Here, we present the results of a preliminary study of exposed bone using SORS. The work demonstrates that SORS is sensitive to subcortical bone tissue in the long bones of mice and rabbits. SORS is also applied to measure a mouse model of the genetic bone disorder osteogenesis imperfecta. Analysis reveals that conventional surface measurements of the cortical bone are less sensitive to disease-related spectral differences than SORS measurements that probe the underlying trabecular bone and marrow.
2. Materials and methods
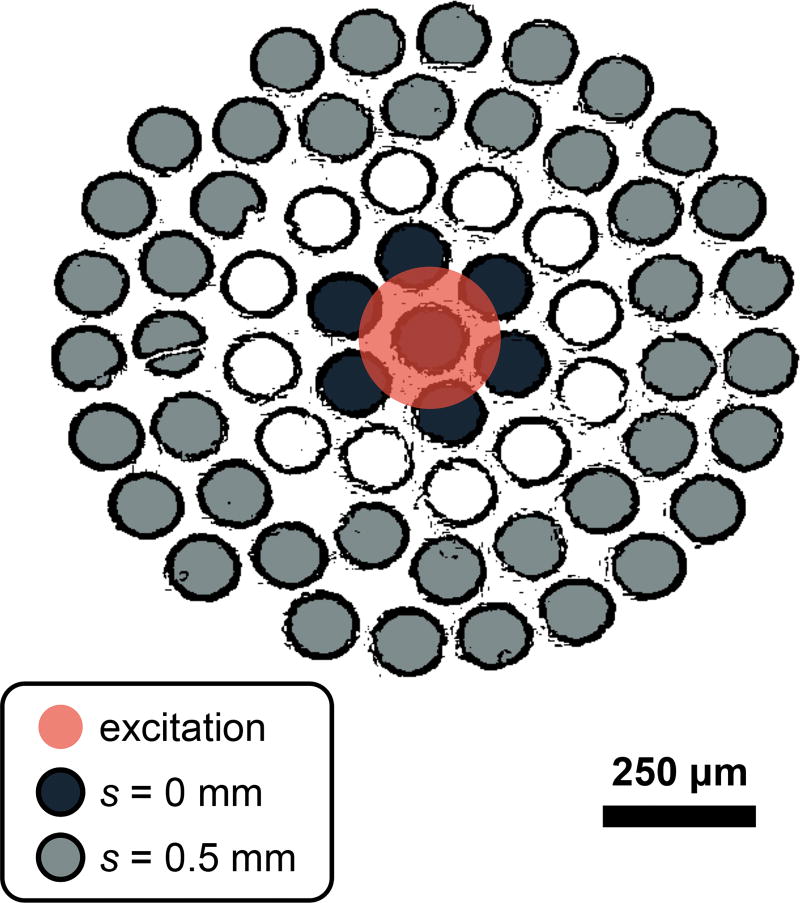
All data in this study were acquired with a RS system that has been described previously [2]. Briefly, the system delivers 150 mW of 830-nm light to a 230 µm diameter spot (1/e2 full-width) at the sample. Raman scattered light is collected over a numerical aperture of 0.34 and relayed to an optical fiber bundle. The light is then coupled into a circular array of 61 multimode optical fibers (0.27 NA, 100/120 µm core/cladding diameters) that are rearranged into a line for delivery to the spectrometer and charge coupled device (CCD) camera. The illumination spot overlapped with the virtual image of the center fiber in the bundle, introducing spatial offsets between illumination and collection fibers that varied from s = 0 to approximately s = 0.5 mm as depicted in Figure 2.
Figure 2.
Fiber bundle diagram depicting the relationship between the excitation spot and the collection regions (s = 0 and s = 0.5 mm) on the surface of the sample. The diagram was generated by applying an edge detection filter to a white-light image of the fiber bundle face. Note that only signal from 40 of the total 61 optical fibers were detected due to the limited height of the CCD camera.
Full CCD images were processed with a custom MATLAB routine. Impulsive noise artifacts (e.g., due to cosmic rays) were removed from each frame and a computational method was used to correct for aberrations in the spectrograph [18]. Dark current and readout bias were subtracted from each CCD image and wavelength and wavenumber axes were calibrated by measuring the emission from a neon gas discharge lamp and the Raman spectrum of N-acetylpara-aminophenol (Tylenol®). A NIST standard glass with a known fluorescence emission profile (Standard Reference Material 2241, National Institute of Standards) was used for throughput calibration and the light collected by each fiber in the bundle was extracted by fitting with the separately measured spectral response of each fiber [19]. Spectra acquired from fibers with similar spatial offsets were averaged yielding a single spectrum per spatial offset.
3. Feasibility of subcortical tissue measurement
In order to determine if SORS and conventional RS measurements probe subcortical tissue, a two-layer sample composed of cortical bone and Tylenol was constructed. First, the femur was extracted from a 40-week-old, female wild-type (WT) mouse and the distal and proximal epiphyses were detached. Next, the marrow was removed from the remaining cylindrical diaphysis (0.2 mm cortical thickness and 1.2 mm outer diameter) using a thin wire and the medullary cavity was gently irrigated. The cavity was then filled with powdered Tylenol and measured with the Raman system described above. For comparison, the experiment was repeated with a rabbit femur (1.2 mm cortical thickness and 7.0 mm outer diameter).
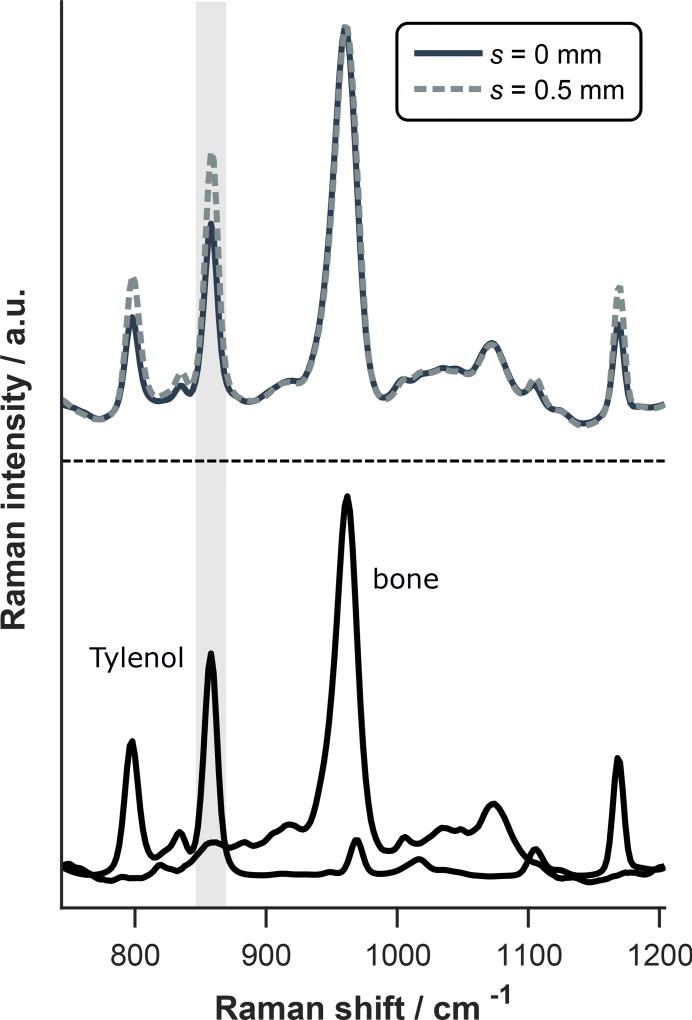
Representative spectra of murine cortical bone and Tylenol are displayed in Figure 3 along with measurements of the two-layer sample at spatial offsets of s = 0 and 0.5 mm. The Tylenol peaks are apparent in both measurements, but the relative Tylenol signal is larger at s = 0.5 mm as highlighted by the gray column.
Figure 3.
(top) Raman spectra of two-layer bone and Tylenol sample acquired at different spatial offsets and each normalized to the phosphate peak near 960 cm−1. Spectra of cortical bone and Tylenol alone are also included for comparison (bottom). Note that the relative signal from the lower (Tylenol) layer is larger at s = 0.5 mm as highlighted by the gray column indicating greater sensitivity to the subcortical space.
The increase in relative signal from the bottom layer of a two-layer sample is quantified by the SORS ratio, which is calculated as RSORS(s) = B(s)/T(s) where B(s) and T(s) are the spectral contributions from the bottom and top layers at spatial offset s. Note that B(s) and T(s) are normalized to unit amplitude at s = 0 such that RSORS(0) = 1. The SORS ratio associated with the two-layer murine bone and Tylenol sample increased to 1.4 at s = 0.5 mm.
As expected, the Tylenol-to-bone ratio was smaller in data acquired from the rabbit femur (53% reduction at zero offset) due to the larger cortical thickness; however, a similar SORS ratio of 1.4 was observed at s = 0.5 mm. This result is consistent with computational simulations showing the SORS ratio is nearly independent of top layer thickness for small offsets [20]. Intact, WT murine femurs (without the addition of subcortical Tylenol) were also studied and statistically significant spectral features indicative of subcortical bone marrow were observed. The data from these additional rabbit and murine femurs are presented in the Supplementary Material.
4. Pathologic bone sensing with SORS
To explore the utility of SORS for sensing pathologic bone changes, a murine model of osteogenesis imperfecta (OI) was studied. OI is a genetic disorder that causes extreme skeletal fragility due to mutations in the genes that code for type I collagen. SORS data were acquired from two tibiae harvested from an 8-week-old, male mouse with OI (B6C3Fe a/a-Col1a2oim/J; Jackson Laboratory, Bar Harbor, ME) and an age- and sex-matched WT mouse. The spectra were collected from the epiphyseal regions of the bone because the disease affects the differentiation of bone marrow progenitor cells found in this region [21].
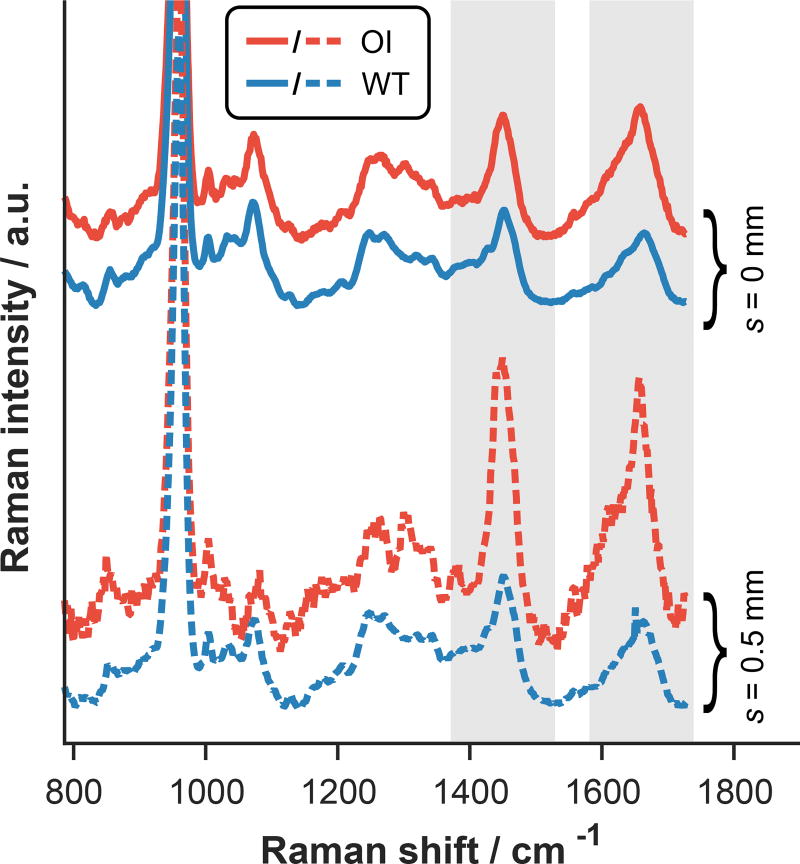
Figure 4 shows representative SORS data acquired from both tibiae. Notice the large contrast between the normal WT and diseased OI bones measured at s = 0.5 mm compared to the similarity of the s = 0 mm data. This result suggests that the SORS approach could be superior to conventional RS for diagnosing and monitoring OI in mice. Preliminary inspection of the spectral features in the s = 0.5 mm, OI data reveals a shift in the center-of-area of the CH2 wag peak near 1450 cm−1, the presence of a sharp feature near 1650 cm−1, and differences in the amplitudes of these features relative to the phosphate peak near 960 cm−1. Although further study is needed, these spectral variations could be indicative of differences in subcortical adipose content and/or relative mineralization. While the SORS data could be affected by structural changes such as cortical thinning, careful analysis indicates that differences in layer thicknesses cannot fully explain the spectral variations described above (see Supplementary Material).
Figure 4.
Representative SORS data acquired from the epiphyses of WT and OI tibiae at different spatial offsets and all normalized to the height of the phosphate peak near 960 cm−1. Spectroscopic differences between the WT and OI data are more apparent at deeper sampling depths (probed with s = 0.5 mm) as highlighted by the gray columns.
5. Discussion
SORS was developed to measure turbid, layered media at penetration depths typically inaccessible to conventional optical methods like confocal microscopy. Although many researchers have used SORS for transcutaneous bone sensing, the technique can also be applied to intact, exposed bones to measure subcortical tissue and depth-resolved biochemical variability.
The results above demonstrate that subcortical tissue can be detected in the long bones of mice and rabbits with SORS. It was also shown that SORS provides improved sensitivity to subcortical, biochemical changes in a mouse model of osteogensis imperfecta. Specifically, we observed spectral changes that could be due to higher adipose content and/or lower relative mineralization in subcortical tissue located at the distal epiphyses of the tibia. These observations are consistent with recent studies that showed that (1) osteogenesis imperfecta affects the differentiation of bone marrow progenitor cells leading to a reduction in osteoblasts and an increase in adipocytes [21] and (2) subcortical trabecular bone is less mineralized than the outer cortex in mouse femurs and tibiae [22].
Overall, this work establishes the feasibility of nondestructive, subcortical tissue sensing with SORS. The approach could be beneficial for a variety of applications including instrasurgical bone examination and, if implemented with a needle-based Raman probe [23], minimally-invasive analysis. With further development, SORS could also potentially enable completely non-invasive, transcutaneous characterization of subcortical tissue biochemistry, which could provide unique advantages over traditional bone biopsy or bone marrow aspiration for disease diagnosis.
Supplementary Material
Acknowledgments
Financial support was provided by the National Institutes of Health (R01 AR070613, R21 AR061285). The authors also wish to acknowledge Jason Inzana and Sara Nowacki for assistance preparing the bone samples.
References
- 1.Kozloff KM, Carden A, Bergwitz C, Forlino A, Uvegas TE, Morris MD, Marini JC, Goldstein SA. Journal of Bone and Mineral Research. 2004;19(4):614–622. doi: 10.1359/JBMR.040111. [DOI] [PubMed] [Google Scholar]
- 2.Maher JR, Inzana JA, Awad HA, Berger AJ. Journal of biomedical optics. 2013;18(7):077001–077001. doi: 10.1117/1.JBO.18.7.077001. [DOI] [PMC free article] [PubMed] [Google Scholar]
- 3.Dehring KA, Crane NJ, Smukler AR, McHugh JB, Roessler BJ, Morris MD. Appl. Spectrosc. 2006;60(10):1134–1141. doi: 10.1366/000370206778664743. [DOI] [PubMed] [Google Scholar]
- 4.Beier EE, Maher JR, Sheu TJ, Cory-Slechta DA, Berger AJ, Zuscik MJ, Puzas JE. Environmental Health Perspectives (Online) 2013;121(1):97. doi: 10.1289/ehp.1205374. [DOI] [PMC free article] [PubMed] [Google Scholar]
- 5.Inzana JA, Maher JR, Takahata M, Schwarz EM, Berger AJ, Awad HA. Journal of Biomechanics. 2013;46(4):723–730. doi: 10.1016/j.jbiomech.2012.11.039. [DOI] [PMC free article] [PubMed] [Google Scholar]
- 6.Maher JR, Takahata M, Awad HA, Berger AJ. Journal of Biomedical Optics. 2011;16(8):087012. doi: 10.1117/1.3613933. [DOI] [PMC free article] [PubMed] [Google Scholar]
- 7.Takahata M, Maher JR, Juneja SC, Inzana J, Xing L, Schwarz EM, Berger AJ, Awad HA. Arthritis & Rheumatism. 2012;64(11):3649–3659. doi: 10.1002/art.34639. [DOI] [PMC free article] [PubMed] [Google Scholar]
- 8.Akkus O, Adar F, Schaffler MB. Bone. 2004;34(3):443–453. doi: 10.1016/j.bone.2003.11.003. [DOI] [PubMed] [Google Scholar]
- 9.Bi X, Patil CA, Lynch CC, Pharr GM, Mahadevan-Jansen A, Nyman JS. Journal of Biomechanics. 2011;44(2):297–303. doi: 10.1016/j.jbiomech.2010.10.009. [DOI] [PMC free article] [PubMed] [Google Scholar]
- 10.Raghavan M, Sahar ND, Kohn DH, Morris MD. Bone. 2012;50(4):942–953. doi: 10.1016/j.bone.2011.12.026. [DOI] [PMC free article] [PubMed] [Google Scholar]
- 11.Maher JR, Chuchuen O, Henderson MH, Kim S, Rinehart MT, Kashuba AD, Wax A, Katz DF. Biomedical optics express. 2015;6(6):2022–2035. doi: 10.1364/BOE.6.002022. [DOI] [PMC free article] [PubMed] [Google Scholar]
- 12.Chuchuen O, Maher JR, Simons MG, Peters JJ, Wax AP, Katz DF. Journal of Pharmaceutical Sciences. 2016 doi: 10.1016/j.xphs.2016.09.030. [DOI] [PMC free article] [PubMed] [Google Scholar]
- 13.Firbank M, Hiraoka M, Essenpreis M, Delpy D. Physics in medicine and biology. 1993;38(4):503. doi: 10.1088/0031-9155/38/4/002. [DOI] [PubMed] [Google Scholar]
- 14.Maher JR, Matthews TE, Reid AK, Katz DF, Wax A. Journal of biomedical optics. 2014;19(11):117001–117001. doi: 10.1117/1.JBO.19.11.117001. [DOI] [PMC free article] [PubMed] [Google Scholar]
- 15.Matousek P, Clark IP, Draper ERC, Morris MD, Goodship AE, Everall N, Towrie M, Finney WF, Parker AW. Appl. Spectrosc. 2005;59(4):393–400. doi: 10.1366/0003702053641450. [DOI] [PubMed] [Google Scholar]
- 16.Sowoidnich K, Churchwell JH, Buckley K, Goodship AE, Parker AW, Matousek P. Journal of Raman Spectroscopy. 2016;47(2):240–247. [Google Scholar]
- 17.Weiner S, Wagner HD. Annual Review of Materials Science. 1998;28(1):271–298. [Google Scholar]
- 18.Esmonde-White FW, Esmonde-White KA, Morris MD. Appl. Spectrosc. 2011;65(1):85–98. doi: 10.1366/10-06040. [DOI] [PMC free article] [PubMed] [Google Scholar]
- 19.Dooley KA, Esmonde-White FWL, Morris MD. Biomedical Vibrational Spectroscopy IV: Advances in Research and Industry. 2010;7560(1):75600O. [Google Scholar]
- 20.Matousek P, Morris MD, Everall N, Clark IP, Towrie M, Draper E, Goodship A, Parker AW. Appl. Spectrosc. 2005;59(12):1485–1492. doi: 10.1366/000370205775142548. [DOI] [PubMed] [Google Scholar]
- 21.Gioia R, Panaroni C, Besio R, Palladini G, Merlini G, Giansanti V, Scovassi IA, Villani S, Villa I, Villa A, et al. Stem Cells. 2012;30(7):1465–1476. doi: 10.1002/stem.1107. [DOI] [PMC free article] [PubMed] [Google Scholar]
- 22.Goodyear SR, Gibson IR, Skakle J, Wells RP, Aspden RM. Bone. 2009;44(5):899–907. [Google Scholar]
- 23.Day JCC, Stone N. Appl. Spectrosc. 2013;67(3):349–354. doi: 10.1366/12-06651. [DOI] [PubMed] [Google Scholar]
Associated Data
This section collects any data citations, data availability statements, or supplementary materials included in this article.


