

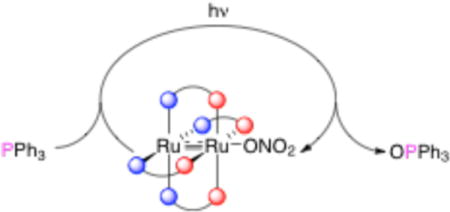
Abstract
Three new diruthenium oxyanion complexes have been prepared, crystallographically characterized, and screened for their potential to photochemically unmask a reactive Ru–Ru=O intermediate. The most promising candidate, Ru2(chp)4ONO2 (4, chp = 6-chloro-2-hydroxypyridinate), displays a set of signals centered around m/z = 733 amu in its MALDI-TOF mass spectrum, consistent with the formation of the [Ru2(chp)4O]+ ([6]+) ion. These signals shift to 735 amu in 4*, which contains 18O-labeled nitrate. EPR spectroscopy and headspace GC-MS analysis indicate that NO2• is released upon photolysis of 4, also consistent with the formation of an Ru2(chp)4O species. Photolysis of 4 in CH2Cl2 at room temperature in the presence of excess PPh3 yields OPPh3 in 173% yield; control experiments implicate Ru2(chp)4O (6), NO2•, and free NO3− as the active oxidants. Notably, Ru2(chp)4Cl (3) is recovered after photolysis. Since 3 is the direct precursor to 4, the results described herein constitute the first example of a synthetic cycle for oxygen atom transfer that makes use of light to generate a putative metal oxo intermediate.
Graphical abstract
INTRODUCTION
The use of light in chemical synthesis is a topic of significant current interest.1 We2 and others3 have recently used light to access putative, highly reactive transition metal-containing intermediates. The most well-known examples are metal nitride compounds (I), which can be photochemically accessed from metal azide precursors (Scheme 1).4 Metal terminal oxo species (II) are related reactive intermediates that are of great importance for biological and synthetic oxidation reactions.5 Typically, chemical or electrochemical redox reactions5a,6 are used to access II, but here we probe the possibility of photochemically unmasking a highly reactive species II, as in the bottom of Scheme 1.
Scheme 1.

Formation of mononuclear metal nitride and oxo species after exposure of metal azides and oxyanions to light, respectively.
Important precedents for this work include the elimination of nitrite ion from an O=Ru–ONO2 complex to produce a dioxo Ru species7 and disproportionation of nitrite to form both Ru=O and Ru–NO complexes.8 Furthermore, Suslick9 and Vogler10 have reported formation and reactivity of metal oxo species by photolytic cleavage of complexes with O-coordinated oxyanions, while Newcomb11 and Bakac12 have used flash photolysis to observe similar, highly reactive species. A major difficulty hindering the synthetic utility of this approach is the question of how to regenerate the M–OEOx precursor (Scheme 2). This transformation, shown with a question mark in Scheme 2, is problematic because substrate (S) oxidation yields a coordinatively unsaturated metal complex that is reduced by one-electron from the original M–OEOx species. Installation of OEOx− with concomitant one-electron oxidation is problematic because the OEOx− ions themselves can act as two-electron oxidants. We report here a solution to this problem that makes use of the properties of metal-metal bonded compounds.
Scheme 2.

Possible stoichiometric cycle illustrating the synthetic limitations of current oxyanion systems.
We recently described the first examples of M–M=O species (in which M = Mo or W) and we found them to display unusual reactivity.13 Related Ru–Ru=O intermediates have recently been proposed to be important in sulfide oxygenation14 and water oxidation15 catalysis; furthermore, Ru2(II/II) complexes have been shown to reversibly bind O2.16 Putative Ru–Ru=O species are highly reactive and have not been observed or isolated. Due to their important catalytic applications and our previous expertise in the chemistry of Ru–Ru≡N intermediates, we sought to use the photochemical methods outlined above to access Ru–Ru=O species in order to explore their fundamental reactivity. We also find the Ru–Ru=O species to be unstable, but it can nonetheless be utilized in a synthetic photocycle for oxygen atom transfer.
RESULTS AND DISCUSSION
To date, only two discrete (non-polymeric) Ru2 compounds bearing axial oxyanionic ligands are known: Ru2(DMBA)4(ONO2)2 (DMBA = N,N′-dimethylbenzamidinate),17 which contains two η1-coordinated nitrate ligands, and Ru2(OAc)4(ONO2)(H2O),18 which forms polymeric chains upon loss of the aquo ligand. We are instead keen to explore whether a discrete, anhydrous mono-oxyanion complex with an Ru–Ru–O–EOx structure could be prepared. As such we turned to the DPhF (DPhF = N,N′-diphenylformamidinate) and chp (chp = 6-chloro-2-hydroxypyridinate) ligands, for their steric bulk near the axial coordination site should eliminate the possibility of forming polymeric chains and only one oxyanionic ligand should bind to the Ru2 core based on charge balance. The compounds discussed herein are given in Chart 1.
Chart 1.
Compounds discussed herein.
| Entry | Complex | Ligands |
|---|---|---|
| 1 | Ru2(DPhF)4Cl |

|
| 2 | [Ru2(DPhF)4][NO3] | |
| 3 | Ru2(chp)4Cl | |
| 4 | Ru2(chp)4ONO2 | |
| 5 | Ru2(chp)4OClO3 |
Synthesis and IR Spectroscopic Characterization
Compounds 2, 4, and 5 were prepared from the chloride precursors 1 and 3 by metathesis with the appropriate Ag+ salts (AgNO3 for 2 and 4; AgClO4 for 5) as seen in Scheme 3. The IR spectrum for 2 displays a signal at 1773 cm−1, which is well within the characteristic range of 1700-1800 cm−1 for free nitrate anions.19 Furthermore, the MALDI-TOF mass spectrum of 2 shows an isotopic envelope indicative of the free [Ru2(DPhF)4]+ core (Figure S1), and the crystal structure of 2 consists of well-separated [Ru2(DPhF)4]+ cations and NO3− anions.20 The steric bulk of the DPhF phenyl rings therefore prevents NO3− coordination. In contrast, the IR spectra of 4 and 5 display signals consistent with O-coordinated nitrate19b and perchlorate ligands19b,21 (1278 cm−1 [νasym (ONO)] for 4; ν4 = 1154, 1134, 1025 cm−1, and ν2 = 894 cm−1 for 5).
Scheme 3.

Formation of nitrate complex 2 from chloride precursor 1 and oxyanion complexes 4 and 5 from chloride precursor 3.
Crystallography
Compounds 4 and 5 have been characterized by X-ray crystallography (Figures 1, 2 and Table S1). As with the chloride precursor 322 and azide analog Ru2(chp)4N3,2d the equatorial chp ligands in 4 and 5 are bound in a (4,0) orientation, which allows for the oxyanionic ligand to bind only to the exposed Ru axial site.
Figure 1.
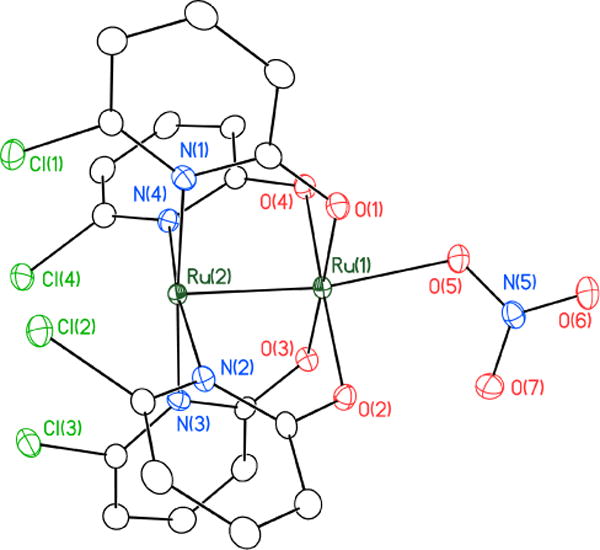
Thermal ellipsoid plot of 4•2CH2Cl2 with ellipsoids drawn at the 50% probability level. Hydrogen atoms and molecules of solvation are omitted for clarity.
Figure 2.

Thermal ellipsoid plot of 5•2CH2Cl2 with ellipsoids drawn at the 50% probability level. Hydrogen atoms and molecules of solvation are omitted for clarity.
The Ru–Ru distances in 4 and 5 (2.2633(3) Å and 2.2540(7) Å,23 respectively, listed in Table 1) are in accord with all other previously characterized Ru25+ oxypyridinate complexes.24 The Ru(2)–Ru(1)–O(5) bond angle in 4 deviates from linearity to 170.07(7)° and that in 5 deviates to 170.9(2)°, likely due to crystal packing effects. At 1.221(3) Å and 1.236(3) Å, the nitrate N–O distances (N(5)–O(6) and N(5)–O(7), respectively) in 4 are slightly shorter than, but in line with, those of an unbound nitrate anion (1.241(2) Å).25 At 1.306(3) Å, the O(5)–N(5) distance is significantly longer, causing the nitrate anion to lose 3-fold symmetry due to the Ru(1)–O(5) interaction. The O(6)–N(5)–O(7) angle is 122.1(3)° and, when combined with the other O–N–O angles (118.4(3)° and 119.4(2)°), sum to 359.9°, indicating a planar nitrate group, which is oriented parallel to the Ru–Ru bond. The perchlorate anion in 5 exhibits O–Cl–O angles that range from 107.0(3)° – 112.8(4)°, which are close to the idealized geometry of 109.5° for a tetrahedral anion. The O(5)–Cl(5) distance is slightly elongated at 1.464(4) Å compared to the other O–Cl bond distances of 1.370(5) Å, 1.392(5) Å, and 1.445(6) Å.
Table 1.
Selected crystallographic bond lengths and angles for 4 and 5. E = N for 4, Cl for 5.
| Compound | 4 | 5 |
|---|---|---|
| Ru(1)–Ru(2) Å | 2.2633(3) | 2.2540(7) |
| Ru(1)–O(5) Å | 2.200(2) | 2.249(4) |
| O(5)–E(5) Å | 1.306(3) | 1.464(4) |
| E(5)–O(6) Å | 1.221(3) | 1.445(6) |
| E(5)–O(7) Å | 1.236(3) | 1.370(5) |
| E(5)–O(8) Å | – | 1.392(5) |
| Ru(2)–Ru(1)–O(5) (°) | 170.07(6) | 170.9(2) |
UV/Vis Spectroscopy
The most intense absorption feature for compounds 3-5 in CH2Cl2 shifts from 529 to 532 to 542 nm and increases in intensity as the coordinating strength of the anion increases (5 < 4 < 3) (Figure 3). Though this electronic transition has not been definitively assigned, the variation in energy and intensity observed here suggests that it has significant LMCT character involving the axial ligand. The secondary feature in the spectrum also shifts from 666 to 678 to 689 nm in the same manner (5 < 4 < 3), but the intensity of this feature remains relatively consistent throughout the series.
Figure 3.

UV/Vis for compounds 3-5 in CH2Cl2. The spectrum for 3 was previously reported22 but is included here for direct comparison.
Cyclic Voltammetry
Cyclic voltammograms of 4 and 5 were recorded under two distinct sets of conditions. Solutions of 3-5 in CH2Cl2 with 0.1 M NBu4PF6 electrolyte were examined, as well as solutions of 4 in 0.1 M NBu4NO3 and 5 in 0.1 M NBu4ClO4. These varying conditions give insight into the binding of NO3− and ClO4− anions to the [Ru2(chp)4]+ core in solution. In analyzing these data, we can consider two limiting cases. If, first, the NO3− and ClO4− anions dissociate completely from 4 and 5 in CH2Cl2, then we would expect both compounds to have identical CV traces in 0.1 M NBu4PF6. If, on the other hand, we assume that NO3− and ClO4− do not dissociate at all from 4 or 5 in solution, then we would expect the CV traces of 4 with NBu4PF6 and NBu4NO3 electrolytes to be identical, and the CV traces of 5 with NBu4PF6 and NBu4ClO4 to be identical as well. The data shown in Figure 4 (see also Table 2) show clearly that neither of these limiting cases reflects reality. The fact that the CVs of 4 and 5 in NBu4PF6 appear distinct indicates that these solutions do not simply contain free [Ru2(chp)4]+ cations. However, the fact that the redox potentials change when the electrolyte is changed to NBu4NO3 or NBu4ClO4 indicates that both 4 and 5 undergo the following equilibrium in solution: Ru2(chp)4X ⇌ [Ru2(chp)4]+ + X−. Other diruthenium compounds show similar behavior.26 Addition of excess X− shifts this equilibrium to the left. This is clearly a fast equilibrium relative to the timescale of the electrochemical measurement since we do not observe distinct waves that may be assigned to Ru2(chp)4X and [Ru2(chp)4]+. These results indicate that both Ru2(chp)4X species and free X− are chemically relevant on the timescale of photolysis experiments in fluid solution at room temperature (vide infra).
Figure 4.

Cyclic voltammograms of Ru25/4+ couple for 3-5 versus Fc/Fc+. E1/2 for each species is marked with a dashed vertical line.
Table 2.
E values for Ru25/4+ couple for 1-5 vs. Fc/Fc+ in CH2Cl2 with scan rate = 100 mV/s. Electrolyte is 0.1 M.
Photolysis Screening by Mass Spectrometry
MALDI-TOF mass spectrometry is a particularly useful method for screening photolytically-active compounds. In this case, the MALDI-TOF nitrogen laser (337 nm) is the light source, and photolysis products can be directly observed in the mass spectrum. The most prominent set of signals for 4 and 5 in MALDI-TOF mass spectrometry experiments corresponds to the Ru2(chp)4+ core with the characteristic Ru2 isotopic distribution centered around m/z = 717 amu (Figure 5 for 4; Figure S2 for 5), indicating facile loss of the axially-bound oxyanions. In the case of 4, there is a weak Ru2 signal centered at m/z = 733 amu, which is consistent with an [Ru2(chp)4O]+ ion, suggesting that an Ru2O species could be formed upon photolysis of 4. This is also similar to the case of Ru2-azide compounds that show Ru2N signals in their mass spectra due to photolysis.2 To further support this hypothesis, we used labeled 18O-nitrate (N18O3−) to form Ru2(chp)418ON18O2 (4*), and we found that the Ru2O feature shifts in the mass spectrum to m/z = 735 amu (Figure 5). This shift clearly indicates that the axial O atom in the [Ru2(chp)4O]+ ion derives from nitrate and is fully consistent with photo-dissociation of NO2• or NO2− from 4. The m/z = 733 amu feature is present but barely discernable in the spectrum of 5 (Figure S2), suggesting to us that perchlorate may not be as suitable a precursor for the formation of an Ru2O intermediate. Therefore only 4 was investigated further.
Figure 5.
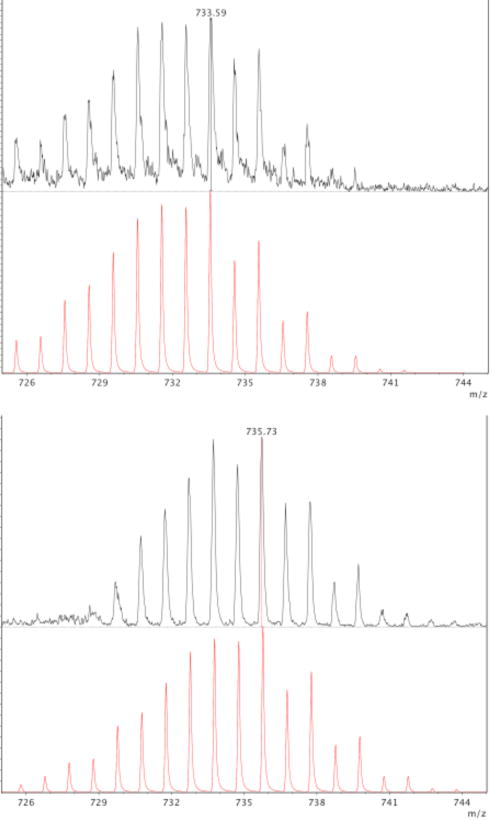
MALDI-TOF mass spectrum for 4 (black, top). Simulation (red) indicates isotope pattern at m/z = 733 amu is due to [Ru2(chp)4O]+. Upon isotopic labeling, MALDI-TOF mass spectrum for 4* (black, below) shifts by 2 units, as confirmed by simulation (red, bottom).
In photolysis experiments of 4 there are two possible sites at which bonds could break homolytically: (a) the Ru–ONO2 bond or (b) the RuO–NO2 bond (Scheme 4). Previous studies have indicated that either site is possible.11a,11b,29 Heterolytic RuO–NO2 bond cleavage is another possible pathway (pathway c in Scheme 4), which has been demonstrated for perchlorate compounds.11b Both pathways b and c would explain our mass spectrometry results. Upon homolysis (pathway b), the resulting radical species NO2• should be EPR active, unlike its Ru2O counterpart Ru2(chp)4O (6), which is anticipated to have a ground state of S = 0.30 Heterolysis (pathway c), on the other hand, would give rise to an EPR-active Ru2O+ species. Thus, we decided to use EPR spectroscopy to assess the mechanism of photolysis for 4.
Scheme 4.

Possible products upon exposing nitrate complexes to photolytic conditions.
Photolysis of 4 in Frozen Solution at 77 K and in Fluid Solution at Room Temperature
The EPR spectra of 2, 4, and 5 (Figures S3, 6, and S4, respectively) were measured at 10 or 15 K in a frozen solution of CH2Cl2. Though electrochemical measurements (vide supra) suggest the presence of an equilibrium between Ru2–bound and –unbound nitrate species, the 10 K EPR spectrum of 4 can be modeled with a single axial signal, with effective g values of 3.86 and 1.95, consistent with an S = 3/2 ground state where D ≫ hν (Table 3). Thus, the nitrate-bound 4 is most likely the dominant species in solution at this temperature, and its prominent EPR signal can be used to assess the efficacy of photolysis of 4 in frozen solution.
Table 3.
EPR spectral simulations for 2, 4, and 5.
| Compound | 2 | 4 | 5 |
|---|---|---|---|
| g⊥ | 2.125 | 2.01 | 2.00 |
| g║ | 1.94 | 1.95 | 1.93 |
| E/D | 0.006 | 0.035 | 0.033 |
| HStraina | 850, 350, 450 | 1200, 900, 1200 | 1550, 850, 1100 |
HStrain accounts for anisotropic line broadening due to unresolved hyperfine coupling
Exposure of a frozen CH2Cl2 solution of 4 to 350 nm wavelength light at 77 K for 8 hours yields no change in the intensity of the EPR signal of 4. Switching to 254 nm light and photolyzing for 16 hours at 77 K yields the EPR spectrum shown in Figure 7. There is a slight decrease in the signal intensity from the S = 3/2 signal of 4 and, more significantly, a new feature in the g = 2 region is present. This new signal is an isotropic 1:1:1 triplet, clearly indicating a radical species with hyperfine coupling involving an I = 1 14N nucleus, and it compares favorably to known literature values for NO2• versus those of NO3• (Figure 7, inset).31 The presence of NO2• suggests that, though photolysis of 4 proceeds in low yield at 77 K, homolytic cleavage of the O(5)–N(5) nitrate bond is the primary photolysis pathway (pathway b in Scheme 4).
Figure 7.

EPR spectrum of 4 in CH2Cl2 taken at 10 K after 16 hours of frozen photolysis using 254 nm light. Inset: simulations31 of NO3• (blue, above) and NO2• (red, middle) compared to 4 after frozen photolysis (black, below).
In order to improve the yield of photolysis, subsequent experiments were performed on fluid solutions of 4 in CH2Cl2 at room temperature under N2. Under these conditions, photolysis is complete in a shorter time period of 4 hours using 350 nm wavelength light. Using the isotopically-enhanced analog 4*, GC-MS analysis of the headspace of the reaction confirms formation of N18O2• (m/z = 50) in significant quantities (Figure 8), further supporting the homolytic cleavage mechanism (pathway b in Scheme 3) suggested by our EPR results.
Figure 8.
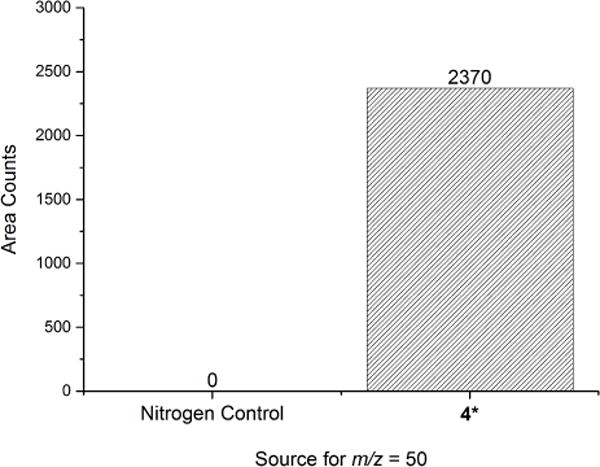
GC-MS headspace analysis for the formation of N18O2• (m/z = 50) after photolysis of 4* at room temperature under N2 for 4 hours using 350 nm wavelength light. As compared to the counts for m/z = 50 amu for the N2 control, N18O2• is clearly formed under reaction conditions.
Oxygen Atom Transfer via Room Temperature Photolysis of 4
Room temperature fluid solution photolytic experiments were also performed in the presence of an excess of the well-known oxygen atom acceptor PPh3 and monitored for the formation of oxygen atom transfer products. A CH2Cl2 solution of 4 and PPh3 (20 eq. vs. 4) was photolyzed for 4 hours using 350 nm light at room temperature under N2. Analysis by 31P{1H} NMR spectroscopy indicates the formation of the intermolecular oxygen atom transfer product OPPh3 in > 100% yield (determined by 31P NMR integration against a standard of PPh4Cl) (Figure 9). The identity of this product was confirmed by doping with an authentic sample of OPPh3 (Figure S5) and is further corroborated by ESI mass spectral data, which shows that the product formed in this reaction with 4 has a mass of m/z = 279 amu (consistent with OPPh3) (Figure S6) and shifts by 2 mass units to m/z = 281 amu (consistent with 18OPPh3) upon using 4* (Figure S7).
Figure 9.

Yield of OPPh3 after exposure to different oxygen atom sources, both with and without exposure to photolytic conditions.
The > 100% yield of OPPh3 implies that more than one active oxidant is formed under these conditions. As mentioned above, some amount of free NO3− is expected to be present based on our electrochemistry results. Upon UV irradiation at ~ 300 nm, unbound nitrate is known to eliminate either 3P O or O− 32 or to isomerize to peroxynitrite.33 To test the possibility that unbound nitrate is the sole oxygen atom source, photolysis of NBu4NO3 was performed under identical conditions as previously expressed. OPPh3 is indeed generated but in less than one-third the yield as when 4 was used (Figure 9). We also considered the possibility that the Ru2 complex could simply act as a photosensitizer for free NO3−. A control reaction was therefore performed in which NBu4NO3 and PPh3 were photolyzed in the presence of Ru2(chp)4Cl (3) as a photo-sensitizer (Figure 9). OPPh3 is generated in better yields here than without 3, but this result still does not match our findings with 4. Therefore, OPPh3 can be formed from free NO3− anion but is formed more efficiently from 4.
It is conceivable that O2 could be formed from either nitrate photolysis or bimetallic reductive coupling of Ru2O intermediates and could be the oxygen atom source for formation of OPPh3. To test this possibility, 4* was photolyzed in a CH2Cl2 solution at room temperature and analysis of the reaction headspace was performed using GC-MS. These results indicate that 18O2 is not formed (Figure S8). Another potential oxygen atom source is the photolysis byproduct NO2•.9b,10 To probe this possibility, PPh3 was exposed to NO2•. ESI mass spectrometry data indicate that the resulting product is indeed OPPh3 (Figure S9). To see whether NO2• is fully consumed under our reaction conditions, 4 was photolyzed in a CH2Cl2 solution containing 20 equivalents of PPh3 at room temperature, and analysis of the reaction headspace was performed using GC-MS (Figure S10). Free NO2• is still detected under these conditions, though in smaller yields than without PPh3 present. Thus NO2• is likely to be an oxygen atom source in this system but clearly cannot be the sole source. We therefore propose that the oxygen atom transfer in this system derives from three active oxidants: free nitrate ion, NO2•, and an Ru–Ru=O intermediate, giving yields of OPPh3 greater than 100%.
Finally, we were interested in determining the identity of the resulting Ru2 species after completion of room temperature photolysis in the presence of PPh3. Only one Ru2 product was observed and isolated. MALDI-TOF mass spectrometry and UV/Vis confirm this product to be the precursor 3. This result was surprising to us since oxygen atom transfer from an Ru–Ru=O species should yield an Ru2(II/II) product such as Ru2(chp)4PPh3, a species that we have recently characterized.34 However, low-valent metal-metal bonded dimers are known to react with light and halogenated solvents to yield one-electron oxidized compounds bearing an axial halide ligand.35 This reaction sequence explains the formation of 3, as shown in Scheme 5. As emphasized by Scheme 5, our results present a complete synthetic photocycle for oxygen atom transfer from a photoactive oxyanion complex.
Scheme 5.

Proposed mechanistic scheme for the oxygen atom transfer reaction presented here. Proposed intermediates 6 and Ru2(chp)4 are in dashed boxes.
CONCLUSIONS
Whereas the [Ru2(DPhF)4]+ core is not sterically accessible to bind non-linear anions as ligands, the [Ru2(chp)4]+ core does support the formation of discrete, mono-oxyanion complexes with η1-nitrate and -perchlorate anions. Mass spectrometry, EPR, and GC-MS analysis data suggest that photolysis of 4 proceeds to generate Ru–Ru=O species 6 and NO2•. Room temperature photolysis of 4 allows for oxygen atom transfer to PPh3 to form OPPh3 in a synthetic photocycle that regenerates 3. We therefore propose that PPh3 is directly oxidized by a combination of three active oxidants: photosensitized NO3−, reactive intermediate 6, and additionally by NO2•. This work demonstrates for the first time that the generation of a reactive metal oxo species from an oxyanion complex can be incorporated into a synthetic cycle. Further exploitation of these reaction conditions, along with efforts to stabilize and characterize the putative Ru–Ru=O intermediate are underway in our lab.
EXPERIMENTAL SECTION
General Methods
All syntheses were conducted under a dry N2 atmosphere using Schlenk line techniques unless otherwise noted; product workup and isolation were achieved in air unless otherwise noted. Dichloromethane (CH2Cl2) was dried with CaH2 and distilled before use. Hexanes were obtained from a Vacuum Atmospheres Solvent System and degassed prior to use. All materials were commercially available and used as received, unless otherwise noted. Compounds 126b,36 and 32d,22 were prepared according to literature procedures. Photolysis of frozen samples of 4 were performed in a Rayonet RPR-200 photochemical reactor with light from 254 and 350 nm mercury vapor lamps.
[Ru2(DPhF)4][NO3] (2)
Ru2(DPhF)4Cl (200 mg, 0.196 mmol, 1 eq.) was dissolved in CH2Cl2 and added to a suspension of AgNO3 (500 mg, 2.94 mmol, 15 eq.) in 3 mL of THF in air. The color of the mixture changed from green to purple-blue almost instantaneously and was allowed to continue stirring at RT overnight. The solids were filtered off and the remaining solution was left to evaporate slowly to yield dark purple crystals of the product. Yield: 180 mg, 87.7%. MW: 1045.10 g mol−1. MALDI-TOF (m/z): ([M – NO3]+) 984. IR (ATR): 3053, 1773 [νsym NO3], 1591, 1520, 1486, 1449, 1364, 1349, 1314, 1214, 1175, 1156, 1078, 1027, 936, 827, 761, 693, 668, 658, 619. UV-Vis (CH2Cl2):. λmax(ε) = 437 (4250), 527 (5950), 681 (7170 mol−1 L cm−1). [C52H44N9O3Ru2•CH2Cl2•2H2O]: calcd. C 54.59, H 4.32, N 10.81; found C 54.31, H 3.88, N 11.37. Crystals suitable for X-ray diffraction were grown via slow evaporation from a concentrated solution of CH2Cl2 at room temperature.
Ru2(chp)4ONO2 (4)
Ru2(chp)4Cl (200.0 mg, 0.266 mmol, 1 eq.) and AgNO3 (54.6 mg, 0.321 mmol, 1.2 eq.) were dissolved in 30 mL of freshly distilled CH2Cl2 and allowed to stir for 96 h at RT under static N2. A white precipitate (AgCl) formed. The reaction mixture was filtered through a fine sintered glass frit. Excess CH2Cl2 was washed through the frit until it was no longer colored. The filtrate was removed under reduced pressure, and the resulting purple solid was washed with hexanes and collected. Yield: 195.5 mg, 94.4%. MW: 778.29 g mol−1. MALDI-TOF (m/z): ([M – NO2]+) 733, ([M – ONO2]+) 717. IR (ATR): 3108, 2964, 1596, 1534, 1465, 1434, 1390, 1350, 1278 [νasym (ONO)], 1262, 1181, 1085, 1011, 964, 942, 931, 866, 795, 789, 724, 630 cm−1. UV-Vis (CH2Cl2): λmax(ε) = 532 (3890), 678 (1520 mol−1 L cm−1). [C20H12Cl4N5O7Ru2]: calcd. C 30.86, H 1.55, N 8.99; found C 30.64, H 1.44, N 8.81. Crystals suitable for X-ray diffraction were grown from a saturated CH2Cl2 solution at −80 °C.
Ru2(chp)4OClO3 (5)
Ru2(chp)4Cl (200.0 mg, 0.266 mmol, 1 eq.) and AgClO4 (66.7 mg, 0.322 mmol, 1.2 eq.) were dissolved in 30 mL of freshly distilled CH2Cl2 and allowed to stir for 96 h at RT under static N2. A white precipitate (AgCl) formed. The reaction mixture was filtered through a fine sintered glass frit. Excess CH2Cl2 was washed through the frit until it was no longer colored. The filtrate was concentrated under reduced pressure, and the resulting purple solid was washed with hexanes and collected. Yield: 205.3 mg, 94.6%. MW: 815.74 g mol−1. MALDI-TOF (m/z): ([M – ClO3]+) 733, ([M – OClO3]+) 717. IR (ATR): 3107, 1596, 1536, 1433, 1391, 1337, 1263, 1154 [ν4, 1134 [ν4, 1075, 1025 [ν4, 1013, 932, 894 [ν2, 790, 723, 705, 668, 632, 610 cm−1. UV-Vis (CH2Cl2): λmax(ε) = 529 (2150), 666 (1310 mol−1 L cm−1). [C20H12Cl5N4O8Ru2]: calcd. C 29.45, H 1.48, N 6.87; found C 29.20, H 1.68, N 6.26. Crystals suitable for X-ray diffraction were grown from a saturated CH2Cl2 solution layered with hexanes at room temperature. Safety warning: anhydrous metal perchlorate complexes are potentially explosive.
AgN18O3. 0.1 g HN18O3 (95 atom %, 65 weight % in H218O), 0.1 g H218O, Ag powder, and a stir bar were added to a vial that was subsequently capped. This heterogeneous mixture was stirred at 50 °C in air for 48 hours; periodically the mixture was manually rotated and the solvent mixture forced to the bottom of the vial as it had crept up the walls of the vial. A white solid became visible as the reaction reached completion, which was re-dissolved in the H218O. The supernatant liquid was then decanted away (using a pipette) from the heterogeneous solid mixture into a new vial and allowed to evaporate to dryness, leaving a crystalline product, which was dried under vacuum at 50 °C overnight. Yield: 126.8 mg (76.5%). IR (ATR): 1676, 1657 [νasym (18ON18O)], 1293 [νsym (18ON18O)], 792 [ν (N18O)], 694 cm−1.
Ru2(chp)418ON18O2 (4*)
AgN18O3 was ground into fine powder and then used in an identical procedure as 4. Yield: 141.2 mg, 67.7%. MW: 784.29 g mol−1. MALDI-TOF (m/z): ([M – N18O2]+) 735. IR (ATR): 3108, 2964, 1596, 1534, 1465, 1434, 1390, 1350, 1253 [νasym (18ON18O)], 1262, 1181, 1085, 1011, 942, 931, 866, 795, 789, 724, 630 cm−1.
Solution-phase Reactions
A 0.5 mM CH2Cl2 solution of the nitrate source (4, 3 + NBu4NO3, or NBu4NO3) with a 20-fold excess of PPh3 was prepared on a 30 mL scale in a quartz Schlenk tube (flask “A”). A 10 mL aliquot was transferred to a different flask (flask “B”), which was wrapped in foil, and allowed to stir under static N2 for 4 hours without exposure to photolytic conditions. The remaining 20 mL solution was photolyzed in flask “A” under static vacuum at room temperature using 350 nm light for 4 hours. After this time a 10 mL aliquot was removed and transferred to a 25 mL Schlenk flask (flask “C”). Solutions in flasks “B” and “C” were reduced to dryness under vacuum and analyzed by NMR with a known quantity (1 eq. based on 4) of PPh4Cl for use as a comparative standard. 31P{1H} NMR (298 K, 400 MHz, CDCl3): δ 29 (OPPh3), 23 (PPh4Cl), −5.5 (PPh3).
Physical Measurements
Matrix-assisted laser desorption/ionization (MALDI) time-of-flight (TOF) mass spectrometry data were obtained using an anthracene matrix on a Bruker ULTRAFLEX® III mass spectrometer equipped with a SmartBeam® laser in positive ion detection mode. ESI mass spectrometry data was collected on a Thermo Q Exactive Plus™ mass spectrometer and GC-MS data were collected on a Shimadzu GCMS-QP2010 Ultra spectrometer. 1H and 31P{1H} data were obtained using a Bruker Avance III 400 MHz spectrometer. UV/Vis spectra were obtained using a StellarNet Miniature BLUE-wave UV-Vis dip probe with a Tungsten-Krypton light source and a 10 mm path length tip. IR spectra were taken on a Bruker Tensor 27 spectrometer using an ATR adapter (no matrix). Cyclic voltammograms were taken on a BASi Potentiostat using Epsilon software in CH2Cl2 solutions with 0.1 M electrolyte and 1.0 mM substrate. The electrodes were as follows: glassy carbon (working), Pt wire (auxiliary) and Ag/Ag+ in CH3CN (reference). The potentials were referenced versus the ferrocene/ferrocenium redox couple by externally added ferrocene. Elemental analysis was performed by Midwest Microlab, LLC in Indianapolis, IN, USA.
EPR Spectroscopy
EPR data were acquired on a Bruker ELEXSYS E500 EPR spectrometer equipped with a Varian E102 microwave bridge interfaced with a Linux system. An Oxford Instruments ESR-900 continuous-flow helium flow cryostat and an Oxford Instruments 3120 temperature controller were used to control the sample temperature. A Hewlett-Packard 432A power meter was used for microwave power calibration, with measurement conditions as follows: for 2 – 9.3762 GHz, 4 G modulation amplitude, 2500 G center field, 5000 G sweep width, 5.024 mW power, 55 dB gain, 327.68 ms time constant, 10 ms conversion time, and 15 K; for 4 – 9.3765 GHz, 4 G modulation amplitude, 2500 G center field, 5000 G sweep width, 5.024 mW power, 60 dB gain, 655.36 ms time constant, 10 ms conversion time, and 10 K; for 4-hν/NO2• – 9.3765 GHz, 4 G modulation amplitude, 2500 G center field, 5000 G sweep width, 5.024 mW power, 60 dB gain, 655.36 ms time constant, 10 ms conversion time, and 10 K; for 5 – 9.3832 GHz, 4 G modulation amplitude, 2500 G center field, 5000 G sweep width, 5.024 mW power, 55 dB gain, 655.36 ms time constant, 10 ms conversion time, and 10 K. Spectral simulations were performed using the program EasySpin.37
X-ray Crystallographic Data Collection and Structure Determination
Crystallographic data were measured at the Molecular Structure Laboratory of the Chemistry Department of the University of Wisconsin–Madison. Suitable crystals of 4 and 5 were selected under oil and ambient conditions. For 4, a purple block shaped crystal with dimensions 0.728 × 0.374 × 0.216 mm3 was selected, and for 5 a purple plate crystal with dimensions 0.166 × 0.155 × 0.094 mm3 was chosen. The crystals were attached to the tip of a MiTeGen MicroMount©, mounted in a stream of cold nitrogen at 100(1) K, and centered in the X-ray beam using a video monitoring system. The crystal evaluation and data collection were performed on a Bruker Quazar SMART APEX-II diffractometer with Mo-Kα (λ = 0.71073 Å) radiation. The data were collected using a routine to survey the reciprocal space to the extent of a full sphere to a resolution of 0.70 Å for 4 and 0.80 Å for 5 and were indexed by the APEX program.38 The structures were solved via direct methods and refined by iterative cycles of least-squares refinement on F2 followed by difference Fourier synthesis. All hydrogen atoms were included in the final structure factor calculation at idealized positions and were allowed to ride on the neighboring atoms with relative isotropic displacement coefficients. Absorption corrections were based on a fitted function to the empirical transmission surface as sampled by multiple equivalent measurements.39 The systematic absences in the diffraction data were uniquely consistent with the space groups P21/c for 4 and P21/n for 5, yielding chemically reasonable and computationally stable results of refinement, and both structures were solved using direct methods using XS software.40 Compound 4 is a pseudo-merohedral twin with a twin component ratio of 54:46. The twin components are related by a 180° rotation about [1 0 0]. Compound 5 is a non-merohedral twin with a twin component ratio of 60:40. The twin components are related by 180° a rotation about [0 0 1].
Supplementary Material
Figure 6.
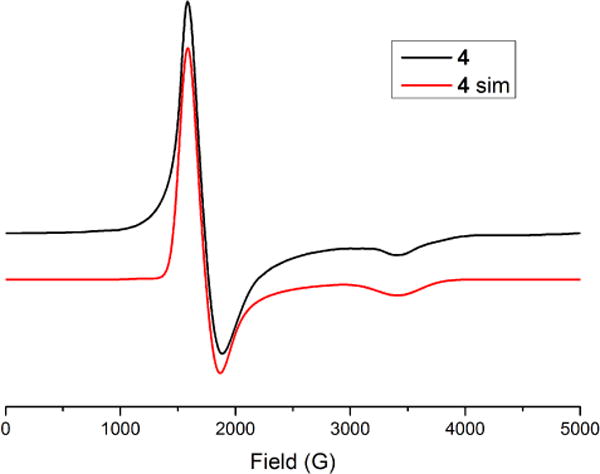
EPR spectrum and simulation of 4 recorded at 10 K.
Acknowledgments
We thank the U.S. Department of Energy, Chemical Sciences, Geosciences, and Biosciences Division, Office of Basic Energy Sciences, Office of Science (DE-FG02-10ER16204). A.R.C. thanks the National Science Foundation for a Graduate Research Fellowship (DGE-0718123). NMR and EPR facilities at UW-Madison are supported by the NSF (CHE-1048642 and CHE-0741901, respectively), and mass spectrometry instruments are funded by NIH (1S10 OD020022-1 and NCRR 1S10RR024601-01). We thank Dr. Ilia Guzei for crystallographic insights and Dr. Linghong Zhang for assistance with GC-MS measurements.
Footnotes
MALDI-MS and EPR spectra and simulations for 2 and 5; crystallographic data for 4 and 5, including tables for selected bond distances and angles; 31P{1H} NMR and ESI data for formation of (18)OPPh3. The Supporting Information is available free of charge via the Internet at http://pubs.acs.org.
Notes
The authors declare no competing financial interests.
References
- 1.(a) Yoon TP, Ischay MA, Du J. Nat Chem. 2010;2:527. doi: 10.1038/nchem.687. [DOI] [PubMed] [Google Scholar]; (b) Prier CK, Rankic DA, MacMillan DWC. Chem Rev. 2013;113:5322. doi: 10.1021/cr300503r. [DOI] [PMC free article] [PubMed] [Google Scholar]
- 2.(a) Pap JS, DeBeer George S, Berry JF. Angew Chem Int Ed. 2008;47:10102. doi: 10.1002/anie.200804397. [DOI] [PubMed] [Google Scholar]; (b) Long AKM, Yu RP, Timmer GH, Berry JF. J Am Chem Soc. 2010;132:12228. doi: 10.1021/ja1062955. [DOI] [PubMed] [Google Scholar]; (c) Long AKM, Timmer GH, Pap JS, Snyder JL, Yu RP, Berry JF. J Am Chem Soc. 2011;133:13138. doi: 10.1021/ja203993p. [DOI] [PubMed] [Google Scholar]; (d) Corcos AR, Long AKM, Guzei IA, Berry JF. Eur J Inorg Chem. 2013;3808 [Google Scholar]
- 3.(a) Schlangen M, Neugebauer J, Reiher M, Schröder D, López JP, Haryono M, Heinemann FW, Grohmann A, Schwarz H. J Am Chem Soc. 2008;130:4285. doi: 10.1021/ja075617w. [DOI] [PubMed] [Google Scholar]; (b) Izzet G, Ishow E, Delaire J, Afonso C, Tabet JC, Proust A. Inorg Chem. 2009;48:11865. doi: 10.1021/ic902046t. [DOI] [PubMed] [Google Scholar]; (c) Scepaniak JJ, Young JA, Bontchev RP, Smith JM. Angew Chem Int Ed. 2009;48:3158. doi: 10.1002/anie.200900381. [DOI] [PubMed] [Google Scholar]; (d) Schöffel J, Rogachev AY, DeBeer George S, Burger P. Angew Chem Int Ed. 2009;48:4734. doi: 10.1002/anie.200901494. [DOI] [PubMed] [Google Scholar]; (e) Hojilla Atienza CC, Bowman AC, Lobkovsky E, Chirik PJ. J Am Chem Soc. 2010;132:16343. doi: 10.1021/ja107288x. [DOI] [PubMed] [Google Scholar]; (f) Thomson RK, Cantat T, Scott BL, Morris DE, Batista ER, Kiplinger JL. Nat Chem. 2010;2:723. doi: 10.1038/nchem.705. [DOI] [PubMed] [Google Scholar]; (g) Scheibel MG, Askevold B, Heinemann FW, Reijerse EJ, de Bruin B, Schneider S. Nat Chem. 2012;4:552. doi: 10.1038/nchem.1368. [DOI] [PubMed] [Google Scholar]; (h) Scheibel MG, Wu Y, Stückl AC, Krause L, Carl E, Stalke D, de Bruin B, Schneider S. J Am Chem Soc. 2013;135:17719. doi: 10.1021/ja409764j. [DOI] [PubMed] [Google Scholar]; (i) Torres-Alacan J, Das U, Filippou AC, Vöhringer P. Angew Chem Int Ed. 2013;52:12833. doi: 10.1002/anie.201306621. [DOI] [PubMed] [Google Scholar]; (j) Zolnhofer EM, Käß M, Khusniyarov MM, Heinemann FW, Maron L, van Gastel M, Bill E, Meyer K. J Am Chem Soc. 2014;136:15072. doi: 10.1021/ja508144j. [DOI] [PubMed] [Google Scholar]; (k) Sieh D, Burger PZ. Anorg Allg Chem. 2015;641:52. [Google Scholar]; (l) Vreeken V, Siegler MA, de Bruin B, Reek JNH, Lutz M, van der Vlugt JI. Angew Chem Int Ed. 2015;54:7055. doi: 10.1002/anie.201501437. [DOI] [PubMed] [Google Scholar]; (m) Abbenseth J, Finger M, Wurtele C, Kasanmascheff M, Schneider S. Inorg Chem Frontiers. 2016;3:469. [Google Scholar]; (n) Camp C, Grant LN, Bergman RG, Arnold J. Chem Commun. 2016;52:5538. doi: 10.1039/c6cc02081j. [DOI] [PubMed] [Google Scholar]
- 4.(a) Smith JM. Prog Inorg Chem. 2014;58:417. [Google Scholar]; (b) Berry JF. Comments Inorg Chem. 2009;30:28. [Google Scholar]
- 5.(a) Nugent WA, Mayer JM. Metal-Ligand Multiple Bonds. John Wiley & Sons; New York: 1988. [Google Scholar]; (b) Yin G. Coord Chem Rev. 2010;254:1826. [Google Scholar]; (c) Winkler JR, Gray HB. In: Molecular Electronic Structures of Transition Metal Complexes I. Mingos DMP, Day P, Dahl JP, editors. Vol. 142. Springer; Berlin Heidelberg: 2012. p. 17. [Google Scholar]; (d) Ray K, Heims F, Pfaff FF. Eur J Inorg Chem. 2013;2013:3784. [Google Scholar]; (e) Chen Z, Yin G. Chem Soc Rev. 2015;44:1083. doi: 10.1039/c4cs00244j. [DOI] [PubMed] [Google Scholar]; (f) Ray K, Heims F, Schwalbe M, Nam W. Curr Opin Chem Biol. 2015;25:159. doi: 10.1016/j.cbpa.2015.01.014. [DOI] [PubMed] [Google Scholar]
- 6.(a) Moyer BA, Meyer TJ. J Am Chem Soc. 1978;100:3601. [Google Scholar]; (b) Moyer BA, Meyer TJ. Inorg Chem. 1981;20:436. [Google Scholar]; (c) Che CM, Wong KY, Mak TCW. J Chem Soc, Chem Commun. 1985;546 [Google Scholar]; (d) Che CM, Wong KY, Mak TCW. J Chem Soc, Chem Commun. 1985;988 [Google Scholar]; (e) Che CM, Lai TF, Wong KY. Inorg Chem. 1987;26:2289. [Google Scholar]; (f) Che CM, Tang WT, Lee WO, Wong WT, Lai TF. J Chem Soc. Vol. 2011 Dalton Trans; 1989. [Google Scholar]; (g) Che CM, Tang WT, Wong WT, Lai TF. J Am Chem Soc. 1989;111:9048. [Google Scholar]; (h) Dengel AC, Griffith WP, O’Mahoney CA, Williams DJ. J Chem Soc, Chem Commun. 1989;1720 [Google Scholar]; (i) Nagao H, Nishimura H, Kitanaka Y, Howell FS, Mukaida M, Kakihana H. Inorg Chem. 1990;29:1693. [Google Scholar]; (j) Power JM, Evertz K, Henling L, Marsh R, Schaefer WP, Labinger JA, Bercaw JE. Inorg Chem. 1990;29:5058. [Google Scholar]; (k) de Souza VR, Nunes GS, Rocha RC, Toma HE. Inorg Chim Acta. 2003;348:50. [Google Scholar]; (l) Huynh MHV, Meyer TJ. Chem Rev. 2007;107:5004. doi: 10.1021/cr0500030. [DOI] [PMC free article] [PubMed] [Google Scholar]; (m) Gagliardi CJ, Westlake BC, Kent CA, Paul JJ, Papanikolas JM, Meyer TJ. Coord Chem Rev. 2010;254:2459. [Google Scholar]; (n) Warren JJ, Tronic TA, Mayer JM. Chem Rev. 2010;110:6961. doi: 10.1021/cr100085k. [DOI] [PMC free article] [PubMed] [Google Scholar]
- 7.Man W-L, Lam WWY, Wong W-Y, Lau T-C. J Am Chem Soc. 2006;128:14669. doi: 10.1021/ja064975g. [DOI] [PubMed] [Google Scholar]
- 8.Wong K-Y, Che C-M, Yip W-H, Wang R-J, Mak TCW. J Chem Soc. Vol. 1417 Dalton Trans; 1992. [Google Scholar]
- 9.(a) Suslick KS, Acholla FV, Cook BR. J Am Chem Soc. 1987;109:2818. [Google Scholar]; (b) Suslick KS, Watson RA. Inorg Chem. 1991;30:912. [Google Scholar]
- 10.Kunkely H, Vogler A. J Am Chem Soc. 1995;117:540. [Google Scholar]
- 11.(a) Harischandra DN, Zhang R, Newcomb M. J Am Chem Soc. 2005;127:13776. doi: 10.1021/ja0542439. [DOI] [PubMed] [Google Scholar]; (b) Zhang R, Newcomb M. Acc Chem Res. 2008;41:468. doi: 10.1021/ar700175k. [DOI] [PMC free article] [PubMed] [Google Scholar]; (c) Zhang R, Vanover E, Luo W, Newcomb M. Dalton Trans. 2014;43:8749. doi: 10.1039/c4dt00649f. [DOI] [PMC free article] [PubMed] [Google Scholar]
- 12.Cheng M, Bakac A. J Am Chem Soc. 2008;130:5600. doi: 10.1021/ja8000453. [DOI] [PubMed] [Google Scholar]
- 13.(a) Nippe M, Goodman SM, Fry CG, Berry JF. J Am Chem Soc. 2011;133:2856. doi: 10.1021/ja1114248. [DOI] [PubMed] [Google Scholar]; (b) Brogden DW, Turov Y, Nippe M, Li Manni G, Hillard EA, Clérac R, Gagliardi L, Berry JF. Inorg Chem. 2014;53:4777. doi: 10.1021/ic5007204. [DOI] [PubMed] [Google Scholar]; (c) Brogden DW, Berry JF. Chem Commun. 2015;51:9153. doi: 10.1039/c5cc02917a. [DOI] [PubMed] [Google Scholar]
- 14.Villalobos L, Barker Paredes JE, Cao Z, Ren T. Inorg Chem. 2013;52:12545. doi: 10.1021/ic401588j. [DOI] [PubMed] [Google Scholar]
- 15.Goberna-Ferrón S, Peña B, Soriano-López J, Carbó JJ, Zhao H, Poblet JM, Dunbar KR, Galán-Mascarós JR. J Catal. 2014;315:25. [Google Scholar]
- 16.Ring S, Meijer AJHM, Patmore NJ. Polyhedron. 2016;103:87. [Google Scholar]
- 17.Xu G-L, Jablonski CG, Ren T. Inorg Chim Acta. 2003;343:387. [Google Scholar]
- 18.Dunlop K, Wang R, Stanley Cameron T, Aquino MAS. J Mol Struct. 2014;1058:122. [Google Scholar]
- 19.(a) Lever ABP, Mantovani E, Ramaswamy BS. Can J Chem. 1971;49:1957. [Google Scholar]; (b) Nakamoto K. Infrared and Raman Spectra of Inorganic and Coordination Compounds Part B: Applications in Coordination, Organometallic, and Bioinorganic Chemistry. 5th. John Wiley & Sons; New York: 1997. [Google Scholar]
- 20.Crystallographic data for Ru2(DPhF)4(NO3): space group = C2/c; unit cell dimensions a = 14.028 Å; b = 13.571 Å; c = 23.189 Å; β = 91.33°; Vol = 4413.60 Å3.
- 21.Gowda NMN, Naikar SB, Reddy GKN. In: Advances in Inorganic Chemistry. Emeleus HJ, Sharpe AG, editors. Vol. 28. Academic Press; 1984. p. 255. [Google Scholar]
- 22.Chakravarty AR, Cotton FA, Tocher DA. Inorg Chem. 1985;24:1263. [Google Scholar]
- 23.Bond distances and angles for minor component (8.82%) of another Ru(1) atom not reported here.
- 24.Based on a search of the Cambridge Structural Database.
- 25.Cherin P, Hamilton WC, Post B. Acta Cryst. 1967;23:455. [Google Scholar]
- 26.(a) Lin C, Ren T, Valente EJ, Zubkowski JD, Smith ET. Chemistry Letters. 1997;26:753. [Google Scholar]; (b) Bear JL, Han B, Huang S, Kadish KM. Inorg Chem. 1996;35:3012. doi: 10.1021/ic950956o. [DOI] [PubMed] [Google Scholar]; (c) Kadish KM, Garcia R, Phan T, Wellhoff J, Van Caemelbecke E, Bear JL. Inorg Chem. 2008;47:11423. doi: 10.1021/ic8017369. [DOI] [PubMed] [Google Scholar]; (d) Pap JS, Snyder JL, Piccoli PMB, Berry JF. Inorg Chem. 2009;48:9846. doi: 10.1021/ic901419w. [DOI] [PubMed] [Google Scholar]
- 27.Connelly NG, Geiger WE. Chem Rev. 1996;96:877. doi: 10.1021/cr940053x. [DOI] [PubMed] [Google Scholar]
- 28.Chakravarty AR, Cotton FA, Tocher DA, Tocher JH. Polyhedron. 1985;4:1475. [Google Scholar]
- 29.(a) Berry JF, Bill E, Bothe E, George SD, Mienert B, Neese F, Wieghardt K. Science. 2006;312:1937. doi: 10.1126/science.1128506. [DOI] [PubMed] [Google Scholar]; (b) Chen TH, Asiri N, Kwong KW, Malone J, Zhang R. Chem Commun. 2015;51:9949. doi: 10.1039/c5cc02852c. [DOI] [PubMed] [Google Scholar]
- 30.(a) The corresponding Ru–Ru≡N complex has been shown unambiguously to have an S = 1/2 ground state with an unpaired electron in the Ru–Ru δ* orbital.2 The addition of one more electron upon changing N to O is therefore expected to fill the δ* level yielding a diamagnetic ground state.; (b) DFT calculations comparing Ru2(chp)4O (6) in both singlet and triplet ground states were performed here. Results from both the BP86 and B3LYP functionals are in agreement that the favored electronic ground state for 6 is the singlet state. See SI for computational details.
- 31.(a) Atkins PW, Symons MCR. J Chem Soc. 1962;4794 [Google Scholar]; (b) Livingston R, Zeldes H. J Chem Phys. 1964;41:4011. [Google Scholar]; (c) Wertz JE, Bolton JR. Electron Spin Resonance: Elementary Theory and Practical Applications. Chapman and Hall; New York: 1986. p. 164. [Google Scholar]
- 32.(a) Rotlevi E, Treinin A. J Phys Chem. 1965;69:2645. [Google Scholar]; (b) Svoboda O, Kubelová L, Slavíček P. J Phys Chem A. 2013;117:12868. doi: 10.1021/jp4098777. [DOI] [PubMed] [Google Scholar]
- 33.(a) Madsen D, Larsen J, Jensen SK, Keiding SR, Thøgersen J. J Am Chem Soc. 2003;125:15571. doi: 10.1021/ja030135f. [DOI] [PubMed] [Google Scholar]; (b) Thøgersen J, Gadegaard A, Nielsen J, Jensen SK, Petersen C, Keiding SR. J Phys Chem A. 2009;113:10488. doi: 10.1021/jp906354c. [DOI] [PubMed] [Google Scholar]
- 34.Brown TR, Dolinar BS, Hillard EA, Clérac R, Berry JF. Inorg Chem. 2015;54:8571. doi: 10.1021/acs.inorgchem.5b01241. [DOI] [PubMed] [Google Scholar]
- 35.Lutterman DA, Degtyareva NN, Johnston DH, Gallucci JC, Eglin JL, Turro C. Inorg Chem. 2005;44:5388. doi: 10.1021/ic048377j. [DOI] [PubMed] [Google Scholar]
- 36.Lin C, Ren T, Valente EJ, Zubkowski JD, Smith ET. Chem Lett. 1997;26:753. [Google Scholar]
- 37.Stoll S, Schweiger A. J Magn Reson. 2006;178:42. doi: 10.1016/j.jmr.2005.08.013. [DOI] [PubMed] [Google Scholar]
- 38.APEX2. 2014 [Google Scholar]
- 39.(a) SADABS 2014/5. (b) TWINABS 2012/1.
- 40.XS 2013/1.
Associated Data
This section collects any data citations, data availability statements, or supplementary materials included in this article.