Abstract
The maximum achievable concentration of a drug in solution is dictated by the chemical potential of the solid form. Because an amorphous solid has a higher chemical potential than the corresponding crystal form, in the absence of phase transformations, a higher transient solubility is expected. However, the chemical potential of an amorphous drug can be reduced by mixing with another component. Therefore, upon mixing with a polymer to form an amorphous solid dispersion (ASD), the maximum solution concentration achieved can be potentially altered, in particular if the polymer is poorly soluble in the dissolution medium. Such changes in the chemical potential of the drug may be a critical factor in determining the maximum achievable solution concentration, and could alter the crystallization driving force of the drug. Therefore, the aim of this study was to gain insights into the impact of poorly soluble polymers on the “amorphous solubility” of drugs formulated as amorphous solid dispersions. Lopinavir was selected as a model drug with a low crystallization tendency, enabling determination of the amorphous solubility as a function of ASD composition. Model polymers included cellulose acetate (CA), CA phthalate (CAP), ethylcellulose (EC), Eudragit® RL PO (EUD), hydroxypropylmethylcellulose (HPMC), HPMC acetate succinate (HPMCAS), and HPMC phthalate (HPMCP). The “amorphous solubility” of the drug alone was determined and then the changes in maximum achievable concentration were measured as a function of drug loading. Drug-polymer interactions were characterized using infrared spectroscopy (IR), differential scanning calorimetry (DSC) and moisture sorption analysis. The results showed that the maximum achievable concentration (“amorphous solubility”) of lopinavir varied with the extent of drug-polymer interactions, as well as the drug weight fraction in the ASD. This information is of great value when evaluating the maximum achievable concentration of amorphous systems formulated with pH responsive polymers, and should contribute to a broader understanding of drug phase behavior in the context of ASDs.
Keywords: solubility, miscibility, drug release, polymer, thermodynamics
Graphical abstract
Introduction
An increasing number of new chemical entities suffer from poor aqueous solubility, which has been attributed to the increased diversity and complexity of molecules identified through high throughput screening assays [1-4]. This leads to an increased risk of compound failure due to solubility limited bioavailability. Hence, various drug delivery systems and formulation strategies, such as amorphous solid dispersions (ASDs)[5], addition of surfactants[6], cosolvents[7], and cyclodextrins[8], have been used to address this issue. Solubilization approaches are often accompanied by decreased apparent permeability[7, 9, 10], which ma y lead to compromised bioavailability in vivo. On the other hand, supersaturation, achieved by formulating a drug as an amorphous solid dispersion (ASD) or other metastable solid form, can enhance the free drug concentration, which corresponds to an increase in solute thermodynamic activity; the activity gradient provides the driving force for passive transport across a membrane[10, 11]. Therefore, the use of amorphous solid dispersions has become increasingly prevalent to deliver poorly soluble drugs.
Pure amorphous drugs are prone to crystallization due to their high free energy relative to the corresponding crystalline forms. As a result, various polymers are used to form amorphous solid dispersions and inhibit drug crystallization from both the solid matrix and the supersaturated solution generated upon dissolution[12-14]. Several enteric polymers including Eudragit and hydroxypropylmethylcellulose acetate succinate, have been used to formulate ASDs due to their processability allowing hot melt extrusion and spray drying, as well as their ability to inhibit solution-state crystallization [15, 16]. ASDs formulated with enteric polymers, which are largely insoluble at low pH, are expected to exist as suspensions in gastric conditions, assuming disintegration of the dosage form. In addition, insoluble polymers are used in controlled release formulations and implants, in the form of molecular dispersions, to regulate drug release rate [17-20]. The solubility of the polymer can alter the drug release mechanism and kinetics, from dissolution-controlled when polymers are soluble to diffusion-controlled when polymers are largely insoluble[21]. It has also been suggested that the internal microstructure (extent of mixing) of ASDs can affect the drug dissolution kinetics[22]. However, the impact of insoluble polymers on the maximum achievable concentration (the amorphous “solubility”) of a drug is poorly explored, and there is a substantial knowledge gap in terms of understanding the extent of supersaturation reduction by mixing with insoluble polymers. Elucidating the maximum achievable drug release from amorphous drug delivery systems containing insoluble polymers is important in the context of suspension stability[23], in terms of providing fundamental information about the extent of thermodynamic stabilization of the drug by the polymer, as well for insights into potential in vivo performance.
The maximum achievable free drug concentration of an amorphous substance is given by its “amorphous solubility”[24-26]. This value can be estimated from the crystalline solubility and the free energy difference between the crystalline form and the water-saturated amorphous form of the material. The “amorphous solubility” is not a true thermodynamic term, as the amorphous material is not in thermodynamic equilibrium with the solution since there is a driving force for conversion to the more stable crystalline form. However, if a metastable equilibrium can be maintained for sufficient time, the “amorphous solubility” can be measured[24, 25, 27]. Recently, it has been suggested that the maximum supersaturation of an amorphous drug can be reduced by the addition of a second drug when both components are miscible in the amorphous state[28, 29]. This observation has considerable potential implications for amorphous drug delivery systems; if solubility suppression were to occur when a drug is mixed with a polymer, supersaturation will be impacted with consequences for crystallization kinetics as well as bioavailability. A recent thermodynamic analysis of drug-polymer blends provides support for the concept of reduced amorphous solubility in such systems[30].
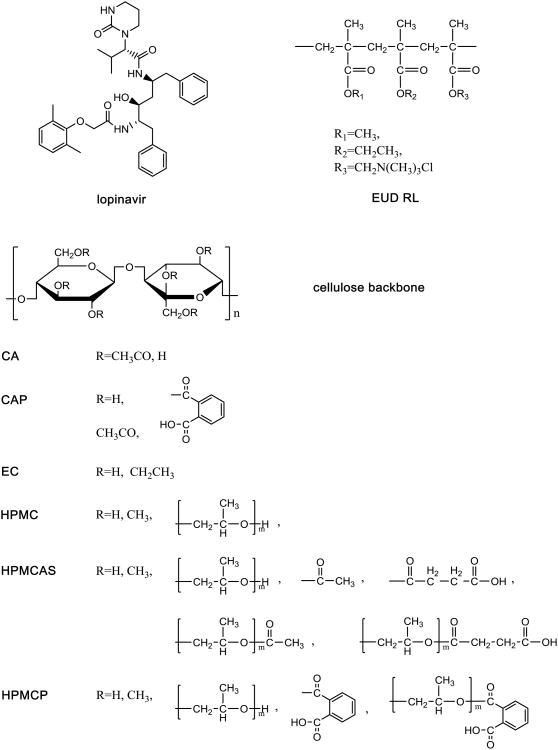
The goal of this study was to evaluate the solubility of poorly water-soluble drugs in the presence of various polymers that have lo w solubility in the dissolution medium, and to investigate the impact of drug-polymer interactions in the amorphous matrix on the system thermodynamics. The hypothesis is that the solubility of a poorly water soluble drug will be reduced when mixed with a poorly soluble polymer due to a dilution effect, whereby the strength of drug-polymer interactions will further affect the extent of solubility suppression. Lopinavir (LPV) was used as a model compound as it has a slow crystallization rate from aqueous solution enabling the supersaturation to be determined after several hours of equilibration with aqueous media[23]. Water-insoluble polymers, cellulose acetate (CA), ethylcellulose (EC), and Eudragit® RL PO (EUD), as well as enteric polymers, cellulose acetate phthalate (CAP), hydroxypropylmethylcellulose acetate succinate (HPMCAS), and HPMC phthalate (HPMCP), which are practically insoluble at low pH, were used as model insoluble polymers within the experimental conditions tested. Hydroxypropylmethylcellulose (HPMC) is water soluble and therefore was used as a positive control. The molecular structures of the model drug and polymers are shown in Figure 1.
Figure 1. Chemical structure of LPV and polymers.
Materials and Methods
Materials
Lopinavir was purchased from Chemshuttle (Wuxi, China). HPMCAS (HF grade) and HPMCP polymers were obtained from Shin-Etsu (Tokyo, Japan). HPMC (Methocel E5) and ethylcellulose NF (Ethocel) were obtained from the Dow Chemical Company (Midland, MI). Cellulose acetate (40% acetyl groups) and cellulose acetate phthalate were obtained from Fluka (Honeywell Specialty Chemicals Seelze GmbH, Seelze, Germany). Eudragit® RL PO was obtained from Röhm Pharma Polymers (Röhm GmbH, Sontheim/Brenz, Germany). HPLC grade methanol, acetonenitrile, and dichloromethane were purchased from Mallinckrodt Baker (Phillipsburg NJ). All other chemicals (citric acid and sodium citrate dihydrate) were purchased from SigmaAldrich (St. Louis, MO).
A total amount of 8.215 g citric acid anhydrous and 2.130 g sodium citrate dihydrate were dissolved in water to a final volume of 1000 mL to prepare 50 mM pH 3 citric acid buffer.
Methods
Solubility determination
An excess amount of crystalline lopinavir powder was added to 10 mL of pH 3 citric acid buffer in the absence or presence of an excess amount of each polymer of interest. These mixtures were kept at 25±1° and stirred at 300 rpm for 48 hours. Ultracentrifugation was performed to separate excess solids using an Optima L-100XP ultracentrifuge (Beckman Coulter Inc, Brea, CA). Samples were spun at 35000 rpm and 25°C for 30 min using a 70.1 Ti rotor. Half a milliliter of the supernatant was taken and mixed with 0.5mL of 1:1 water : acetonitrile solvent for high performance liquid chromatography (HPLC) analysis. All samples were prepared in triplicate.
Liquid-liquid phase separation (LLPS) concentration determination
The onset LLPS concentration of lopinavir was determined by ultraviolet (UV) spectroscopy. The onset LLPS concentration has been found to be in good agreement with the “amorphous solubility”. An SI photonics UV/vis spectrophotometer equipped with a 1 cm path length fiber optic dip probe (Tuscon, AZ) was used. LPV methanolic stock solution of 5 mg/mL was titrated into 15 mL of pH 3 citric acid buffer solutions using a syringe pump (Harvard Apparatus, Holliston, MA) at a flow rate of 40 μL/min. The solution was pre-equilibrated at 25°C and stirred at 300 rpm. The LLPS onset concentration was determined at the concentration where the UV scattering intensity at 300 nm (a non-absorption wavelength) started to increase[24]. A UV wavelength scan was performed from 200 nm to 450 nm every 10s. LPV concentration was back calculated using UV absorption values at 206 nm and a calibration curve covering the concentration range of 5 μg/mL to 25 μg/mL. Triplicate experiments were conducted.
The “amorphous solubility” of lopinavir was also determined by measuring the solution concentration evolved from an LPV-HPMC ASD at 25±1°C after 48 hours. Briefly, films of LPV-HPMC with a 10% drug loading containing a total of 0.3 mg lopinavir were prepared by solvent evaporation directly from scintillation vials using a rotary evaporator. A total of 10 mL pH 3 buffer was added. Solution concentration measurements were conducted following the procedures described above.
Determination of LPV release from ASDs
Stock solutions of lopinavir, polymer, and drug-polymer mixtures were prepared at a solid content of 2 mg/mL using 1:1 (v:v) methanol : dichloromethane binary solvent. One mL of each stock solution was transferred to a 20mL scintillation vial. Thin films were then prepared by rotary evaporation directly from scintillation vials to prepare amorphous drug, polymer, and ASDs for solubility evaluation; this approach provides a high surface area of the ASD to promote equilibration with the solution phase.
Ten milliliters of pH 3 buffer were added into each vial with the ASD film. These mixtures were stirred at 300 rpm and kept at 25±1°C. At predetermined time points, triplicate samples were filtered using 0.45 μm cellulose acetate syringe filters. The first few milliliters of filtrate were used to saturate the filter with drug and hence were discarded. Half a milliliter of filtrate was diluted with 0.5 mL 1:1 water:acetonitrile solvent (to prevent LPV crystallization) and then analyzed with HPLC. To determine the maximum achievable solution concentration of lopinavir from ASDs formulated with insoluble polymers, 20 μg/mL HPMC was added to prevent crystallization from the supersaturated solution of lopinavir. The addition of HPMC is not expected to alter the drug solubility, as the HPMC concentration used was very low (20 μg/mL). Solubility values reported in Table 1 confirmed lopinavir amorphous solubility remained unchanged in the presence of as much as 170 μg/mL HPMC.
Table 1. Crystalline and “amorphous solubility” values of lopinavir at 25°C.
| Compound | Crystalline solubility at pH3 (μg/mL) | Amorphous solubility (μg/mL) |
|---|---|---|
| Lopinavir | 3.1±0.1 | 17.4±0.3 (pH3, 48h equilibrium, with HPMC) 18±2 (pH3, LLPS, UV extinction) 16 (pH6.8, LLPS, fluorescence[29]) 17.1±0.2 (pH6.8, LLPS, ultracentrifuge[29]) 16.1±0.5 (pH6.8, LLPS, diffusion[29]) |
| w/ HPMCAS | 2.6±1.5 | -- |
| w/ EUD | 3.1±0.2 | -- |
| w/ CAP | 3.0±0.2 | -- |
| w/ CA | 2.8±0.0 | -- |
| w/ EC | 3.6±0.2 | -- |
| w/ HPMCP | 3.4±0.5 | -- |
For maximum achievable solution concentration determination (48 hour time point), samples were ultracentrifuged prior to HPLC analysis. Lopinavir release was sampled at 3 hour and 48 hour, where 3 hour is a reasonable time frame to represent gastric transition time of enteric polymer-based ASDs[31], and 48 hour is an empirical time frame chosen for solubility measurements[23, 32].
For suspension stability evaluations, buffer solutions without HPMC was used; matrix crystallization at 8, 16, 24, 36, and 48 hours was monitored using a Nikon Eclipse E600 Pol microscope, equipped with NIS-Elements software package (Nikon Co., Tokyo, Japan).
High performance liquid chromatography
An Agilent 1260 Infinity series HPLC (Agilent Technologies, Santa Clara, CA) equipped with a Waters XTerra RP C-18 column (150 mm × 4.6 mm, i.d. 3.5 μm) (Waters Corp., Milford, MA) was used. An isocratic elution method of 60% acetonitrile and 40% water was used. LPV was detected at 210 nm with an injection volume of 50 μL and a flow rate of 1 mL/min. The total run length was 7 min. Standard curves covering the concentration ranges of 1-19 μg/mL and 0.1-1 μg/mL were used.
Differential scanning calorimetry (DSC)
Amorphous drug polymer, and ASD samples were prepared by solvent evaporation. Briefly, a total of 200 mg solids were weighed in a 20 mL scintillation vial and completely dissolved in an excess amount of 1:1 methanol : dichloromethane solvent. Amorphous solids were prepared directly from the scintillation vial using a rotary evaporator. All samples were freshly prepared and stored in a vacuum oven overnight prior to DSC analysis.
The glass transition temperature (Tg) of these samples were measured using a TA Q2000 DSC equipped with an RCS90 refrigeration unit (TA Instruments, New Castle, DE). Samples were equilibrated at 20°C, and then heated at 5°C/min with a modulation of ±1°C every 60 seconds to the temperature of interest. Samples were then cooled to 20°C, and reheated at 5°C/min with a modulation of ±1°C every 60 seconds. The scan maximum temperature was 250°C for CA 200°C for CAP, 180°C for EC, 150°C for EUD, 170°C for HPMCAS, and 210°C for HPMCP and their corresponding ASD systems respectively. LPV was heated to 210°C. The first heating cycle was used to eliminate the thermal history of samples, and the second cycle was used for data collection. The Tgs of EUD containing systems were taken from the first heating cycle as the Tg of the pure polymer EUD disappeared in the second cycle.
For moisture treated samples, dry ASD powders were weighed in Tzero aluminum pans (TA Instruments, New Castle, DE), and then stored in a desiccator over saturated potassium sulfate solutions at 25±1°C (97% RH[33]) for 48 hours. These samples were then sealed with Tzero hermetic lids (TA Instruments, New Castle, DE) and analyzed using DSC. Tgs were recorded from the second heating cycle except for EUD containing systems.
Infrared spectroscopy (IR)
Polymers, and LPV-polymer mixtures at different ratios were weighed and dissolved in 1:1 (v/v) methanol:dichloromethane solutions to a final solid content of 50 mg/mL. For lopinavir stock solutions, a final concentration of 150 mg/mL was used. Thin films of LPV, polymers, and ASDs at different drug loadings were prepared by spin coating 20 μL of the stock solution on KRS-5 substrates (Harrick Scientific Corporation, Ossining NY). A spin coater (Chemat Technology Inc, Northridge, CA) was used. A two-stage spin-coating procedure was adopted, with the first stage of 12s at 50 rpm followed by a second stage of 30s at 3100 rpm. All experiments were carried out in a glove box with dry air purge at RHs below 18% to eliminate water vapor induced phase separation. The finished films were then dried in a vacuum oven at 25°C overnight to remove residual solvent and stored in desiccators with Drierite® prior to analysis.
IR spectra were measured using a Bruker Vertex 70 FTIR spectrometer (Bruker Co., Billerica, MA). A total of 128 scans was collected for both background and sample spectra. OPUS software (version 7.2, Bruker Optik GmbH) was used for spectra collection and analysis.
Moisture sorption analysis
Moisture sorption profiles were measured using a SGA-100 symmetrical gravimetric analyzer (TA Instrument, New Castle, DE). Powdered amorphous material (10-20 mg) was dried at 60°C and 0% RH in the instrument for 60min. Following drying, samples were exposed to increasing relative humidity (RH) steps ranging from 10% to 90% with a maximum step time of 180 min. The equilibrium criteria were set to be 0.01% (w/w) within 2 min and 5 min for the drying step and RH ramp respectively. Nitrogen was used as the purge gas.
For additive prediction, the following equation was used to calculate the moisture sorption isotherm:
| (1) |
where M is the equilibrium moisture content, w is the weight fraction, D and P indicate drug and polymer respectively.
Results
Physicochemical properties of lopinavir and polymers
Lopinavir has a crystalline solubility of approximately 3 μg/mL and an amorphous solubility of 16-18 μg/mL at 25°C (Table 1). In the presence of trace amount of polymers at acidic conditions, the crystalline solubility values of lopinavir were similar with slight variations as shown in Table 1.
Maximum achievable LPV concentration of LPV-ASDs
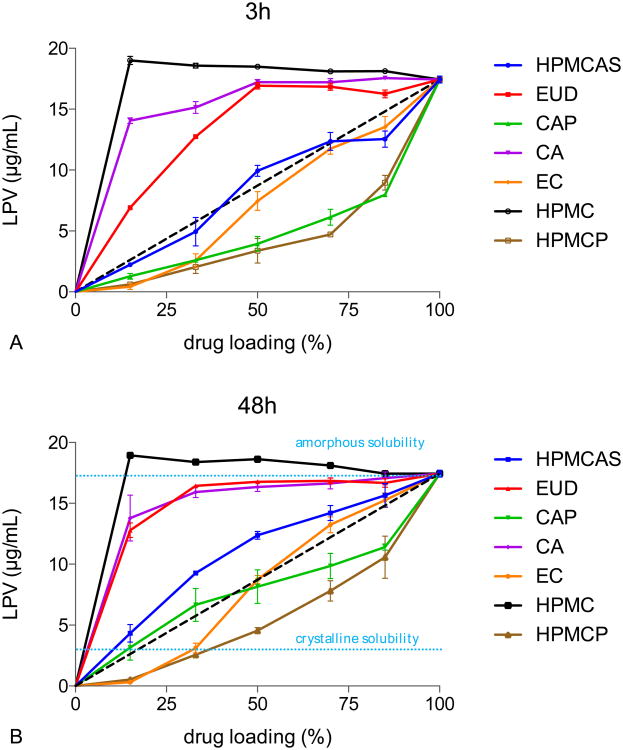
Lopinavir solution concentrations were determined 3 h and 48 h after incubation at pH 3 and results are shown in Figure 2. HPMC is soluble in pH 3 buffer and therefore ASDs formulated with this polymer were used as a positive control.
Figure 2.
LPV concentrations from LPV-polymer ASDs at pH 3 after A) 3h and B) 48h. dash line: ideal behavior. The amorphous solubility of lopinavir (17.4μg/mL) is used for the 100% drug loading point. 20 μg/mL of HPMC was added to the buffer to inhibit solution crystallization of lopinavir, thereby enabling the maximum release of LPV from the various amorphous solid dispersions to be directly compared.
In LPV-HPMC ASDs, no variations in LPV concentration were observed for drug loadings from 15% to 85% and LPV concentration reached the amorphous solubility at all drug loadings tested. For ASDs formulated with polymers that are essentially insoluble under the test conditions, the concentration of LPV increased with increasing drug loading. The maximum achievable concentration of LPV, however, was suppressed by the presence of the polymer, with the extent of solubility suppression varying dependent on the specific polymer employed. After 48h, HPMCP ASDs yielded the lowest achievable lopinavir concentration, while EUD and C A had much lower impacts whereby the concentration of LPV approached the amorphous solubility. HPMCAS suppressed lopinavir release to a moderate extent, whereby the concentrations observed were slightly above what would be expected from ideal mixing behavior (diagonal). CAP systems at 15% to 50% drug loading and EC systems at 50% to 85% drug loading exhibited nearly ideal behavior at 48h, falling on the diagonal of the graph. Above 50% drug loading, CAP seemed to suppress lopinavir solubility to a greater extent; whereas EC suppressed lopinavir release more at drug loadings below 50%.
Similar depression in LPV concentration was also observed at 3h, with slightly less LP V released than for systems measured after 48h. This can be attributed to differences in lopinavir release kinetics in the presence of different polymers. Lopinavir release from HPMC, EC and CA ASDs were similar at both time points, indicating fast drug release from these systems. HPMCAS, CAP, and HPMCP systems showed increased lopinavir release at 48h relative to 3h.
LPV release was also measured up to 7 days (data not shown). The general dependence of solubility suppression with drug loading remained the same, with slight concentration variations over time. This may be due to polymer degradation, in particular hydrolysis, during long term suspension in aqueous media [34-36].
Attempts were made to evaluate polymer solubility using the sulfuric acid-phenol colorimetric method for cellulose derivatives[23]. Unfortunately, most values fell below the limit of detection and hence the polymer solubility could not be studied.
Stability Against Crystallization
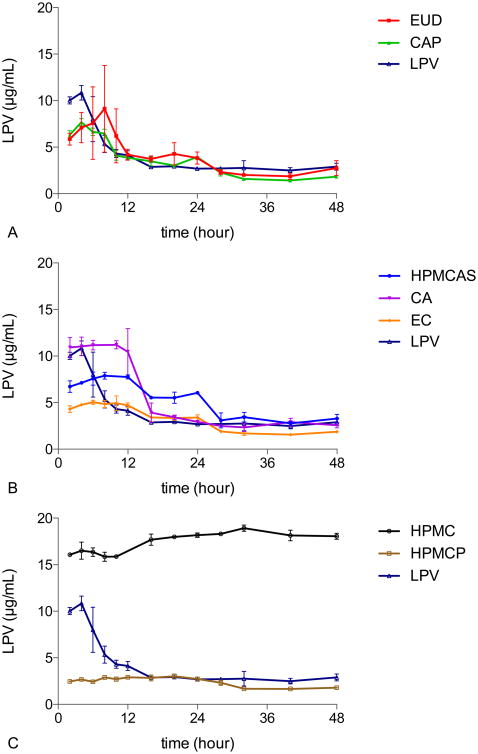
The stability of lopinavir ASDs against crystallization in pH 3 buffer, based on concentration-time profiles, is shown in Figure 3 where HPMC ASDs and pure amorphous lopinavir serve as controls. Unlike for the data shown in Figure 2, no crystallization inhibitor was pre-dissolved in the buffer. Therefore, inhibition of LPV crystallization is dependent on the inhibitory properties of the polymer used to form the ASD and the degree of LPV supersaturation. The various systems can be classified as showing fast, intermediate, or slow crystallization in spite of differences in the degree of drug supersaturation. EUD and CAP are poor crystallization inhibitors, whereby their ASDs generate supersaturation that is short lived due to crystallization; these systems crystallize in a similar timeframe to amorphous lopinavir. HPMCAS, CA, and EC retained supersaturation for 12 hours, considerably longer than for pure amorphous LPV. HPMCP ASDs did not crystallize for the duration of the experiment, showing a lower, but protracted level of supersaturation.
Figure 3. The impact of polymer type in the ASD on solution crystallization kinetics of LPV in 50% LPV-polymer systems. A) EUD and CAP dispersions. B) HPMCAS, CA.
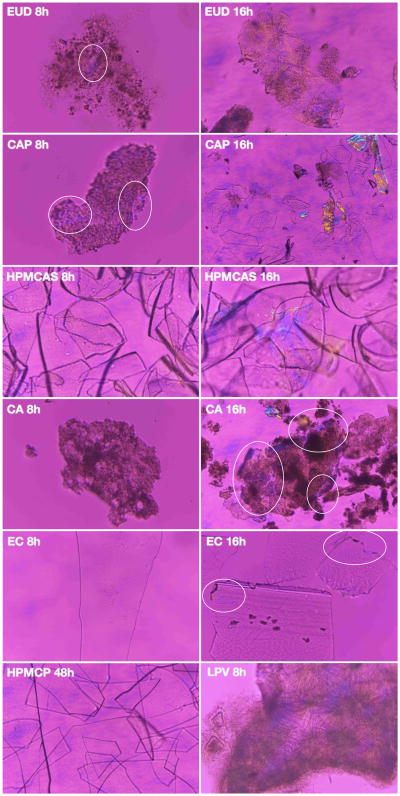
Crystallization in the ASD matrix was also monitored using polarized microscopy, and selected images are shown in Figure 4. Similar trends were observed in both solution and the solid matrix, with EUD and CAP being least effective polymers to inhibit crystallization while ASDs made with HPMCP showed no crystallization.
Figure 4. The impact of polymer on matrix crystallization kinetics of LPV in 50% LPV-polymer systems.
Mixing of LPV and polymers
Drug-polymer interactions in the dry state
Glass transition temperature of LPV ASDs
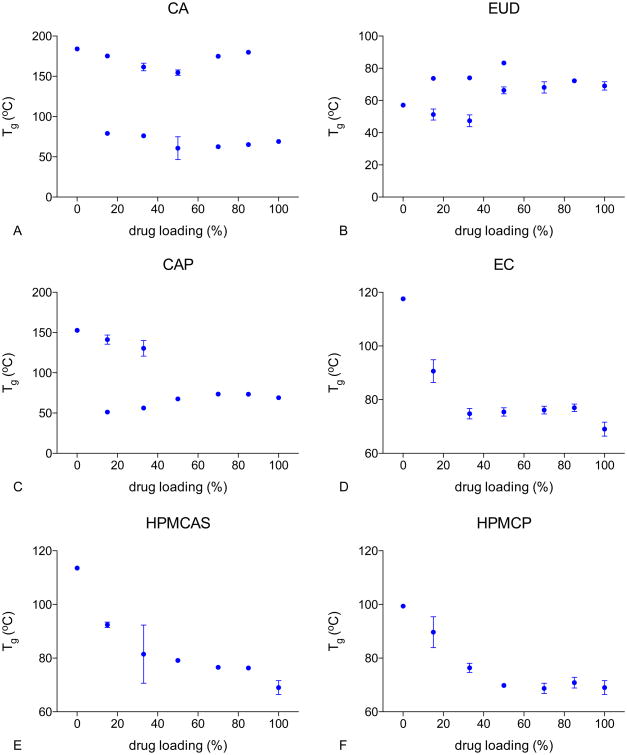
Tg values for dry amorphous drug and polymers were 69°C (LPV), 184°C (CA), 153°C (CAP), 118°C (EC), 57°C (EUD), 114°C (HPMCAS), and 99°C (HPMCP). Plots of Tg versus drug loading of different ASDs are given in Figure 5A-F. Two Tgs, close to the Tgs of the pure components, were identified for drug loadings between 15% and 85% for LPV-CA ASDs, indicating that LPV was largely immiscible with CA at all compositions investigated herein. For LPV-EUD ASDs, two Tgs were observed for ASDs with drug loadings of 15% to 50%. A single glass transition event was observed at higher drug loadings (70% and 85%). It is probable that the two Tgs were close and therefore could not be resolved.
Figure 5. Glass transition temperature of the various freshly prepared lopinavir-polymer ASDs.
For LPV-CAP systems, two Tgs were observed for 15% and 33% drug loadings. This system exhibited a single Tg at 50% drug loading and above, indicating possible increased miscibility with increasing drug loading.
In contrast, EC, HPMCAS, and HPMCP ASDs showed a single glass transition event across all drug loading suggesting drug-polymer miscibility for these systems.
Intermolecular interactions assessed by IR spectroscopy
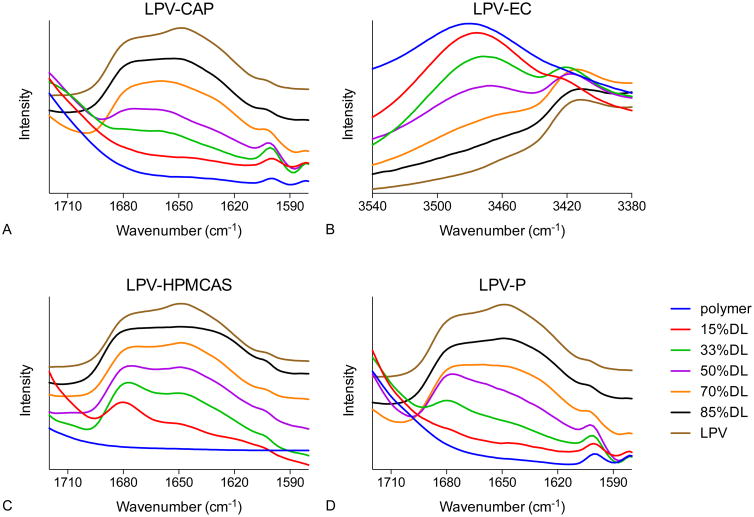
The infrared spectra of spin-coated films of lopinavir, polymers, and ASDs are shown in Figure 6. Amorphous lopinavir shows a doublet at 1648 cm-1 and 1674 cm-1, whereas amorphous CAP, HPMCAS, and HPMCP have no significant peaks in this region. These peaks may be assigned to C=O stretching of the drug amide groups[37]. For LPV-CAP ASDs, the peak at 1648 cm-1 gradually decreased in intensity as the polymer content increased, and the doublet evolved to a single broad peak at 1660 cm-1. In HPMCAS and HPMCP-based ASDs, with decreasing drug loading the peak at 1674 cm-1 became more intense than the peak at 1648 cm-1. For EC based ASDs, no spectral shift was observed in the carbonyl region.
Figure 6. IR spectra of lopinavir-polymer ASDs showing peak shifts.
However, in the spectral region of 3440-3540 cm-1 where the O-H stretching band is located, amorphous EC shows a peak at 3481 cm-1 and amorphous lopinavir has no peak. With the addition of lopinavir, this peak shifted to 3470 cm-1, consistent with a change in hydrogen bond interactions in the presence of the drug. No peak shifts in IR spectra were observed in LPV-CA and LPV-EUD systems (data not shown).
Interactions with water
Moisture sorption profile measurements
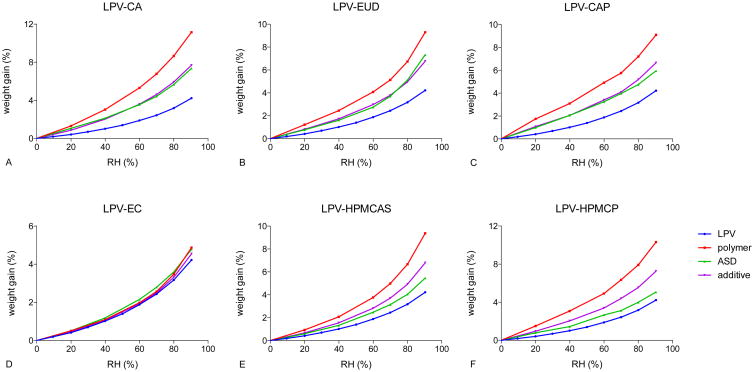
Moisture sorption profiles of ASDs at a 50% drug loading with different polymers are shown in Figure 7. In LPV-CA, LPV-EUD, and LPV-CAP systems, the moisture sorption profiles are in close agreement with the predicted profiles calculated using Equation 1, based on additive contributions from the amorphous drug and the polymer. ASDs of LPV-HPMCAS and LPV-HPMCP yielded profiles that showed less moisture gain than predicted. For LPV-EC systems, the polymer and the drug absorbed comparable amounts of moisture, which made it difficult to distinguish any differences.
Figure 7. Moisture sorption isotherms of 50% LPV-polymer systems.
Crowley et al. reported reduced moisture sorption into amorphous solid dispersions relative to predictions based on weighted contribution of the drug and the polymer as a result of drug-polymer intermolecular interactions[38]. Therefore, results shown in Figure 7, taken in conjunction with the DSC experiments which show two Tgs, suggest negligible drug-polymer interactions in LPV ASDs with CA and EUD at a 50% drug loading. HPMCAS- and HPMCP-based ASDs showed substantial moisture sorption reduction compared to the additive model, suggesting molecular interactions between the drug and the polymer. Further, HPMCP alone absorbed more moisture than HPMCAS alone, but the 50% LPV-HPMCP ASD absorbed a lower amount of moisture than the 50% LPV-HPMCAS ASD (Figure 7E and F). This observation may indicate stronger drug-polymer interactions in HPMCP systems relative to HPMCAS systems.
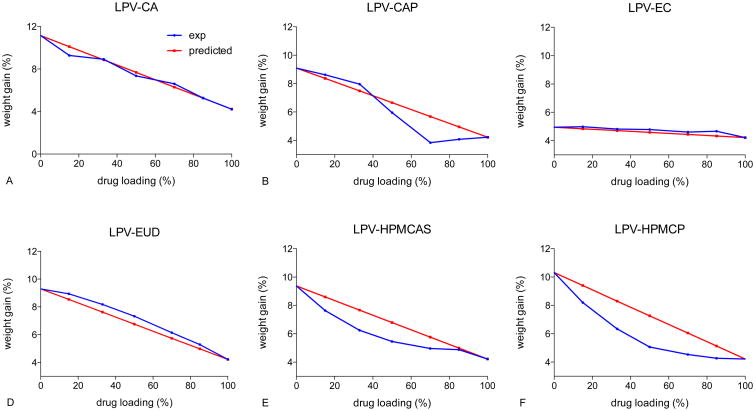
The differences in the experimental and predicted moisture contents of ASDs at different drug loadings exposed to 90% RH are shown in Figure 8. For CA and EUD systems, the experimental moisture sorption profiles are similar to the calculated values. This indicates a comparable level of interactions between water and the ASD as for the individual components consistent with a lack of miscibility. It should be noted that for LPV-EC systems, the polymer and drug absorbed similar amounts of water and therefore it is difficult to discern differences. For lopinavir-CAP ASDs, the amount of moisture absorbed by ASDs below 50% drug loading was similar to the predicted values. At drug loading above 50%, ASDs absorbed a significantly lower amount of water compared to the additive prediction, suggesting increased drug-polymer interactions at drug loadings above 50%. For HPMCAS- and HPMCP-containing ASDs, experimental moisture sorption at 90% RH was lower than predicted values for both systems. This suggests that HPMCP and HPMCAS have stronger interactions with lopinavir as compared to CA and EUD.
Figure 8. Moisture content of LPV-polymer systems exposed at 90% RH.
Glass transition temperatures of ASDs following high RH exposure
ASDs were equilibrated at 97% RH for 48 hours, and Tg values for these samples are shown in Figure A in supplemental information. Similar trends were observed with (Figure A supplemental information) and without (Figure 5) absorbed water. EC, HPMCAS, and HPMCP-based amorphous solid dispersions remained one phase in the presence of water, with lower Tg values than dry ASDs. Two Tgs were seen at all drug loadings for LPV-CA systems, suggesting phase separation. Lopinavir and EUD have similar Tg values in the presence of water, and therefore only one Tg could be distinguished. LPV-CAP ASDs showed increased miscibility with increasing drug loading and appeared to be miscible at drug loadings above 15%. These results suggested that the presence of absorbed water at 97% RH did not alter the phase behavior of these ASDs compared to the dry state.
Discussion
Theoretical considerations
The thermodynamic basis for the solubility advantage of an amorphous compound relative to the crystalline form has been extensively discussed in the literature[25, 27, 39-41]. The magnitude of the solubility enhancement is dictated by the extent to which chemical potential of the amorphous form exceeds that of the crystal. This can be expressed as:
| (2) |
Where is the solubility ratio of the amorphous and crystalline forms, and μA and μC are the chemical potentials of the drug in the amorphous and crystalline materials respectively, R is the gas constant and T is temperature. Several comments need to be made about Equation 2. First, an inherent assumption in this equation is that the drug activity coefficient in the aqueous solution shows minimal concentration dependence between the amorphous and crystalline solubilities. Second, being able to measure the amorphous solubility requires attainment of an equilibrium between the drug in the amorphous form, and the aqueous solution. Factors hampering attainment of this equilibration include crystallization to a more thermodynamically stable form, ingress of water into the amorphous material thereby changing the composition, and changes in the thermodynamic properties of non-ergodic glasses e.g. relaxation, within the timeframe of the experiment. Notwithstanding these issues, reasonable success has been achieved in demonstrating correlations between predictions made with Equation 2, and measured experimental amorphous solubility values for simple systems comprising mixtures of drug and water, in particular after taking into account the water content of the hydrated amorphous material and its impact on the chemical potential of the drug[10, 14, 26, 40, 42, 43].
However, amorphous formulations are typically more complex than the situation described above, consisting of a drug and a polymer, ideally blended at a molecular level. Mixing the drug with the polymer leads to a decrease in the chemical potential of the drug relative to in the pure amorphous phase. For miscible drug-polymer systems, Flory-Huggins (FH) theory has been used to model the change in drug chemical potential in the presence of different amounts of polymer[44, 45]. However, during dissolution, the situation becomes increasingly more complex. The simplest situation, where the drug is molecularly mixed with a poorly soluble polymer, has been recently modeled by Huang et al[30]. In their model, FH theory is used to describe the change in drug chemical potential upon mixing with the polymer, while the Gibbs-Duhem (GD) equation is employed to account for changes in drug chemical potential due to water absorption by the ASD.
The chemical potential difference between the amorphous and crystalline drug is given by [30]:
| (3) |
Where ΔGA–C(T), ΔHA–C(T), and ΔSA–C(T) are the changes of Gibbs energy, enthalpy, and entropy of the amorphous and crystalline drug at the experimental temperature, T, ΔHm is the heats of fusion, Tm is the melting temperature, and Cp,L and Cp,X are the heat capacity of the liquid and the crystal.
Drug chemical potential difference caused by mixing with the polymer (FH theory) is described by [30]:
| (4) |
Where Δμdrug is the change of drug chemical potential, Φdrug and Φpoly are the volume fraction of the drug and the polymer, r is the volume ratio of the polymer and the drug ( where V is volume), and χ is the interaction parameter.
Drug chemical potential changes caused by water sorption (GD equation) is expressed as [30]:
| (5) |
Where xdrug, xdrug, and xwater are the mole fractions of the drug the polymer, and water, and awater is the water activity.
Combining equations 2, 3, 4, and 5, the Huang model is given by the following equation [30]:
| (6) |
Where is the solubility of the drug formulated in an ASD.
From the FH equation, it is clear that a low drug loading and a more negative value of the interaction parameter will reduce the solubility of the drug relative to the pure amorphous form. From the GD equation, it is apparent that greater water absorption by the ASD during equilibration will reduce the drug chemical potential and hence solubility; this will be further compounded if there are favorable interactions between drug and water.
The above model is only applicable to an ASD system where the drug and polymer are mixed, forming a one phase ASD, and remaining as a one phase ASD following hydration after immersion in water. Further, the polymer must be largely insoluble in the medium of interest so that the composition of the ASD does not substantially change during the experiment. This situation is exemplified by an ASD formulated with an enteric polymer such as HPMCAS. At low pH, the polymer has very low solubility, and the observed solubility of the drug can be expected to show some dependency on the factors described by Equations 4 and 6. However, given that the model does not account fo r changes in the drug-polymer interaction parameter in the presence of water which are known to occur[46], coupled with the well-established issues with experimentally determining the drug-polymer χ parameter, the Huang model is probably best applied in a qualitative manner to rationalize observed trends in solubility data, rather than for quantitative predictions.
In addition, there is no model currently available to describe the solubility and dissolution behavior of ASDs formulated with water soluble polymers. For ASDs with highly soluble polymers and low drug loadings, it has been noted that the dissolution rate of the drug is coupled to that of the polymer[47, 48]. This leads to rapid dissolution, a solution concentration that exceeds the drug amorphous solubility, and precipitation of a colloidal amorphous drug-rich phase. Hence in this instance, the maximum supersaturation is limited by the amorphous solubility of the drug[49]. For ASDs with highly soluble polymers and high drug loadings, the polymer may dissolve faster than the drug, leading to a drug-rich interface, where the dissolution rate and final solution concentration are limited by the properties of the amorphous drug at the interface[47]. For water soluble polymers, due to the high solubility differential between the polymer and the drug, the amorphous solubility of the drug is not typically impacted by the presence of the polymer, in particular at low polymer concentrations. This is seen in Figure 2 when considering the HPMC ASDs. The polymer dissolves readily in water, and the maximum concentration observed is dictated by the amorphous solubility of lopinavir, where no ASD composition dependence is observed. In other words, the ASD dissolves rapidly to a high concentration with the formation of an amorphous drug-rich phase, and the polymer is not substantially mixed with the drug droplets due to its high aqueous solubility.
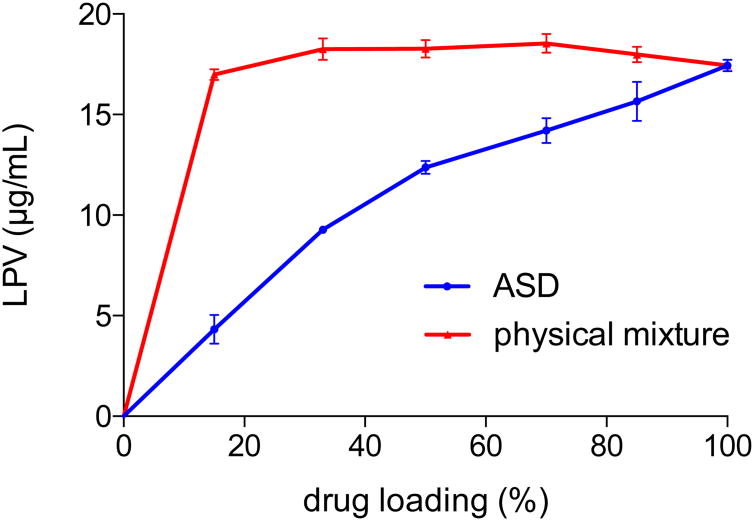
For ASDs that are phase separated, components in the amorphous phases are not intimately mixed with each other, and thereby behave independently of one another during the solution equilibration process. Thus Equations 4 and 6 are not applicable. This situation can be illustrated by comparing the solution concentrations achieved for a physical mixture of amorphous LPV and HPMCAS versus with a miscible ASD (Figure 9). Solubility suppression was clearly not observed for the physical mixtures, whereas composition dependent solubility suppression was seen for the miscible ASDs (determined to be miscible based on DSC and FTIR analyses).
Figure 9. LPV concentrations from LPV-HPMCAS systems at pH 3 and 48h.
Miscible Systems - Correlation between solubility suppression, and strength of drug-polymer interactions
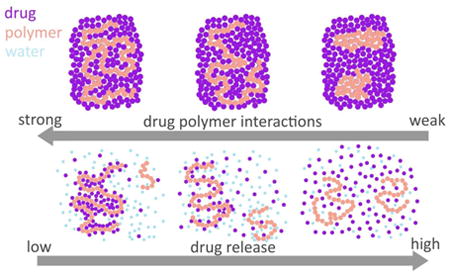
Based on Equations 4 and 6, variations in the strength of drug-polymer interactions will lead to different extents of solubility suppression at a given drug loading, by altering the value of the interaction parameter, χ. The pattern of solubility suppression as a function of drug loading can be classified into three patterns of behavior, depending on the strength of drug-polymer interactions in the presence of absorbed water, as summarized by the schematic shown in Figure 10. For the purpose of the schematic, the contribution from the absorbed water is considered to be a constant across all systems.
Figure 10. Schematic representing drug-polymer interactions and their impact on solubility.
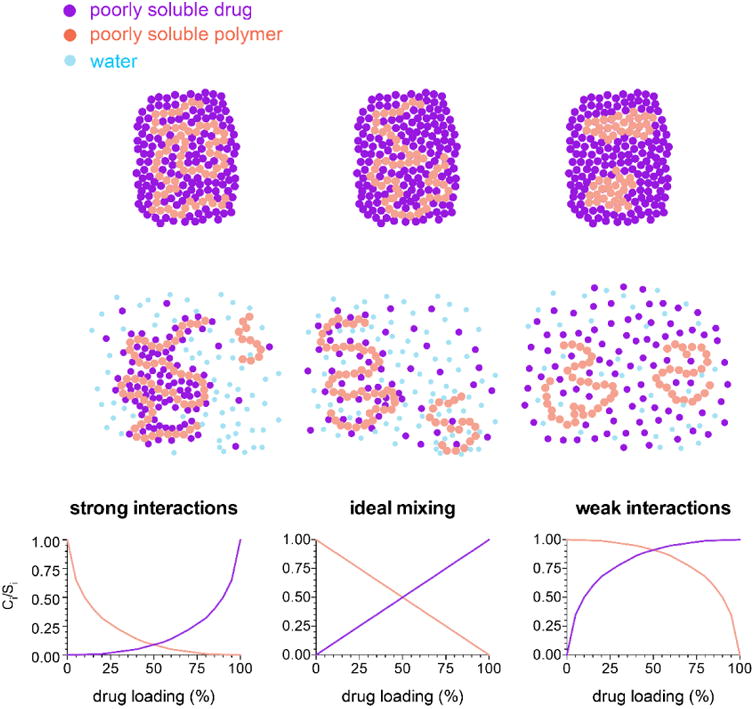
For systems with strong intermolecular interactions between the drug and the polymer, attractive forces dominate and there is a negative interaction parameter. The drug and polymer interactions are not disrupted by water. In this case, the solubility suppression is greater than for a system with ideal interactions (i.e. an interaction parameter equal to zero).
For mixtures where the strength of interactions among the drug and polymer are similar to those found for the single component systems, the interaction parameter is close to zero, and the change in the chemical potential of the drug is directly related to the dilution of the system by the polymer and water. Hence, the solubility suppression depends on the composition. This can be considered the “ideal mixing case”.
For drug-polymer systems with weak interactions, the interaction parameter is greater than zero, and the solubility suppression is less than for an ideal system, i.e. the chemical potential of the drug is higher than expected based on purely combinatorial mixing, due to unfavorable interactions. For systems where the interaction parameter becomes sufficiently large, phase separation occurs, and there is little-to-no solubility suppression, depending on the composition of the two phases.
In this study, both the drug and the polymer are poorly water-soluble (with the exception of the control system, HPMC) and hence the composition of the undissolved ASD is not expected to change substantially with respect to the ratio of drug-to-polymer upon equilibration with the aqueous phase (The ASD compositions varied ± 2% with respect to drug loading based on an estimated polymer solubility range of 3-25μg/mL whereby the range was approximated from the sulfuric acid-phenol assay, data not shown). This contention is supported by observations that the concentration profiles shown in Figure 2 are similar for 3 and 48 hours in most instances. Furthermore, DSC measurements of hydrated samples suggest that water did not alter the miscibility of the ASDs to any considerable extent; systems that were miscible in the dry state remained miscible upon hydration, while systems showing phase separation continued to show two glass transition events following hydration, albeit at lower temperatures (Figure 5 and 9).
IR spectroscopy revealed drug-polymer hydrogen bonding interactions in CAP, EC, HPMCAS, and HPMCP ASDs. Each of these ASDs show a composition dependent solubility suppression (Figure 2) with the extent of solubility suppression following the approximate trend HPMCP>EC>HPMCAS. This observation is consistent with HPMCP forming stronger/more extensive interactions than the other polymers. This trend can be rationalized based on the number and type of functional groups present in each polymer. HPMCP has approximately 31% carboxylic acid-containing phthalyl groups which can form strong hydrogen bonding interactions with lopinavir[50]. The phenyl rings of lopinavir may also interact with the phthalate groups of the polymer through π-π interactions. Although HPMCAS also contains carboxylic acid groups, there are fewer present with the HF grade containing only about 7% of succinoyl groups[50]. EC contains around 50% of unreacted hydroxyl groups that can also interact through hydrogen bonding[51].
In contrast to the above ASDs, the solubility data shown in Figure 2 suggest that CA and EUD-containing ASDs are phase separated, as supported by the DSC thermograms in Figure 5 and 9, and the IR data. Moisture sorption data also revealed negligible interactions in LPV-CA and LPV-EUD systems in that the water gain for the ASD was well predicted using an additive model. For EUD ASDs, the lack of a hydrogen bond donor in the EUD structure is likely the cause for weak interactions between the drug and the polymer. This lack of interaction leads to very little solubility suppression in these ASDs, presumably because the chemical potential of the drug in the ASD is close to that of amorphous lopinavir due to a low extent of mixing with the polymer.
For the CA and CAP ASDs, the extent of drug-polymer interactions cannot be solely explained by the degree of substitution considering the structural similarities between CA and EC, and between CAP and HPMCP. Such differences in molecular interactions might be also related to polymer conformation and additional functional groups present on the polymer[52] such as acetyl.
In terms of the impact of water on the solubility suppression, no clear trends can be observed between the water content for a given ASD system, and the extent of solubility suppression. Excluding CA and EUD ASDs, which are phase separated, HPMCAS, HPMCP, and CAP ASDs have similar water contents after exposure to high RH, while EC ASDs have a slightly lower water content (Figure 7 and 8). Thus, differences in water content within the ASDs (and the impact on drug thermodynamic activity as shown by Equations 5 and 6) cannot be used to rationalize the differences observed in the extent of solubility suppression.
Implications of solubility suppression
Amorphous solid dispersion suspensions are often employed in preclinical studies to measure pharmacokinetic and pharmacodynamic parameters, as well as to increase biological exposure for the purpose of safety evaluations. These formulations need to be dosed prior to crystallization and ideally, crystallization from the suspension formulations should not occur for a period of several days. However, the stability of such suspensions is likely to vary considerably, depending on polymer selection. The crystallization tendency of a drug from amorphous suspensions is expected to be dependent on 1) the extent of drug supersaturation in the suspension media; 2) the solubility of the polymer in the media; and 3) the ability of the polymer to inhibit drug crystallization from the solution and in the matrix. Therefore, attention should be paid to understanding how drug-polymer interactions affect the interplay of these three factors. Herein, we note that LPV-HPMCP ASDs show the highest extent of solubility suppression and this correlates with an extended stability against crystallization relative to the other ASDs. It is notable that the HPMCP ASDs are more stable than HPMCAS dispersions given the current popularity of the latter polymer for ASD formulations. Thus, the phenomenon of solubility suppression can be utilized as an advantage in the case of suspension formulations; by reducing the extent of supersaturation, the crystallization tendency is reduced. Indeed, in this study, we have observed extreme solubility suppression in amorphous solid dispersions systems, such that the solubility of lopinavir was suppressed to values below or close to its crystalline solubility in ASDs with EC and HPMCP at 15% and 33% drug loading (Figure 2). In these ASDs, there is no driving force for crystallization, and hence these formulations should remain physically stable for long periods of time, both in the dry state, and in suspension form. This represents the ideal scenario for an ASD formulation, whereby the chemical potential of the drug is sufficiently suppressed that no phase transformation will occur. However, release and supersaturation are still anticipated when the polymer experiences a higher pH environment, i.e. when the small intestine is reached.
Poorly water soluble polymers have also been used to form amorphous solid dispersions for controlled release formulations[17-20]. By using a poorly soluble polymer, the chemical potential of the drug can be suppressed in the drug-polymer-water ternary system, leading to reduced drug release rate and solubility. In principle, by judicious selection of the polymer, as well as understanding the extent of solubility suppression, an effective solubility somewhere between the amorphous and crystalline solubilities can be achieved. Therefore, the release rate and supersaturation can be potentially tuned to the desired levels. Hence, when designing drug delivery systems of poorly soluble drug with poorly soluble excipients, fundamental understanding of how the drug chemical potential is impacted by polymer and water should be used to eliminate, or utilize these effects to obtain the optimum supersaturation.
Conclusions
Molecular level mixing of the poorly soluble drug, lopinavir, with insoluble polymers leads to reduced potential for supersaturation, while phase separated ASDs show a supersaturation close to the pure drug amorphous solubility value. The extent of supersaturation suppression can be rationalized based on consideration of the ASD composition, mixing state, and the extent/strength of drug-polymer interactions. The stability of the various ASDs to crystallization when suspended in aqueous media was also found to be highly dependent on the aforementioned factors, as well as the level of supersaturation generated and the effectiveness of the polymer as a solution crystallization inhibitor. These insights can aid in the design and optimization of ASD suspensions and controlled release formulations.
Supplementary Material
Acknowledgments
This work was supported by the National Institutes of Health through grant number R42 GM100657-03.
Abbreviations
- ASD
amorphous solid dispersions
- CA
cellulose acetate
- CAP
cellulose acetate phthalate
- DL
drug loading
- DSC
differential calorimetry scanning
- EC
ethylcellulose
- EUD
Eudragit® RL PO
- HPMC
hydroxypropylmethylcellulose (hypromellose)
- HPMCAS
hydroxypropylmethylcellulose (hypromellose) acetate succinate
- HPMCP
hydroxypropylmethylcellulose (hypromellose) phthalate
- HPLC
high performance liquid chromatography
- LPV
lopinavir
- RH
relative humidity
Footnotes
Publisher's Disclaimer: This is a PDF file of an unedited manuscript that has been accepted for publication. As a service to our customers we are providing this early version of the manuscript. The manuscript will undergo copyediting, typesetting, and review of the resulting proof before it is published in its final citable form. Please note that during the production process errors may be discovered which could affect the content, and all legal disclaimers that apply to the journal pertain.
References
- 1.Di L, Kerns EH, Carter GT. Drug-Like Property Concepts in Pharmaceutical Design. Curr Pharm Des. 2009;15:2184–2194. doi: 10.2174/138161209788682479. [DOI] [PubMed] [Google Scholar]
- 2.Di L, Fish PV, Mano T. Bridging solubility between drug discovery and development. Drug Discovery Today. 2012;17:486–495. doi: 10.1016/j.drudis.2011.11.007. [DOI] [PubMed] [Google Scholar]
- 3.Lipinski CA. Drug-like properties and the causes of poor solubility and poor permeability. J Pharmacol Toxicol. 2000;44:235–249. doi: 10.1016/s1056-8719(00)00107-6. [DOI] [PubMed] [Google Scholar]
- 4.Lipinski CA, Lombardo F, Dominy BW, Feeney PJ. Experimental and computational approaches to estimate solubility and permeability in drug discovery and development settings. Adv Drug Deliver Rev. 1997;23:3–25. doi: 10.1016/s0169-409x(00)00129-0. [DOI] [PubMed] [Google Scholar]
- 5.Leuner C, Dressman J. Improving drug solubility for oral delivery using solid dispersions. Eur J Pharm Biopharm. 2000;50:47–60. doi: 10.1016/s0939-6411(00)00076-x. [DOI] [PubMed] [Google Scholar]
- 6.Elworthy PH, Patel MS. Demonstration of maximum solubilization in a polyoxyethylene alkyl ether series of non-ionic surfactants. J Pharm Pharmacol. 1982;34:543–546. doi: 10.1111/j.2042-7158.1982.tb04790.x. [DOI] [PubMed] [Google Scholar]
- 7.Miller JM, Beig A, Carr RA, Webster GK, Dahan A. The Solubility–Permeability Interplay When Using Cosolvents for Solubilization: Revising the Way We Use Solubility-Enabling Formulations. Mol Pharmaceutics. 2012;9:581–590. doi: 10.1021/mp200460u. [DOI] [PubMed] [Google Scholar]
- 8.Loftsson T, Brewster ME. Pharmaceutical Applications of Cyclodextrins. 1. Drug Solubilization and Stabilization. J Pharm Sci. 1996;85:1017–1025. doi: 10.1021/js950534b. [DOI] [PubMed] [Google Scholar]
- 9.Dahan A, Beig A, Lindley D, Miller JM. The solubility–permeability interplay and oral drug formulation design: Two heads are better than one. Adv Drug Deliver Rev. 2016;101:99–107. doi: 10.1016/j.addr.2016.04.018. [DOI] [PubMed] [Google Scholar]
- 10.Raina S, Zhang GZ, Alonzo D, Wu J, Zhu D, Catron N, Gao Y, Taylor L. Impact of solubilizing additives on supersaturation and membrane transport of drugs. Pharm Res. 2015;32:1–15. doi: 10.1007/s11095-015-1712-4. [DOI] [PubMed] [Google Scholar]
- 11.Miller JM, Beig A, Carr RA, Spence JK, Dahan A. A Win–Win Solution in Oral Delivery of Lipophilic Drugs: Supersaturation via Amorphous Solid Dispersions Increases Apparent Solubility without Sacrifice of Intestinal Membrane Permeability. Mol Pharmaceutics. 2012;9:2009–2016. doi: 10.1021/mp300104s. [DOI] [PubMed] [Google Scholar]
- 12.Yoshioka M, Hancock BC, Zografi G. Inhibition of indomethacin crystallization in poly(vinylpyrrolidone) coprecipitates. J Pharm Sci. 1995;84:983–986. doi: 10.1002/jps.2600840814. [DOI] [PubMed] [Google Scholar]
- 13.Ilevbare GA, Liu H, Edgar KJ, Taylor LS. Impact of Polymers on Crystal Growth Rate of Structurally Diverse Compounds from Aqueous Solution. Mol Pharmaceutics. 2013;10:2381–2393. doi: 10.1021/mp400029v. [DOI] [PubMed] [Google Scholar]
- 14.Ilevbare GA, Liu H, Edgar KJ, Taylor LS. Maintaining Supersaturation in Aqueous Drug Solutions: Impact of Different Polymers on Induction Times. Cryst Growth Des. 2012;13:740–751. [Google Scholar]
- 15.Curatolo W, Nightingale JA, Herbig SM. Utility of Hydroxypropylmethylcellulose Acetate Succinate (HPMCAS) for Initiation and Maintenance of Drug Supersaturation in the GI Milieu. Pharm Res. 2009;26:1419–1431. doi: 10.1007/s11095-009-9852-z. [DOI] [PubMed] [Google Scholar]
- 16.Aitken-Nichol C, Zhang F, McGinity JW. Hot Melt Extrusion of Acrylic Films. Pharm Res. 1996;13:804–808. doi: 10.1023/a:1016076306279. [DOI] [PubMed] [Google Scholar]
- 17.Huang J, Wigent RJ, Schwartz JB. Nifedipine Molecular Dispersion in Microparticles of Ammonio Methacrylate Copolymer and Ethylcellulose Binary Blends for Controlled Drug Delivery: Effect of Matrix Composition. Drug Dev Ind Pharm. 2006;32:1185–1197. doi: 10.1080/03639040600832827. [DOI] [PubMed] [Google Scholar]
- 18.Desai J, Alexander K, Riga A. Characterization of polymeric dispersions of dimenhydrinate in ethyl cellulose for controlled release. Int J Pharm. 2006;308:115–123. doi: 10.1016/j.ijpharm.2005.10.034. [DOI] [PubMed] [Google Scholar]
- 19.Iqbal Z, Babar A, Ashraf M. Controlled-Release Naproxen Using Micronized Ethyl Cellulose by Wet-Granulation and Solid-Dispersion Method. Drug Dev Ind Pharm. 2002;28:129–134. doi: 10.1081/ddc-120002445. [DOI] [PubMed] [Google Scholar]
- 20.Maulvi FA, Lakdawala DH, Shaikh AA, Desai AR, Choksi HH, Vaidya RJ, Ranch KM, Koli AR, Vyas BA, Shah DO. In vitro and in vivo evaluation of novel implantation technology in hydrogel contact lenses for controlled drug delivery. J Control Release. 2016;226:47–56. doi: 10.1016/j.jconrel.2016.02.012. [DOI] [PubMed] [Google Scholar]
- 21.Sun DD, Lee PI. Probing the mechanisms of drug release from amorphous solid dispersions in medium-soluble and medium-insoluble carriers. J Control Release. 2015;211:85–93. doi: 10.1016/j.jconrel.2015.06.004. [DOI] [PubMed] [Google Scholar]
- 22.Ohara T, Kitamura S, Kitagawa T, Terada K. Dissolution mechanism of poorly water-soluble drug from extended release solid dispersion system with ethylcellulose and hydroxypropylmethylcellulose. Int J Pharm. 2005;302:95–102. doi: 10.1016/j.ijpharm.2005.06.019. [DOI] [PubMed] [Google Scholar]
- 23.Li N, Ormes JD, Taylor LS. Leaching of Lopinavir Amorphous Solid Dispersions in Acidic Media. Pharm Res. 2016;33:1–13. doi: 10.1007/s11095-016-1913-5. [DOI] [PubMed] [Google Scholar]
- 24.Ilevbare GA, Taylor LS. Liquid–Liquid Phase Separation in Highly Supersaturated Aqueous Solutions of Poorly Water-Soluble Drugs: Implications for Solubility Enhancing Formulations. Cryst Growth Des. 2013;13:1497–1509. [Google Scholar]
- 25.Murdande SB, Pikal MJ, Shanker RM, Bogner RH. Solubility advantage of amorphous pharmaceuticals: I. A thermodynamic analysis. J Pharm Sci. 2010;99:1254–1264. doi: 10.1002/jps.21903. [DOI] [PubMed] [Google Scholar]
- 26.Almeida e Sousa L, Reutzel-Edens SM, Stephenson GA, Taylor LS. Assessment of the Amorphous “Solubility” of a Group of Diverse Drugs Using New Experimental and Theoretical Approaches. Mol Pharmaceutics. 2014;12:484–495. doi: 10.1021/mp500571m. [DOI] [PubMed] [Google Scholar]
- 27.Murdande SB, Pikal MJ, Shanker RM, Bogner RH. Solubility Advantage of Amorphous Pharmaceuticals: II. Application of Quantitative Thermodynamic Relationships for Prediction of Solubility Enhancement in Structurally Diverse Insoluble Pharmaceuticals. Pharm Res. 2010;27:2704–2714. doi: 10.1007/s11095-010-0269-5. [DOI] [PubMed] [Google Scholar]
- 28.Trasi NS, Taylor LS. Dissolution performance of binary amorphous drug combinations—Impact of a second drug on the maximum achievable supersaturation. Int J Pharm. 2015;496:282–290. doi: 10.1016/j.ijpharm.2015.10.026. [DOI] [PubMed] [Google Scholar]
- 29.Trasi NS, Taylor LS. Thermodynamics of highly supersaturated aqueous solutions of poorly water-soluble drugs—Impact of a second drug on the solution phase behavior and implications for combination products. J Pharm Sci. 2015:2583–2593. doi: 10.1002/jps.24528. [DOI] [PubMed] [Google Scholar]
- 30.Huang S, Mao C, Williams RO, III, Yang CY. Solubility Advantage (and Disadvantage) of Pharmaceutical Amorphous Solid Dispersions. J Pharm Sci. 2016;105:3549–3561. doi: 10.1016/j.xphs.2016.08.017. [DOI] [PubMed] [Google Scholar]
- 31.Van Den Abeele J, Rubbens J, Brouwers J, Augustijns P. The dynamic gastric environment and its impact on drug and formulation behaviour. Eur J Pharm Sci. 2017;96:207–231. doi: 10.1016/j.ejps.2016.08.060. [DOI] [PubMed] [Google Scholar]
- 32.Li N, Mosquera-Giraldo LI, Borca CH, Ormes J, Lowinger M, Higgins J, Slipchenko LV, Taylor LS. A Comparison of the Crystallization Inhibition Properties of Bile Salts. Cryst Growth Des. 2016;12:7286–7300. [Google Scholar]
- 33.Greenspan L. Humidity fixed points of binary saturated aqueous solutions. J Res Natl Bur Stand, Sect A. 1977;81:89–96. [Google Scholar]
- 34.Garcia TP. Doctoral Dissertation. Department of Indsutrial and Physical Pharmacy, Purdue University; 1989. Ester hydrolysis of cellulose acetate and cellulose acetate phthalate in aqueous suspension and solution, and solid state. [Google Scholar]
- 35.Gantz GM, Batdorf JB. Stabilization of Ethyl Cellulose against Photo Oxidation. The Journal of Photographic Science. 1959;7:35–38. [Google Scholar]
- 36.Roxin P, Karlsson A, Singh SK. Characterization of Cellulose Acetate Phthalate (CAP) Drug Dev Ind Pharm. 1998;24:1025–1041. doi: 10.3109/03639049809089946. [DOI] [PubMed] [Google Scholar]
- 37.Lin-Vien D, Colthup NB, Fateley WG, Grasselli JG. The Handbook of Infrared and Raman Characteristic Frequencies of Organic Molecules. 1991 [Google Scholar]
- 38.Crowley KJ, Zografi G. Water Vapor Absorption into Amorphous Hydrophobic Drug/Poly(vinylpyrrolidone) Dispersions. J Pharm Sci. 91:2150–2165. doi: 10.1002/jps.10205. [DOI] [PubMed] [Google Scholar]
- 39.Parks GS, Snyder LJ, Cattoir FR. Studies on Glass. XI. Some Thermodynamic Relations of Glassy and Alpha-Crystalline Glucose. J Chem Phys. 1934;2:595–598. [Google Scholar]
- 40.Hancock B, Parks M. What is the true solubility advantage for amorphous pharmaceuticals? Pharm Res. 2000;17:397–404. doi: 10.1023/a:1007516718048. [DOI] [PubMed] [Google Scholar]
- 41.Brick MC, Palmer HJ, Whitesides TH. Formation of Colloidal Dispersions of Organic Materials in Aqueous Media by Solvent Shifting. Langmuir. 2003;19:6367–6380. [Google Scholar]
- 42.Mosquera-Giraldo LI, Taylor LS. Glass–Liquid Phase Separation in Highly Supersaturated Aqueous Solutions of Telaprevir. Mol Pharmaceutics. 2015;12:496–503. doi: 10.1021/mp500573z. [DOI] [PubMed] [Google Scholar]
- 43.Indulkar AS, Box KJ, Taylor R, Ruiz R, Taylor LS. pH-Dependent Liquid–Liquid Phase Separation of Highly Supersaturated Solutions of Weakly Basic Drugs. Mol Pharmaceutics. 2015;12:2365–2377. doi: 10.1021/acs.molpharmaceut.5b00056. [DOI] [PubMed] [Google Scholar]
- 44.Flory PJ. Principles of Polymer Chemistry. Cornell University Press; 1953. [Google Scholar]
- 45.Marsac P, Shamblin S, Taylor L. Theoretical and Practical Approaches for Prediction of Drug–Polymer Miscibility and Solubility. Pharm Res. 2006;23:2417–2426. doi: 10.1007/s11095-006-9063-9. [DOI] [PubMed] [Google Scholar]
- 46.Rumondor ACF, Konno H, Marsac PJ, Taylor LS. Analysis of the moisture sorption behavior of amorphous drug–polymer blends. J Appl Polym Sci. 2010;117:1055–1063. [Google Scholar]
- 47.Simonelli AP, Mehta SC, Higuchi WI. Dissolution Rates of High Energy Polyvinylpyrrolidone (PVP)-Sulfathiazole Coprecipitates. J Pharm Sci. 1969;58:538–549. doi: 10.1002/jps.2600580503. [DOI] [PubMed] [Google Scholar]
- 48.Chen Y, Wang S, Wang S, Liu C, Su C, Hageman M, Hussain M, Haskell R, Stefanski K, Qian F. Initial Drug Dissolution from Amorphous Solid Dispersions Controlled by Polymer Dissolution and Drug-Polymer Interaction. Pharm Res. 2016;33:2445–2458. doi: 10.1007/s11095-016-1969-2. [DOI] [PubMed] [Google Scholar]
- 49.Indulkar AS, Waters JE, Mo H, Gao Y, Raina SA, Zhang GGZ, Taylor LS. Origin of Nanodroplet Formation Upon Dissolution of an Amorphous Solid Dispersion: A Mechanistic Isotope Scrambling Study. J Pharm Sci. 2017;106:1998–2008. doi: 10.1016/j.xphs.2017.04.015. [DOI] [PubMed] [Google Scholar]
- 50.Shin-Etsu, Shin-Etsu pharmaceutical excipients product table. in http://www.sepfmd.com/getfile.php?fid=49&lg=en.
- 51.Dow, Dow Cellulosics: ETHOCEL Ethylcellulose Polymers Technical Handbook. in http://msdssearch.dow.com/PublishedLiteratureDOWCOM/dh_004f/0901b8038004fb7c.pdf?filepath=eth.
- 52.Mosquera-Giraldo LI, Borca CH, Meng X, Edgar KJ, Slipchenko LV, Taylor LS. Mechanistic Design of Chemically Diverse Polymers with Applications in Oral Drug Delivery. Biomacromolecules. 2016;17:3659–3671. doi: 10.1021/acs.biomac.6b01156. [DOI] [PubMed] [Google Scholar]
Associated Data
This section collects any data citations, data availability statements, or supplementary materials included in this article.


