Abstract
Peptidoglycan (PG) is a major component of the cell wall in Enterococcus faecalis. Accurate analysis of PG composition provides crucial insights into bacteria’s cellular functions and responses to external stimuli, but this analysis remains challenging due to various chemical modifications to PG-repeat subunits. We characterized changes to the PG composition in E. faecalis grown as planktonic bacteria and biofilm by developing “Stable Isotope Labeling by Amino Acids in Bacterial Culture” (SILAB) optimized for bacterial cultures with incomplete amino acid labeling. This comparative analysis by mass spectrometry was carried out by labeling E. faecalis in biofilm with heavy-Lys (L-[13C6, 2D9, 15N2]Lys) and planktonic bacteria with natural abundance L-Lys, then mixing the equal amount of bacteria from each condition and carrying out cell-wall isolation and mutanolysin digestion necessary for liquid chromatography-mass spectrometry. An analytical method was developed to determine muropeptide abundances using correction factors to compensate for incomplete heavy-Lys isotopic enrichment (98.33% ± 0.05%) and incorporation (83.23% ± 1.16%). SILAB analysis of 47 pairs of PG fragment ions from isolated cell walls of planktonic and biofilm samples were selected for analysis. We found that the PG in biofilm showed increased PG cross-linking, increased N-deacetylation of GlcNAc, decreased O-acetylation of MurNAc, and increased stem modifications by D,D- and L,D-carboxypeptidases.
Keywords: E. faecalis, peptidoglycan, SILAB, and SILAC
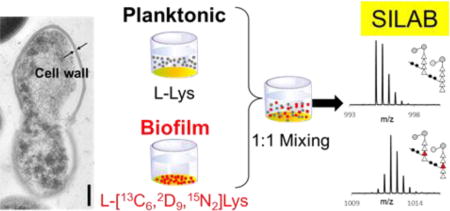
TOC image
Introduction
Enterococcus faecalis is one of the leading Gram-positive nosocomial pathogens. The cell wall of E. faecalis is thick, approximately 40 nm (Figure 1a), which enables bacteria to survive and thrive in healthcare settings. The primary component of cell wall is peptidoglycan (PG), a biopolymer made from repeating units (Figure 1b,c). As an integral part of the cell wall, PG forms a protective barrier against the extracellular environment and functions as a scaffold for the attachment of proteins and other polymers essential for cell growth and division, microbial pathogenesis, and antibiotic resistance. A PG-repeat unit in E. faecalis consists of a disaccharide (GlcNAc-MurNAc), a pentapeptide stem (L-Ala-D-iso-Glu-L-Lys-D-Ala-D-Ala), and L-Ala-L-Ala cross-linking bridge. The L-Ala-L-Ala bridge structure is attached to the ε-nitrogen of L-Lys of the pentapeptide PG stem in lipid II by Fem-family of transferases,1, 2 and this precursor is transported to the exterior of the cell membrane. Assembly of the cell wall then takes place by transglycosylases, which catalyze the polymerization of PG disaccharides into glycan chains, and by transpeptidases that interconnect the glycan chains by forming cross-links.3 Cross-link is a peptide bond formed between the N-terminus of L-Ala from the bridge in the acceptor stem to the C-terminus of penultimate D-Ala from the neighboring donor PG stem. During cross-linking, terminal D-Ala at the 5th position of the donor stem is removed.4, 5
Figure 1. E. faecalis cell wall and SILAB.
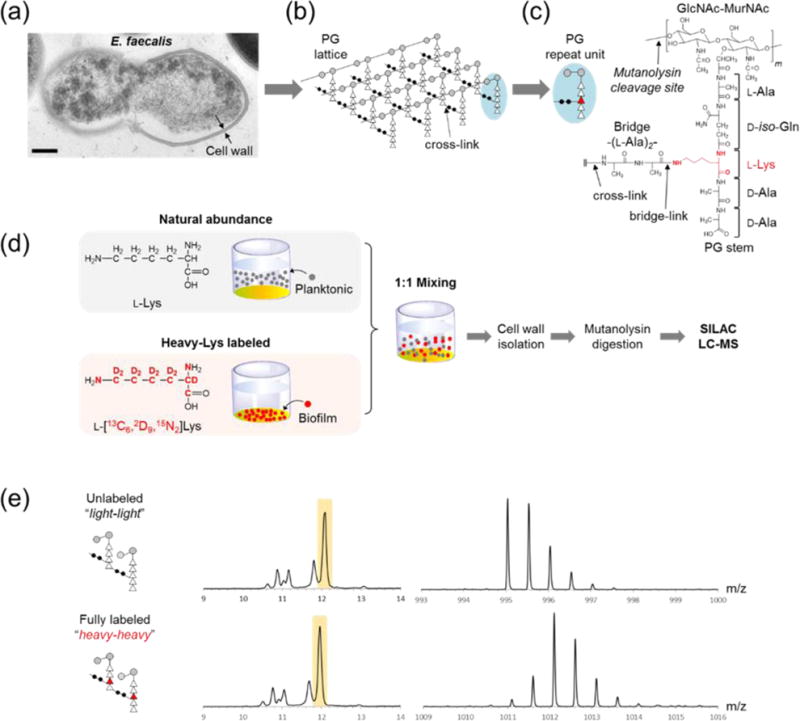
(a) TEM image of E. faecalis shows a thick, well-defined cell wall. (b) Schematic representation of E. faecalis PG with repeating subunits shows how a lattice structure is formed through links between PG subunits. (c) Each PG subunit consists of a disaccharide GlcNAc-MurNAc, a pentapeptide stem, and a bridge. L-Lys in the PG stem is highlighted in red. (d) Schematic for SILAB labeling of PG. Planktonic bacteria grown with natural abundance L-Lys and biofilm bacteria from L-[13C6, 2D9, 15N2]Lys (heavy-Lys) labeled media are harvested then mixed 1:1. After the mixing, cell walls were isolated and digested with mutanolysin for SILAB-based LC-MS analysis. (e) XIC and mass spectra of unlabeled (top) and labeled (bottom) PG dimers are indicative of altered isotopic distribution for the labeled PG.
PG composition of E. faecalis is dynamic, and it changes in response to various external stimuli.6-9 Some of the ways PG is modified6 include: altered cross-link connectivity,2 cross-linking efficiency,10-13 depsipeptide incorporation,14 PG-stem modifications,8, 15 PG-bridge modifications,16 O-acetylation of MurNAc,17, 18 and N-deacetylation of GlcNAc.7, 11, 19 Thus, an accurate analysis of PG composition can provide insights into how E. faecalis interact with their environment. However, PG analysis remains challenging due to the combination of cell wall’s size, heterogeneity, complexity, and insolubility, which leaves it incompatible with most biochemical and spectroscopic methods.20 Two complimentary methods, solid-state NMR and LC-MS, previously have been successful in analyzing PG, where solid-state NMR can determine the total cell wall composition in intact whole cells10, 13, 21-26 while LC-MS can provide detailed analysis of chemical modifications to the PG.27-29 For LC-MS analysis, isolated cell walls are digested by mutanolysin (N-acetylmuramidase) that cleaves β1-4 glycosidic linkages of the glycan chain, which results in PG fragments amenable for LC-MS (Figure 1c). Mutanolysin digested muropeptide fragments retain information on PG chemical modifications such as cross-link, bridge-link, PG-stem modifications, N-deacetylation of GlcNAc and O-acetylation of MurNAc.30
Analysis of the PG chemical modifications is important for understanding biological processes in bacteria. These modifications give arise to rich chemical diversity that reflects biological events, but at the same time they create staggering complexity of PG variations that pose a significant challenge for analysis.31 To overcome this challenge inherent to LC-MS of PG, we developed Stable Isotope Labeling by Amino Acids in Bacterial Culture” (SILAB) optimized for bacterial cultures with incomplete amino acid labeling. SILAB is a modified version of stable isotope labeling with amino acids in cell culture (SILAC). SILAC has been successfully applied for quantitative proteome and metabolome analyses of auxotrophic organisms;32-35 however, its use for autotrophic organisms and bacteria remain difficult due to the low level of labeled amino acid incorporation.33, 36, 37 In these cases, provisioned stable isotope-labeled amino acids are diluted by endogenous amino acids for the incorporation into biological polymers.38, 39 For this study, we selected L-[13C6, 2D9, 15N2]Lys (referred as heavy-Lys hereafter) for the PG labeling, As Lysine has the highest incorporation efficiency (INE) of all amino acids in PG, approximately twice that of D-Ala in E. faecalis.40 This incorporation of heavy-Lys into a PG-repeat unit increases its mass by 17 Da, allowing for quantifying differences in abundances of labeled and unlabeled PG fragment ions (Figure 1d).
There are two challenges to PG composition analysis by SILAB. First, the incorporation of heavy-Lys into muropeptides markedly changes their isotopic distribution. Figure 1e shows the mass spectra of a PG dimer with (bottom) and without (top) the heavy-Lys incorporated. The change in isotope distribution is closely dependent on the isotopic enrichment (ISE) of the heavy-Lys (Figure 2a). Second, endogenous de novo L-Lys biosynthesis in E. faecalis lowers the incorporation efficiency (INE) of exogenous heavy-Lys due to bacteria utilizing both sources of L-Lys. This dilutes the heavy-Lys incorporation and this effect is visible in Figure 2b as appearance of partially labeled PG dimer (blue box). Thus, for accurate PG composition analysis by SILAB, determination of ISE and INE for heavy-Lys in the PG is necessary. with different numbers of cross-links (b), alanylation (c), and acetylation state (d) are depicted, with negative Log values indicating higher abundance of fragments from the planktonic sample, and positive values the biofilm sample. Error bars represent standard error of mean (n = 3).
Figure 2. Determination of heavy-Lys isotopic enrichment.
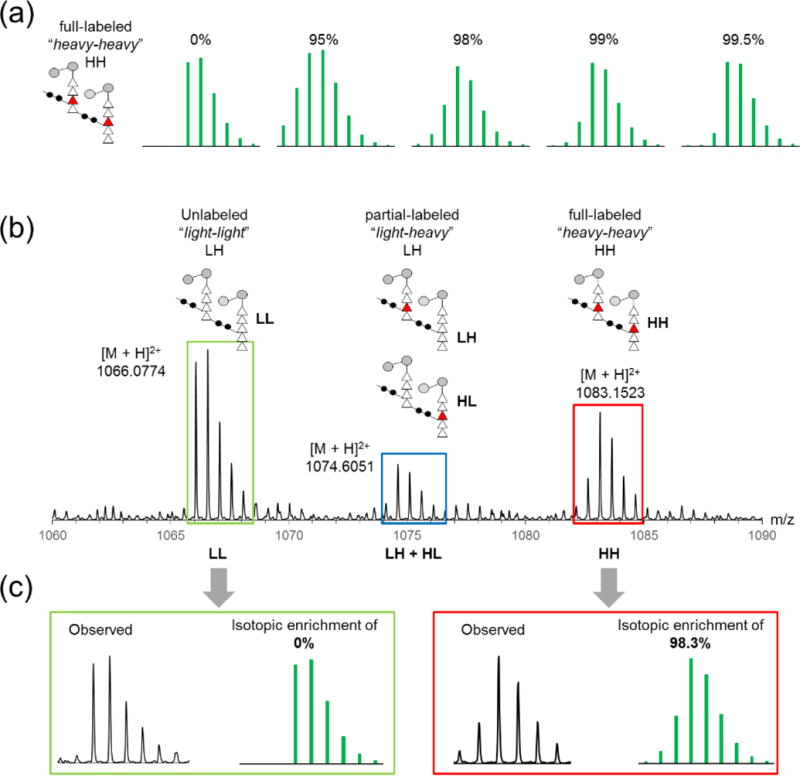
(a) Calculated isotopic distributions for a PG dimer with two heavy-Lys incorporated are shown for varying levels of isotopic enrichment (ISE) (green). (b) Three different observed isotopic distribution patterns for unlabeled (green box), partially labeled (blue box), and fully labeled (red box) PG dimers are overlaid on single spectrum. Schematic representations of the dimer with different degrees of heavy-Lys incorporation correspond to peaks on the spectrum, showing that isotopic distribution is dependent on the number of heavy-Lys incorporated. (c) Observed isotopic distribution of fully labeled dimer (red box) was fit to calculated isotopic distributions using least square method for ISE (98.33% ± 0.05%, n = 3).
In this report, we outline the development of a SILAB to characterize the differences in the PG composition in cell walls of E. faecalis harvested in planktonic phase or biofilm. Samples for planktonic bacteria were prepared from bacteria grown in unlabeled media and harvested from the media suspension (Figure 1d, top), while samples for biofilm were prepared from bacteria grown in heavy-Lys labeled media harvested by scraping the cells attached to the bottom of wells (Figure 1d, bottom). In situ ISE and INE for heavy-Lys in PG were measured, and SILAB analysis was performed on 47 muropeptide pairs to characterize differences in the PG composition of E. faecalis found in planktonic and biofilm growths.
EXPERIMENTAL METHODS
Bacterial Biofilm Growth and Isotope Labeling
The diagram for SILAB labeling scheme is shown in Figure 1d. Polystyrene tissue plates treated for cell culture growth (Corning® Costar®) with each well containing 4 mL of Enterococcal Defined Media (EDM), a chemically defined media developed for enterococcal and staphylococcal growths, were inoculated with 1% (v/v) of overnight starter culture of E. faecalis (ATCC 29212) grown in tryptic soy broth.31 For stable isotope labeling, natural abundance L-Lys (light) in EDM was replaced with L-[13C6, 2D9, 15N2]Lys (Cambridge Isotopes). The range of ISE for the L-[13C6, 2D9, 15N2]Lys as provided by the vendor was 96-99%.
After 24 h of growth at 37 °C with 80 rpm orbital shaking, two distinct types of growths were visible within wells: biofilm that was attached to bottom of the well, and planktonic bacteria freely suspended in the media. Planktonic growth was harvested by pipetting from wells with EDM containing unlabeled L-Lys. For the biofilm growth, planktonic bacteria from wells containing EDM with heavy-Lys were first removed using pipette, then remaining biofilm was washed twice with 4 mL of cold phosphate buffered saline (PBS) to remove any residual planktonic cells. After the washes, heavy-Lys labeled biofilm was harvested by physically scraping off the biofilm attached to the bottom of polystyrene wells. Harvested bacteria were centrifuged at 5250 g for 10 min and washed once with PBS, then placed in boiling water bath for 30 min to deactivate cellular processes. Bacterial suspensions were agitated by vortexing to break up aggregates, and suspensions of planktonic (unlabeled) and biofilm (heavy-Lys labeled) were diluted using PBS to equal optical density of 0.60 at 600 nm. Planktonic and biofilm cell suspensions were then mixed in equal volume (1:1; v/v) and centrifuged to form pellets (Figure 1d).
Cell Wall Isolation and Mutanolysin Digestion
The pellet from of planktonic and biofilm bacteria was divided into microcentrifuge tubes with approximately 400 μL (0.65 g) of 0.5 mm glass beads. Cells were disrupted using a bead beater (Disruptor Genie, Scientific Industries) for 8 cycles consisting of 1 min disruption and 1 min rest. Beads were separated from disrupted cells using Steriflip 20 μm nylon net vacuum filter (EMD Millipore). Disrupted cells were washed once in PBS, boiled in 2% sodium dodecyl sulfate solution for 30 min, then washed 5 times with deionized water to remove any residual sodium dodecyl sulfate. Each wash was carried out by centrifugation at 5250 g for 10 min at 24°C. Resulting isolated cell walls were suspended in 20 mM Tris pH 8.0 buffer, then 200 μg of DNase (Sigma-Aldrich) was added and the mixture incubated at 37°C with 180 RPM shaking for 24 h. After the nucleic acid digestion, 300 μg of trypsin (Sigma-Aldrich) was added for 24 h of digestion. Isolated cell walls were then pelleted through centrifugation, the supernatant with enzymes and their nucleic acid and protein digests removed, and pellets resuspended in fresh Tris buffer, and 100 units of mutanolysin (Sigma-Aldrich) added for PG digestion and the mixture incubated at room temperature for 24 h. Additional 100 units of mutanolysin were then added and the mixture further digested for 24 h. Undigested cell wall was removed through filters with pore size of 30 kDa molecular weight cutoff by centrifuging the digests at 17000 g. The digest was frozen, lyophilized, then resuspended in 1 mL of 0.5 M borate buffer at pH 9.0. Soluble muropeptides were reduced by adding 10 mg of sodium borohydride for 30 min. Reduction was quenched by adding 120 μL of 85% phosphoric acid, and the samples were frozen and lyophilized.
LC-MS
Digested cell wall fragments were cleaned up for LC-MS through Pierce C18 tip (ThermoFisher). Waters Synapt G2 High Definition Mass Spectrometer (HDMS) with Time-of-Flight (TOF) mass analyzer and Waters C18 ACUITY Ultra Performance Liquid Chromatography (UPLC) were used to analyze the cell wall digest. Chromatographic separation was carried out on Waters nanoACQUITY C18 reverse-phase column (75 μm × 100 mm, 1.7 μm beads with 130 Å pore size) with nanoACQUITY C18 trap column (180 μm × 20 mm, 5 μm beads with 100 Å pore size). First, 1 μL of the sample from 5 μL sample loop was injected into the column under isocratic condition of 99% buffer A (99.8% anhydrous methanol with 0.1% formic acid) and 1 % buffer B (100% acetonitrile) over 5 min. After the sample injection, linear gradient to 50% buffer B was applied over 60 min for separation. The column was subsequently regenerated under isocratic condition with 85% buffer B for 5 min, linear gradient to 98% buffer A for 1 minute, then isocratic at 98% buffer A for 23 min. Flow rate was kept constant (0.6 μL/min) throughout the analysis. Resulting eluents were analyzed by Waters Synapt G2 HDMS-TOF mass analyzer operating in positive ion mode with fragments ionized through electrospray ionization (ESI) with spray voltage of 35 V and capillary voltage of 3.5 kV. Mass analyzer was optimized for ions in m/z range of 100-2000, with Fibrinopeptide B (Glu-Fib) as the standard lock mass for calibration.
Data Analysis
MassLynx Mass Spectrometry Software (Waters) was used to obtain m/z and peak intensity values from the LC-MS data. The criteria for positive matches was defined as the difference between observed and calculated masses for the fragments selected for analysis was 20 ppm or less. Exact masses for the PG library were generated with an in-house MATLAB (MathWorks) program utilizing values calculated from the Molecular Mass Calculator on the Biological Magnetic Resonance Data Bank (www.bmrb.wisc.edu). Isotopic distributions for the natural abundance and labeled PG at various ISEs were calculated with MATLAB.
RESULTS AND DISCUSSION
Isotopic Enrichment of Heavy-Lys
Incorporation of heavy-Lys (L-[13C6, 2D9, 15N2]Lys) into PG does not change the elution profile of labeled muropeptides, as example of a PG dimer shown in Figure 1e. In mass spectrum, incorporation of labels is clearly seen by the increase of 34 Da in the mass of ions and it alters the isotopic distribution of labeled PG. Simulation of isotopic distribution pattern for a PG dimer shows that it is highly dependent on the ISE of heavy-Lys (Figure 2a). While a range of ISE for heavy-Lys was provided by the vendor, precise ISE measurement was necessary for the detection of minute changes to the PG composition associated with the biofilm formation. Furthermore, ISE of heavy-Lys may have changed during the 24 h growth period, as the exogenous heavy-Lys provisioned in defined media can be metabolized by bacteria. Resulting secondary metabolites from heavy-Lys could potentially reenter the Lysine biosynthesis and thereby alter the in situ ISE of heavy-Lys found in the cell wall.
To determine ISE, the contribution of heavy-Lys to muropeptide’s isotope distribution was modeled with binomial distribution as shown in Equation 1. In the distribution, Pn is the probability of enrichment for n, the total number of atoms to be labeled, E is the ISE, and u is the total number of atoms intended for labeling that was not enriched. For example, the total number of atoms to be labeled (n) for the heavy-Lys labeled PG dimer shown in Figure 2 is 34. This model is an approximation based on assumptions that ISEs for 13C, 2H, and 15N in heavy-Lys are uniform, and ISE for each stable isotope is independent of its position. These are reasonable assumptions given that biological preparation of labeled amino acids is from uniformly labeled media, and they are confirmed by direct in situ measurement of ISE for heavy-Lys found in PG (vide infra).
| (1) |
Isotopic distribution pattern for a heavy-Lys labeled muropeptide can be calculated as a combination of contributions from labeled atoms in heavy-Lys that are part of PG as described in Equation 1 and natural abundance atoms from non-Lys residues in the muropeptide. Resulting isotopic distributions were calculated by using an in-house MATLAB program, and calculated distributions for a PG dimer with two L-[13C6, 2D9, 15N2]Lys incorporated with the ISEs of 0, 95, 98, 99, and 99.5% are shown in Figure 2a. Calculated isotopic distributions are sensitive to changes in ISE of heavy-Lys and number of heavy-Lys incorporated into a muropeptide, indicating that the distribution is dependent on the number of n and u. These effects are visible in the mass spectrum shown in Figure 2b for the unlabeled PG dimer (green box), a singly labeled dimer (blue box), and doubly labeled dimer (red box). The ISE was determined by fitting the observed isotopic distribution pattern of a fully labeled PG dimer to the isotopic distribution model by minimizing the sum of squared differences between distributions normalized as probabilities, and the ISE for heavy-Lys in PG was determined to be 98.33% ± 0.05% (95% confidence interval, n = 3). Observed isotopic distribution for the fully labeled dimer (red box) shows excellent agreement with the isotopic distribution calculated for the observed ISE value (Figure 2c).
Incorporation Efficiency of Heavy-Lys
Quantification based on isotopic labeling of amino acids in bacteria can be difficult due to de novo amino acid biosynthesis that lowers the INE of labeled amino acid. Lower than 100% INE for a PG dimer resulted in three distinct muropeptide labeling patterns in Figure 2b: unlabeled (green box), single-labeled (green box), and double-labeled PG dimers (red box). Thus, with incomplete incorporation of labeled amino acid, peak intensities of muropeptides that were to be labeled are lower than their true values in ideal label incorporation, while unlabeled and partially labeled ones higher. This undesirable effect is illustrated in Figure 3a, where base peaks used for comparing muropeptide abundances are shown with the designation “LL” for the unlabeled dimer, “LH” and “HL” for the partially labeled dimer, or “HH” for fully labeled dimer. In uncorrected spectra without the incorporation correction (Figure 3a, top), intensities of LL and HH appear seemingly equal to the LL intensity from the planktonic sample is augmented by the LL intensity from the biofilm sample caused by incomplete incorporation. This increases the observed intensity of unlabeled PG dimers from the planktonic sample, while lowering the intensity of fully labeled dimers originating from the biofilm sample. When the intensities of LL and HH in this spectrum are corrected, they show that the intensity of labeled PG dimer from biofilm is more than double the corrected intensity of the unlabeled dimer from planktonic bacteria. These errors grow as the number of labels in PG increases, emphasizing the necessity of correcting for lower than 100% INE (Figure 3b). In order to carry out this correction, determination of the heavy-Lys INE is required.
Figure 3. Determination of heavy-Lys incorporation efficiency.
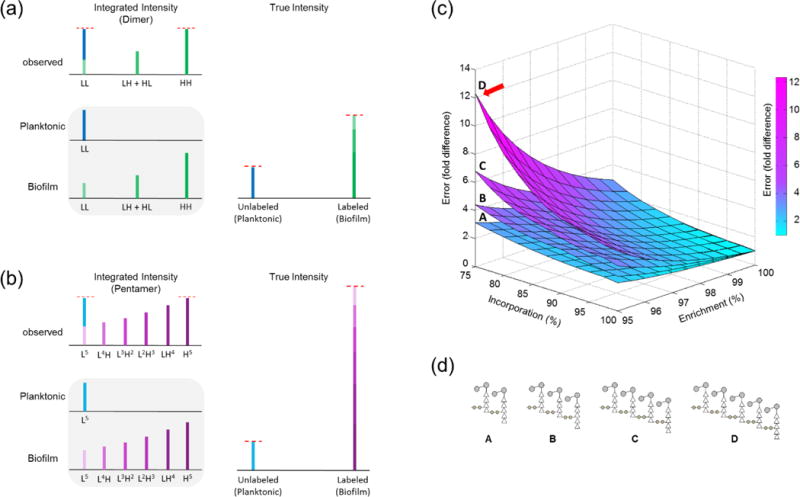
(a) The effect from heavy-Lys label dilution by endogenous amino acid biosynthesis on SILAB quantification of a PG dimer is overestimation of the unlabeled PG and underestimation of the labeled PG. (b) Heavy-Lys dilution and resulting reduction in incorporation efficiency disproportionally distorts the SILAB quantification of larger oligomers. (c and d) Factor of error represents the amount of correction necessary to account for both partial enrichment and incomplete incorporation, and is plotted as a function of ISE and INE. Four surfaces show the factor of error for dimers (A), trimers (B), tetramers (C), and pentamers (D).
Incomplete incorporation of heavy-Lys into PG was also modeled using a binomial distribution with the probability Pc as shown in Equation 2, where r is the INE, c is the number of heavy-Lys labeled PG subunit, and n is the overall number of PG subunits in a fragment. The normalized probability distribution describes the base peak intensity of muropeptides based on varying numbers of heavy-Lys incorporated. INE was determined by fitting the measured the base peak intensity ratios of fully labeled PG dimers without acetylation modification (HH) to their singly labeled dimer counterparts (HL) from Figure 2b. The peak ratio was 2.50 ± 0.21 (n = 3, 95% confidence interval), and the calculated INE of heavy-Lys was 83.30 ± 1.16% (n = 3, 95% confidence interval). The INE of heavy-Lys was assumed to be uniform for all muropeptides and independent of modifications.
| (2) |
Error Analysis
As shown in Figures 2 and 3, even small changes in heavy-Lys INE and ISE can adversely affect the SILAB-based LC-MS analysis of PG. A direct comparison without the correction between base peak intensities of unlabeled to fully labeled muropeptides can lead to large deviations of observed ratios that underestimates the actual values. Figure 3c shows calculated errors for PG dimer, trimer, tetramer, and pentamer as function of heavy-Lys ISE and INE. Errors are expressed as the fold difference between uncorrected peak intensity ratios and corrected ratios. The calculated error for the dimer used to determine ISE and INE with experimentally determined ISE of 98.33 ± 0.05% and INE of 83.23 ± 1.16% is 1.602, meaning that the uncorrected base peak intensity ratio of labeled to unlabeled underestimates the true ratio by 60%. This error increases drastically for larger oligomers for even slight changes in ISE and INE of heavy-Lys: in the case of a PG pentamer, calculated error for 95% ISE and 75% heavy-Lys INE is approximately 12 fold (arrow), or 1200% underestimation of the true SILAB-intensity ratio.
PG Cross-Linking
Corrected base peak intensity ratios of 47 selected muropeptide SILAB pairs were determined to characterize differences in the PG composition of E. faecalis between planktonic and biofilm growths. Selected muropeptides were sorted and grouped according to three major PG modifications: cross-linking, acetylation, and alanylation. Change in PG cross-linking (Figure 1b) was determined by examining all the SILAB ratios for muropeptide pairs for a particular oligomeric size and averaging them (Figure 4a). XICs of muropeptides with increasing degrees of oligomerization correlate with the increase in chromatographic retention time (Figure 4b). Representative mass spectra of these muropeptides in increasing oligomeric size show different isotopic distribution patterns between unlabeled muropeptides from planktonic cells (Figure 4c) and fully labeled muropeptides from cells in the biofilm (Figure 4d) as described in the previous section.
Figure 4. Cross-linking of PG.
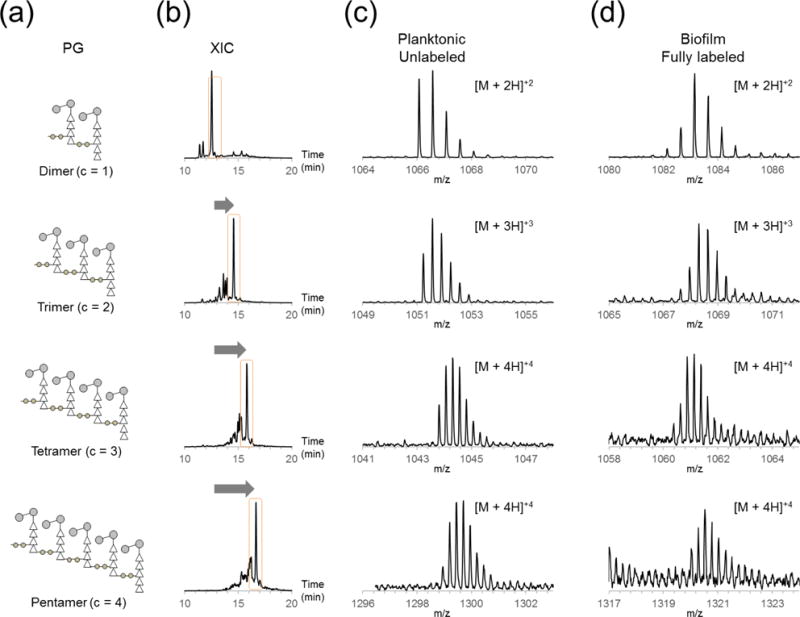
(a) Schematic representations of PG fragments with increasing number of cross-links ranging from 1 to 4 are shown, with corresponding XICs (b), and mass spectra of PG fragments from unlabeled planktonic (c) and fully labeled biofilm (d).
PG Acetylation
Changes to the acetylation of disaccharide is one of the major PG modifications found in E. faecalis. Types of acetylation changes considered for this study were O-acetylation by OatA adds an acetyl group at the C6 position of MurNAc that increases the mass of a PG-repeat unit by 42 Da, and N-deacetylation by PgdA removes the acetyl group from the C2 position of GlcNAc and decreases the mass by 42 Da. The O-acetyl group under mild base condition has been shown to be labile,41 but since the whole cells of planktonic and biofilm E. faecalis were combined for SILAB, we assume that the hydrolysis of labile O-acetyl group during PG isolation and reduction are uniform. For this analysis, we categorized muropeptides by their acetylation number, which is the sum of all acetylation changes to the muropeptide. Figure 5b shows schematic representations of a dimer with acetylation number of −1, 0, and +1. Net acetylation number may be a combination of multiple O-acetylations and N-deacetylations on the same disaccharide, although for this analysis the least number of modifications that result in an acetylation state were assumed to be most likely. The specific location of acetylation was not considered for this analysis. In general, increase in the muropeptide acetylation increases the retention time (Figure 5c). This combination of PG acetylation and oligomerization gives rise to an elution mixture with overlapping retention time for each PG with distinct modifications, highlighting the need for extracting chromatograms for specific m/z values from data. Inspection of the fully labeled N-deacetylated PG dimer from biofilm (Figure 5e, top right) shows that even modified PGs with lower abundance than their unmodified counterparts can be readily quantified using this method.
Figure 5. Acetylation of PG.
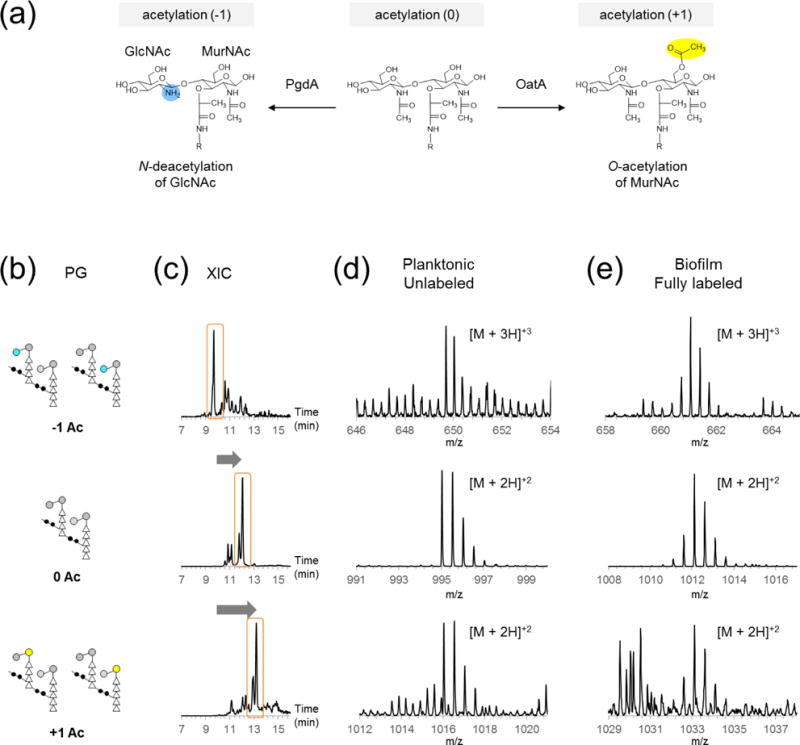
(a) Unmodified PG subunit (middle) can be N-deacetylated on GlcNAc (left) and/or O-acetylated on MurNAc (right). (b) Schematic representations for PG dimers with acetylation states ranging from −1 to 1 are shown, with corresponding XICs (c), and mass spectra of unlabeled (d) and fully labeled (e) PG fragments on right.
PG Alanylation
The term alanylation state here describes the net number of modifiable L,D-Ala present on a muropeptide fragment as compared to a tripeptide with no D-Ala and intact cross-linking bridge of two L-Ala (Figure 6a). For example, one possible structure for a dimer with the alanylation state of 0 has an acceptor tripeptide stem structure cross-linked to a tetrapeptide donor stem missing the L-Ala-L-Ala bridge (Figure 6a, top), while alanylation state of +2 can refer to two muropeptide structures where two Alanine are found as either D-Ala-D-Ala in the PG stem or L-Ala-L-Ala in the bridge structure. Like acetylation, increase in the alanylation state of muropeptide increases the retention time (Figure 6b) and causes further overlaps in the elution profile. Mass spectra of muropeptides with varying degrees of alanylation from planktonic (unlabeled) and biofilm (fully labeled) samples are shown in Figures 7c and 7d.
Figure 6. Alanylation of PG.
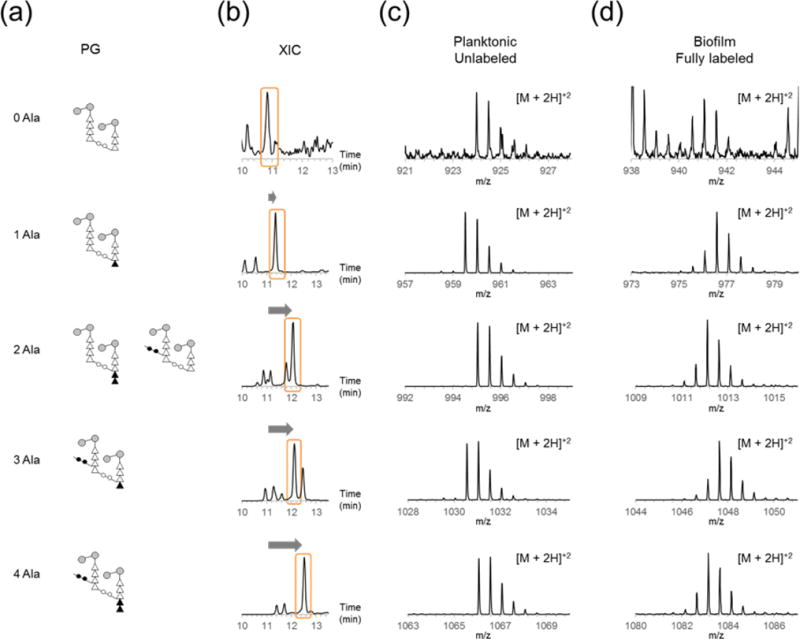
(a) Schematic representations for PG dimers with varying numbers of D-Ala in the terminal PG subunit’s peptide stem and L-Ala in the unlinked cross-linker bridge show different combinations of stem and bridge lengths that result in alanylation number. (b) XICs and mass spectra of unlabeled (c) and fully labeled (d) PG fragments with the alanylation number that corresponds to (a) are shown.
Figure 7. Profile of peptidoglycan SILAB pairs.
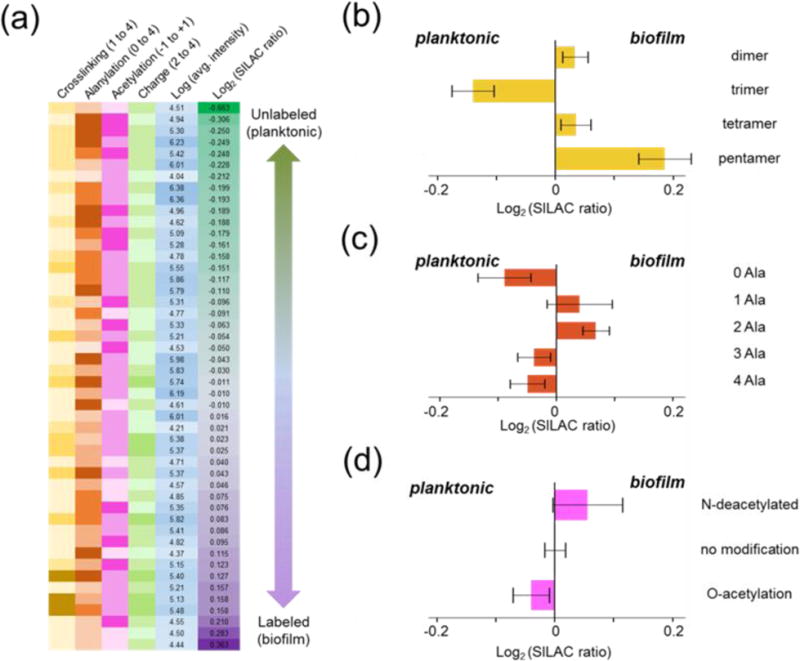
(a) Log2 values of intensity ratios for PG SILAB pairs are listed in increasing order. Darker shades for modifications indicate a higher degrees of cross-linking (yellow), alanylation number (brown), acetylation state (pink), and fragment charge state (green). Log10 of average intensities of the more abundant fragment from each SILAB pair (n = 3) are shown in similar fashion (blue). Ratios of corresponding SILAB pairs are listed next to the average intensities. (b, c, d) Average Log2 SILAB ratios for fragments with different numbers of cross-links (b), alanylation (c), and acetylation state (d) are depicted, with negative Log values indicating higher abundance of fragments from the planktonic sample, and positive values the biofilm sample. Error bars represent standard error of mean (n = 3).
PG Composition of E. faecalis Biofilm
Corrected intensity ratios of 47 selected muropeptide SILAB pairs for PG from isolated cell wall of planktonic (natural abundance) and biofilm E. faecalis (heavy-Lys labeled) are shown in Figure 7a. The SILAB ratios were compensated with calculated correction factors based on ISE of 98.33 ± 0.05% and INE of 83.23 ± 1.16% for heavy-Lys. Each muropeptide species is categorized based on oligomerization (yellow), alanylation (brown), and acetylation (pink) with darker shades representing increase in the degree of each modification on the muropeptide fragment. The ratio averages are sorted according to their logarithmic values so that lowest values representing higher intensity from the planktonic sample are at the top and highest values with higher intensity from the biofilm sample are at the bottom.
For comparative analysis, all muropeptide pairs were first categorized by their PG modifications: oligomerization, alanylation, and acetylation. Then Log2 values of SILAB-intensity ratios were grouped by category to evaluate trends towards PG oligomerization (Figure 7b), alanylation (Figure 7c), and acetylation (Figure 7d). This representation provided a comprehensive overview of differences in the PG composition of E. faecalis grown in either planktonic suspension or biofilm. One noticeable difference was the higher abundance of highly cross-linked pentamers from biofilm with the Log2 (SILAB ratio) of 0.188 ± 0.101. This was accompanied by reduction of smaller oligomers, with trimers in biofilm having the Log2 (SILAB ratio) of −0.140 ± 0.073 (Figure 7b). These values are consistent with increased PG cross-linking in the cell wall of E. faecalis in biofilm.
Another difference between planktonic and biofilm phases was the higher abundance of muropeptides with alanylation states of −1 and 0 in biofilm. These changes indicate PG-stem editing and bridge attachment in ways such that D-Ala-D-Ala from PG-stems and/or L-Ala-L-Ala bridge not involved in the cross-linking are present in lower amounts in the cell wall of E. faecalis in biofilm. In contrast, cell wall from planktonic bacteria contain more PG with alanylation states of 1 and 2 as compared to biofilm, which corresponds to muropeptides with tetrapeptide and pentapeptide stem structures (Figure 7c). We also observed that PG fragments with alanylation state of −2, which corresponds to muropeptides with tripeptide stems missing the bridge structure and thus unable to function as neither donor nor acceptor in forming cross-links, are preferentially found in planktonic bacteria. Although the exact role of such bridge-less muropeptides (alanylation state of −2) is unknown, their prevalence in planktonic bacteria as compared to sessile bacteria from biofilm suggests that these likely play an important role in actively growing and dividing cell wall.
Lastly, PG in biofilm shows a trend towards N-deacetylated muropeptides with Log2 (SILAB ratio) of 0.056 ± 0.121. Increased N-deacetylation was accompanied by a decrease in O-acetylated muropeptides with the Log2 (SILAB ratio) of −0.040 ± 0.063 (Figure 7d). While averages of all ratios are not statistically different, the percent of selected pairs that tend towards biofilm for N-deacetylated PG fragments is 66.7% while the percent of pairs that favor planktonic for O-acetylated PG fragments is 61.5%, thus hinting that acetylation may play a role in the biofilm formation. Although both N-deacetylation and O-acetylation of PG have been previously correlated with the lysozyme resistance, their roles in biofilm formation and function remain unknown.
CONCLUSION
In this study we developed a bacterial labeling method SILAB, analogous to SILAC, that analyzes differences in the PG composition of E. faecalis between planktonic and biofilm growths. Both planktonic and biofilm bacteria were grown under identical conditions, where the only difference between the samples was that suspended planktonic bacteria were harvested from the liquid media whereas biofilm was harvested by physically separating bacteria that were attached to the bottom of wells (Figure 1d). This approach ensured that observed differences are solely due to the location of bacterial growths as planktonic or biofilm. Resulting SILAB LC-MS analysis of 47 muropeptide pairs from mutanolysin digested isolated cell walls of E. faecalis was made possible through determining in situ ISE and INE for labeled Lysine into PG, which were measured to be 98.33% ± 0.05% for ISE (Figure 2) and 83.23 ± 1.16% for INE.
We found that even with the high concentration of exogenous heavy-Lys (100 mg/L) provisioned in defined growth media, endogenous L-Lys biosynthesis diluted the heavy-Lys incorporation. A small change in either INE or ISE can severely impair the SILAB analysis as fully labeled muropeptides would be underrepresented and unlabeled muropeptides would be overrepresented by dilution of the label (Figure 3). Failures to account for lower than 100% ISE and INE can lead to large errors that disproportionally affect quantification of larger muropeptides, which in turn would pose difficulties in ascertaining true differences arising from two different conditions (Figure 3c). Our analytical approach utilized compensations for these errors through determining ISE and INE of heavy-Lys directly from the data, which simplified the experimental setup. This enabled a direct comparison between the PG composition of E. faecalis grown as planktonic bacteria and biofilm. We found that the PG from bacteria in biofilm exhibits increased PG cross-linking in addition to stem modifications by D,D- and L,D-carboxypeptidases, which are indicative of low cell wall turnover rate that allows more time for these modifications to occur. Biofilm also showed increased N-deacetylation of MurNAc and decreased O-acetylation of GlcNAc in PG, which may play a role in the overall charge of the cell wall and alter the interaction between PG and dissolved ions. We speculate that N-deacetylation may play the important role of modulating charge characteristics of PG by introducing positive charge through the removal of acetyl groups from GlcNAc in PG. This could potentially affect the bacterial attachment to both abiotic surfaces and the host organism, while simultaneously enhancing bacteria-to-bacteria aggregation through ionic interactions between charged biopolymers that initiate biofilm formation and growth.
Acknowledgments
The authors acknowledge the Baylor University Mass Spectrometry Center for support. The authors thank Dr. Andreas Ipsen for helpful suggestions.
Funding Sources
This paper is based on work supported by the National Institutes of Health Grant GM116130.
ABBREVIATIONS
- GlcNAc
N-acetylglucosamine
- ISE
isotopic enrichment
- INE
incorporation efficiency
- LC-MS
liquid chromatography-mass spectrometry
- lipid II
N-acetylglucosamine-N-acetyl-muramyl-pentapeptide-pyrophosphoryl-undecaprenol
- MIC
minimum inhibitory concentration
- MurNAc
N-acetylmuramic acid
- NMR
nuclear magnetic resonance
- PG
peptidoglycan
- SILAB
stable isotope labeling by amino acids in bacterial culture
- SILAC
stable isotope labeling by amino acids in cell culture
- VRE
vancomycin-resistant enterococci
- VRSA
vancomycin-resistant S. aureus
- XIC
extracted ion chromatogram
Footnotes
Author Contributions
All authors analyzed the data and contributed to the writing of the manuscript.
Competing Financial Interests
The authors declare no competing financial interests.
References
- 1.Bouhss A, Josseaume N, Allanic D, Crouvoisier M, Gutmann L, Mainardi JL, Mengin-Lecreulx D, van Heijenoort J, Arthur M. Identification of the UDP-MurNAc-pentapeptide:L-alanine ligase for synthesis of branched peptidoglycan precursors in Enterococcus faecalis. J Bacteriol. 2001;183:5122–5127. doi: 10.1128/JB.183.17.5122-5127.2001. [DOI] [PMC free article] [PubMed] [Google Scholar]
- 2.Bouhss A, Josseaume N, Severin A, Tabei K, Hugonnet JE, Shlaes D, Mengin-Lecreulx D, Van Heijenoort J, Arthur M. Synthesis of the L-alanyl-L-alanine cross-bridge of Enterococcus faecalis peptidoglycan. J Biol Chem. 2002;277:45935–45941. doi: 10.1074/jbc.M207449200. [DOI] [PubMed] [Google Scholar]
- 3.van Heijenoort J. Formation of the glycan chains in the synthesis of bacterial peptidoglycan. Glycobiology. 2001;11:25R–36R. doi: 10.1093/glycob/11.3.25r. [DOI] [PubMed] [Google Scholar]
- 4.Typas A, Banzhaf M, Gross CA, Vollmer W. From the regulation of peptidoglycan synthesis to bacterial growth and morphology. Nat Rev Microbiol. 2011;10:123–136. doi: 10.1038/nrmicro2677. [DOI] [PMC free article] [PubMed] [Google Scholar]
- 5.Boneca IG, Dussurget O, Cabanes D, Nahori MA, Sousa S, Lecuit M, Psylinakis E, Bouriotis V, Hugot JP, Giovannini M, Coyle A, Bertin J, Namane A, Rousselle JC, Cayet N, Prevost MC, Balloy V, Chignard M, Philpott DJ, Cossart P, Girardin SE. A critical role for peptidoglycan N-deacetylation in Listeria evasion from the host innate immune system. Proc Natl Acad Sci U S A. 2007;104:997–1002. doi: 10.1073/pnas.0609672104. [DOI] [PMC free article] [PubMed] [Google Scholar]
- 6.Vollmer W. Structural variation in the glycan strands of bacterial peptidoglycan. FEMS Microbiol Rev. 2008;32:287–306. doi: 10.1111/j.1574-6976.2007.00088.x. [DOI] [PubMed] [Google Scholar]
- 7.Moynihan PJ, Sychantha D, Clarke AJ. Chemical biology of peptidoglycan acetylation and deacetylation. Bioorg Chem. 2014;54:44–50. doi: 10.1016/j.bioorg.2014.03.010. [DOI] [PubMed] [Google Scholar]
- 8.Gutmann L, Billot-Klein D, al-Obeid S, Klare I, Francoual S, Collatz E, van Heijenoort J. Inducible carboxypeptidase activity in vancomycin-resistant enterococci. Antimicrob Agents Chemother. 1992;36:77–80. doi: 10.1128/aac.36.1.77. [DOI] [PMC free article] [PubMed] [Google Scholar]
- 9.Tran TT, Panesso D, Mishra NN, Mileykovskaya E, Guan Z, Munita JM, Reyes J, Diaz L, Weinstock GM, Murray BE, Shamoo Y, Dowhan W, Bayer AS, Arias CA. Daptomycin-resistant Enterococcus faecalis diverts the antibiotic molecule from the division septum and remodels cell membrane phospholipids. MBio. 2013;4:e00281–00213. doi: 10.1128/mBio.00281-13. [DOI] [PMC free article] [PubMed] [Google Scholar]
- 10.Singh M, Chang J, Coffman L, Kim SJ. Solid-state NMR characterization of amphomycin effects on peptidoglycan and wall teichoic acid biosyntheses in Staphylococcus aureus. Sci Rep. 2016;6:31757. doi: 10.1038/srep31757. [DOI] [PMC free article] [PubMed] [Google Scholar]
- 11.Chang J, Foster EE, Wallace A, Kim SJ. Peptidoglycan O-acetylation increases in response to vancomycin treatment in vancomycin-resistant Enterococcus faecalis. Sci Rep. 2017;7:46500. doi: 10.1038/srep46500. [DOI] [PMC free article] [PubMed] [Google Scholar]
- 12.Kim SJ, Singh M, Sharif S, Schaefer J. Desleucyl-oritavancin with a damaged d-Ala-d-Ala binding site inhibits the transpeptidation step of cell-wall biosynthesis in whole cells of Staphylococcus aureus. Biochemistry. 2017;56:1529–1535. doi: 10.1021/acs.biochem.6b01125. [DOI] [PMC free article] [PubMed] [Google Scholar]
- 13.O’Connor RD, Singh M, Chang J, Kim SJ, VanNieuwenhze M, Schaefer J. Dual mode of action for plusbacin A3 in Staphylococcus aureus. J Phys Chem B. 2017;121:1499–1505. doi: 10.1021/acs.jpcb.6b11039. [DOI] [PMC free article] [PubMed] [Google Scholar]
- 14.Arthur M, Molinas C, Bugg TD, Wright GD, Walsh CT, Courvalin P. Evidence for in vivo incorporation of D-lactate into peptidoglycan precursors of vancomycin-resistant enterococci. Antimicrob Agents Chemother. 1992;36:867–869. doi: 10.1128/aac.36.4.867. [DOI] [PMC free article] [PubMed] [Google Scholar]
- 15.Meziane-Cherif D, Stogios PJ, Evdokimova E, Savchenko A, Courvalin P. Structural basis for the evolution of vancomycin resistance D, D-peptidases. Proc Natl Acad Sci U S A. 2014;111:5872–5877. doi: 10.1073/pnas.1402259111. [DOI] [PMC free article] [PubMed] [Google Scholar]
- 16.Rohrer S, Berger-Bachi B. FemABX peptidyl transferases: a link between branched-chain cell wall peptide formation and beta-lactam resistance in gram-positive cocci. Antimicrob Agents Chemother. 2003;47:837–846. doi: 10.1128/AAC.47.3.837-846.2003. [DOI] [PMC free article] [PubMed] [Google Scholar]
- 17.Clarke AJ, Dupont C. O-acetylated peptidoglycan: its occurrence, pathobiological significance, and biosynthesis. Can J Microbiol. 1992;38:85–91. doi: 10.1139/m92-014. [DOI] [PubMed] [Google Scholar]
- 18.Pfeffer JM, Strating H, Weadge JT, Clarke AJ. Peptidoglycan O acetylation and autolysin profile of Enterococcus faecalis in the viable but nonculturable state. J Bacteriol. 2006;188:902–908. doi: 10.1128/JB.188.3.902-908.2006. [DOI] [PMC free article] [PubMed] [Google Scholar]
- 19.Benachour A, Ladjouzi R, Le Jeune A, Hebert L, Thorpe S, Courtin P, Chapot-Chartier MP, Prajsnar TK, Foster SJ, Mesnage S. The lysozyme-induced peptidoglycan N-acetylglucosamine deacetylase PgdA (EF1843) is required for Enterococcus faecalis virulence. J Bacteriol. 2012;194:6066–6073. doi: 10.1128/JB.00981-12. [DOI] [PMC free article] [PubMed] [Google Scholar]
- 20.Kim SJ, Chang J, Singh M. Peptidoglycan architecture of Gram-positive bacteria by solid-state NMR. Biochim Biophys Acta. 2015;1848:350–362. doi: 10.1016/j.bbamem.2014.05.031. [DOI] [PMC free article] [PubMed] [Google Scholar]
- 21.Singh M, Kim SJ, Sharif S, Preobrazhenskaya M, Schaefer J. REDOR constraints on the peptidoglycan lattice architecture of Staphylococcus aureus and its FemA mutant. Biochim Biophys Acta. 2015;1848:363–368. doi: 10.1016/j.bbamem.2014.05.025. [DOI] [PMC free article] [PubMed] [Google Scholar]
- 22.Kim SJ, Singh M, Sharif S, Schaefer J. Cross-link formation and peptidoglycan lattice assembly in the FemA mutant of Staphylococcus aureus. Biochemistry. 2014;53:1420–1427. doi: 10.1021/bi4016742. [DOI] [PMC free article] [PubMed] [Google Scholar]
- 23.Sharif S, Kim SJ, Labischinski H, Chen J, Schaefer J. Uniformity of glycyl bridge lengths in the mature cell walls of fem mutants of methicillin-resistant Staphylococcus aureus. J Bacteriol. 2013;195:1421–1427. doi: 10.1128/JB.01471-12. [DOI] [PMC free article] [PubMed] [Google Scholar]
- 24.Kim SJ, Singh M, Preobrazhenskaya M, Schaefer J. Staphylococcus aureus peptidoglycan stem packing by rotational-echo double resonance NMR spectroscopy. Biochemistry. 2013;52:3651–3659. doi: 10.1021/bi4005039. [DOI] [PMC free article] [PubMed] [Google Scholar]
- 25.Sharif S, Kim SJ, Labischinski H, Schaefer J. Characterization of peptidoglycan in fem-deletion mutants of methicillin-resistant Staphylococcus aureus by solid-state NMR. Biochemistry. 2009;48:3100–3108. doi: 10.1021/bi801750u. [DOI] [PMC free article] [PubMed] [Google Scholar]
- 26.Patti GJ, Kim SJ, Schaefer J. Characterization of the peptidoglycan of vancomycin-susceptible Enterococcus faecium. Biochemistry. 2008;47:8378–8385. doi: 10.1021/bi8008032. [DOI] [PMC free article] [PubMed] [Google Scholar]
- 27.Patti GJ, Chen J, Schaefer J, Gross ML. Characterization of structural variations in the peptidoglycan of vancomycin-susceptible Enterococcus faecium: understanding glycopeptide-antibiotic binding sites using mass spectrometry. J Am Soc Mass Spectrom. 2008;19:1467–1475. doi: 10.1016/j.jasms.2008.06.020. [DOI] [PMC free article] [PubMed] [Google Scholar]
- 28.Figueiredo TA, Sobral RG, Ludovice AM, Almeida JM, Bui NK, Vollmer W, de Lencastre H, Tomasz A. Identification of genetic determinants and enzymes involved with the amidation of glutamic acid residues in the peptidoglycan of Staphylococcus aureus. PLoS Pathog. 2012;8:e1002508. doi: 10.1371/journal.ppat.1002508. [DOI] [PMC free article] [PubMed] [Google Scholar]
- 29.Bern M, Beniston R, Mesnage S. Towards an automated analysis of bacterial peptidoglycan structure. Anal Bioanal Chem. 2017;409:551–560. doi: 10.1007/s00216-016-9857-5. [DOI] [PMC free article] [PubMed] [Google Scholar]
- 30.Sieradzki K, Tomasz A. Inhibition of cell wall turnover and autolysis by vancomycin in a highly vancomycin-resistant mutant of Staphylococcus aureus. J Bacteriol. 1997;179:2557–2566. doi: 10.1128/jb.179.8.2557-2566.1997. [DOI] [PMC free article] [PubMed] [Google Scholar]
- 31.Chang JD, Foster EE, Yang H, Kim SJ. Quantification of the d-Ala-d-Lac-terminated peptidoglycan structure in vancomycin-resistant Enterococcus faecalis using a combined solid-state nuclear magnetic resonance and mass spectrometry analysis. Biochemistry. 2017;56:612–622. doi: 10.1021/acs.biochem.6b00774. [DOI] [PMC free article] [PubMed] [Google Scholar]
- 32.Dieterich DC, Link AJ, Graumann J, Tirrell DA, Schuman EM. Selective identification of newly synthesized proteins in mammalian cells using bioorthogonal noncanonical amino acid tagging (BONCAT) Proc Natl Acad Sci U S A. 2006;103:9482–9487. doi: 10.1073/pnas.0601637103. [DOI] [PMC free article] [PubMed] [Google Scholar]
- 33.Hilger M, Mann M. Triple SILAC to determine stimulus specific interactions in the Wnt pathway. J Proteome Res. 2012;11:982–994. doi: 10.1021/pr200740a. [DOI] [PMC free article] [PubMed] [Google Scholar]
- 34.Aebersold R, Mann M. Mass-spectrometric exploration of proteome structure and function. Nature. 2016;537:347–355. doi: 10.1038/nature19949. [DOI] [PubMed] [Google Scholar]
- 35.MacLeod AK, Fallon PG, Sharp S, Henderson CJ, Wolf CR, Huang JT. An enhanced in vivo stable isotope labeling by amino acids in cell culture (SILAC) model for quantification of drug metabolism enzymes. Mol Cell Proteomics. 2015;14:750–760. doi: 10.1074/mcp.M114.043661. [DOI] [PMC free article] [PubMed] [Google Scholar]
- 36.Ong SE, Blagoev B, Kratchmarova I, Kristensen DB, Steen H, Pandey A, Mann M. Stable isotope labeling by amino acids in cell culture, SILAC, as a simple and accurate approach to expression proteomics. Mol Cell Proteomics. 2002;1:376–386. doi: 10.1074/mcp.m200025-mcp200. [DOI] [PubMed] [Google Scholar]
- 37.Mann M, Kulak NA, Nagaraj N, Cox J. The coming age of complete, accurate, and ubiquitous proteomes. Mol Cell. 2013;49:583–590. doi: 10.1016/j.molcel.2013.01.029. [DOI] [PubMed] [Google Scholar]
- 38.Frohlich F, Christiano R, Walther TC. Native SILAC: metabolic labeling of proteins in prototroph microorganisms based on lysine synthesis regulation. Mol Cell Proteomics. 2013;12:1995–2005. doi: 10.1074/mcp.M112.025742. [DOI] [PMC free article] [PubMed] [Google Scholar]
- 39.Phillips NJ, Steichen CT, Schilling B, Post DM, Niles RK, Bair TB, Falsetta ML, Apicella MA, Gibson BW. Proteomic analysis of Neisseria gonorrhoeae biofilms shows shift to anaerobic respiration and changes in nutrient transport and outermembrane proteins. PLoS One. 2012;7:e38303. doi: 10.1371/journal.pone.0038303. [DOI] [PMC free article] [PubMed] [Google Scholar]
- 40.Patti GJ, Kim SJ, Yu TY, Dietrich E, Tanaka KS, Parr TR, Jr, Far AR, Schaefer J. Vancomycin and oritavancin have different modes of action in Enterococcus faecium. J Mol Biol. 2009;392:1178–1191. doi: 10.1016/j.jmb.2009.06.064. [DOI] [PMC free article] [PubMed] [Google Scholar]
- 41.Dupont C, Clarke AJ. In vitro synthesis and O acetylation of peptidoglycan by permeabilized cells of Proteus mirabilis. J Bacteriol. 1991;173:4618–4624. doi: 10.1128/jb.173.15.4618-4624.1991. [DOI] [PMC free article] [PubMed] [Google Scholar]


