

Abstract
A potent, non-cytotoxic indazole sulfonamide was identified by high-throughput screening of >100,000 synthetic compounds for activity against Mycobacterium tuberculosis (Mtb). This non-cytotoxic compound did not directly inhibit cell wall biogenesis but triggered a slow lysis of Mtb cells as measured by release of intracellular green fluorescent protein (GFP). Isolation of resistant mutants followed by whole-genome sequencing showed an unusual gene amplification of a 40 gene region spanning Rv3371 to Rv3411c and in one case a potential promoter mutation upstream of guaB2 (Rv3411c) encoding inosine monophosphate dehydrogenase (IMPDH). Subsequent biochemical validation confirmed direct inhibition of IMPDH by an uncompetitive mode of inhibition and growth inhibition could be rescued by supplementation with guanine, a bypass mechanism for the IMPDH pathway. Beads containing immobilized indazole sulfonamides specifically interacted with IMPDH in cell lysates. X-ray crystallography of the IMPDH-IMP-inhibitor complex revealed that the primary interactions of these compounds with IMPDH were direct pi-pi interactions with the IMP substrate. Advanced lead compounds in this series with acceptable pharmacokinetic properties failed to show efficacy in acute or chronic murine models of tuberculosis (TB). Time-kill experiments in vitro suggest that sustained exposure to drug concentrations above MIC for 24 hours were required for a cidal effect, levels that have been difficult to achieve in vivo. Direct measurement of guanine levels in resected lung tissue from tuberculosis infected animals and patients revealed 0.5–2 mM concentrations in caseum and normal lung tissue. The high lesional levels of guanine and the slow lytic, growth-rate dependent, effect of IMPDH inhibition pose challenges to developing drugs against this target for use in treating TB.
Keywords: Target validation, IMPDH, guanine, purine salvage, Mycobacterium tuberculosis, indazole sulfonamide
INTRODUCTION
As the incidence of drug-resistant tuberculosis (TB) continues to worsen, there is a pressing need for new agents to treat this recalcitrant disease 1. One of the key drivers of drug-resistance is the lengthy 6-month course of therapy that must be completed to achieve sterile cure in patients 2, 3. Therefore many current TB drug discovery programs focus on strategies to reduce treatment duration, often by prioritizing efforts to inhibit targets other than those already inhibited by current front-line therapies. Because of the historical difficulty of translating the products of target-based medicinal chemistry into compounds with whole-cell activity in the antibacterial field, many drug discovery efforts begin with the target-agnostic process of whole-cell screening for growth inhibition 4.
Series with whole-cell potency against Mtb resulting from such screening programs offer an attractive starting point for lead optimization efforts but understanding target novelty requires deconvolution of the molecular mechanism of cell death induced by that series. We have previously proposed whole genome sequencing of resistant mutants as a scalable technique to identify SNPs within potential targets and shown that this works with a small set of screening hits 5. This methodology works well for small molecule hits that directly interact with a single protein target but screening hits may, of course, have a more complex mechanism. Even where a single enzyme targeted by a single inhibitor is the predominant mechanism of inhibition of cell growth, whole genome sequencing sometimes gives surprising results that do not immediately provide a clear candidate for the protein target.
Mtb possesses the enzymatic machinery to either synthesize purine nucleotides de novo or scavenge them from the host to provide the essential nucleotides required for DNA synthesis 6, 7. Mtb was the first bacterium from which an adenosine kinase activity was identified and low local concentrations of adenosine are thought to be a feature of at least some tuberculous lesion types 8, 9. The de novo biosynthetic pathway for guanine-containing nucleotides as well as the salvage pathways of purine nucleotides that yield inosine and hypoxanthine as intermediates (Fig. 1), all pass through a common intermediate, inosine 5’-monophosphate, to derive the required guanine and adenine containing deoxynucleotide precursors for DNA synthesis. Guanine-containing precursors in particular require conversion of inosine 5’-monophosphate to xanthine 5’-monophosphate through the action of inosine 5’-monophosphate dehydrogenase (IMPDH). Mtb encodes three apparent homologs of IMPDH on its chromosome (guaB1, guaB2 and guaB3) but only one (guaB2, Rv3411c) has been shown to be essential and to catalyze the NAD+-dependent dehydrogenation and hydrolysis of inosine 5’-monophosphate to xanthine 5’-monophosphate 10, 11. Several series of small molecule inhibitors of IMPDH have been developed and recently crystal structures of a truncated form of the Mtb enzyme in complex with these inhibitors have appeared 10, 12–14. In general the whole cell activity of these inhibitors has been only in the 1–10 µM range.
Figure 1. Purine salvage pathway.

IMP, Inosine monophosphate; GMPS, guanosine monophosphate synthase; XMP, Xanthosine monophosphate; GMP, guanine monophosphate; HGPRT, hypoxanthine guanine phosphoribosyltransferase; PNP, purine nucleoside phosphorylase
In this work, we identified a novel scaffold that targets IMPDH with low micromolar potency against Mtb. The cellular mechanism of this compound was demonstrated by selection of resistant mutants that resulted in amplification of guaB2 gene expression as well as by the ability of exogenously supplied guanine to rescue their inhibition. We report the kinetics of enzyme inhibition and were able to show by structural analyses that the inhibitor bound to the IMP cofactor in the enzyme active site. Despite the cidality of these IMPDH inhibitors in vitro, these compound had limited efficacy in vivo and further quantification of guanine in granulomas from infected human and rabbit tissues, showed high local concentrations of this nucleotide precursor limiting the potential of IMPDH as a drug target for Mtb.
RESULTS
Identification and phenotypic characterization of an antitubercular indazole sulfonamide scaffold
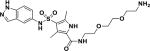
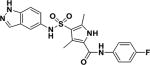
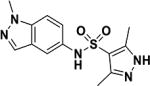
In a screen of 100,000 compounds for inhibitors of growth of Mtb (manuscript in preparation), an indazole sulfonamide (1) was discovered with low micromolar potency against the organism (Table 1). This compound was attractive from a medicinal chemistry perspective based on its lack of cytotoxicity, acceptable physicochemical properties, high solubility, synthetic feasibility (Supplementary method Scheme 1) and acceptable in vitro absorption-distribution-metabolism values (Table S1).
Table 1.
Indazole sulfonamides in this work and their anti-tubercular potencies
| Compound ID | Structure | MIC (µM)a |
|---|---|---|
| 1 |
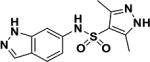
|
2 |
| 2 |
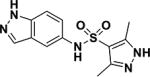
|
2 |
| 3 |
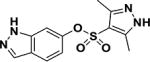
|
>50 |
| 4 |
|
6.2 |
| 5 |
|
9.5 |
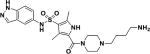
| 6 |
|
0.09 |
| 7 |
|
>50 |
MIC values for compounds 1–4 are for Mtb H37Rv and for compounds 5–7 are for M. bovis BCG. MIC for compounds 6 and 6 against Mtb H37Rv were 0.2 and >50 µM, respectively.
Scheme 1.

Reagents and conditions: a) 5- or 6-indazole (1 eq.), sulfonyl chloride (1 eq.), 3, 5-lutidine (4 eq.), DCM (2 mL/mmol), 16 h, rt. b) Indazole (1 eq.), sulfonyl chloride (1.2 eq.), pyridine (0.67 mL/mmol), 16 h, 80 °C
A literature search showed no precedent to guide an understanding of its possible mechanism of action. Since many anti-tubercular drugs in clinical use, and in the drug development pipeline, target aspects of cell wall biosynthesis, we first set out to evaluate this. We had previously developed an assay that measures the extent of upregulation of the promoter of the iniBAC gene cluster, known to be induced by inhibitors of cell wall biosynthesis 15, by generating a reporter construct where this promoter drives expression of firefly luciferase 16. Drugs such as isoniazid, ethionamide, SQ109 and ethambutol that inhibit cell wall mycolate or arabinan biosynthesis, increase luciferase expression in the first 48 hours of exposure 16. Initial profiling of compound 1 indicated that this promoter was not upregulated at these early time points, but was upregulated after 72 hours of drug exposure suggesting a possible downstream effect on cell wall synthesis (Fig. 2A). To further confirm an effect on cell wall integrity, we measured the kinetics of extracellular release of an intracellularly expressed green fluorescent protein 17 during compound exposure. GFP was released from bacteria indicating that the compound was lytic and these effects were observed to be subsequent to the upregulation of the iniBAC promoter (Fig. 2B).
Figure 2. Indazole sulfonamides induce slow lysis of whole cells of Mtb by a mechanism involving perturbation of purine metabolite pools.

A. Effects of compounds 1 (C1), 2 (C2), isoniazid and moxifloxacin at their MIC concentrations on expression of the cell wall responsive iniBAC promoter as measured using the pini-luc strain. B. C1 results in release of cytosolic proteins as measured by GFP-based fluorescence in culture supernatant during exposure to the compound. C. Scanning (rows 1 and 2) and transmission (row 3) electron microscopy of untreated or C1 exposed cells at 1× (column 2) or 10X MIC values. D. The indazole sulfonamides do not inhibit peptidoglycan biosynthesis at 1X and 10X MIC concentrations as measured by radiolabeling of the macromolecule using 14C-N-acetyl-D-glucosamine. The positive controls meropenem/clavulanate (MCA) and tunicamycin were used at 10X MIC values.
To understand better the effects of the indazole sulfonamide on the integrity of the cell wall ultrastructural architecture, we analyzed exposed cells by scanning electron microscopy at time points corresponding to early stages of cell lysis. Compound 1 caused the same polar swelling and cellular elongation observed with β-lactams 17(Fig. 2C). Transmission electron microscopy revealed a similar accumulation of electron-opaque density in the periplasmic region separating the plasma membrane from the outer cell wall layers as had been observed in cells treated with other inhibitors of cell wall biosynthesis 18(Fig. 2C). These results suggested that an aspect of cell wall biosynthesis was inhibited, possibly peptidoglycan. However, a macromolecular incorporation assay using radiolabeled N-acetylglucosamine to quantitate effects on peptidoglycan biosynthesis, revealed that compound 1 did not affect incorporation of this precursor into this macromolecule (Fig. 2D).
To investigate the effects of the indazole sulfonamide on the metabolism of Mtb, we exposed monolayers of cells to increasing concentrations of both an active analog (1) as well as a poorly active sulfonate derivative (3) (Table 1) of this compound. Unbiased analysis of the corresponding metabolic pathways indicated that purine metabolism was the most affected pathway with 9 out of 92 total enzymatic reactions in this pathway showing perturbations in metabolite pools (Tables 2 and S2). Table 2 shows the detailed results of the pathway analysis obtained using the pathway tool MetaboAnalyst 3.019. Metabolomic analysis of the purine biosynthetic pathway showed that at equimolar concentrations, the active analog (1) resulted in profiles distinct from that of the poorly active derivative (3) with marked accumulation of inosine-based nucleotides as well as several pyrimidine and adenine-based nucleotides (Fig. 2A). The concomitant decrease in xanthosine monophosphate led us to examine the dose dependent effects of compound 1 on intracellular inosine monophosphate (IMP), xanthosine monophosphate (XMP) and GMP which showed that the accumulation of IMP was inversely associated with concentrations in XMP and GMP pools (Fig. 3B).
Table 2.
Pathway enrichment analysis of compound 1 on the Mtb metabolome
| Pathway | Hitsa | Totalb | Raw p valuec | Holm adjusted p valued |
FDRe |
|---|---|---|---|---|---|
| Purine metabolism | 9 | 92 | 3.9E-08 | 3.16E-06 | 3.16E-06 |
| Lysine biosynthesis | 4 | 32 | 0.00016 | 0.012 | 0.006 |
| Arginine/proline metabolism | 4 | 77 | 0.0046 | 0.356 | 0.122 |
| Pyrimidine metabolism | 3 | 60 | 0.016 | 1 | 0.312 |
| Alanine, aspartate and glutamate metabolism | 2 | 24 | 0.019 | 1 | 0.312 |
| Aminosugar and nucleotide sugar metabolism | 3 | 88 | 0.044 | 1 | 0.587 |
the actual number of matched compounds within the associated pathway;
the total number of compounds in the pathway; the column labeled ‘Hits’ indicates;
original/uncorrected p value calculated from the enrichment analysis;
the p value adjusted by Holm-Bonferroni method;
the FDR is the p value adjusted using False Discovery Rate.
Figure 3. Indazole sulfonamides induce accumulation of IMP and reduction of XMP and GMP levels.

A. Heatmap of intracellular metabolite concentrations in purine metabolism as a function of concentration of active (AC) and inactive (IN) analogs 1 and 3, respectively. Cells were treated with analogs at equimolar concentrations corresponding to 0, 0.5, 1, 5 and 10X MIC values of C1. B. C1 results in dose dependent intrabacterial (IB) accumulation of IMP with concomitant decreases in XMP and GMP metabolite pools likely as a result of IMPDH inhibition.
Mutants with acquired resistance suggest guaB2 overexpression
We selected for mutants that were spontaneously resistant to 10-fold MIC levels of compound 1 and compound 2 (Table 1) on solid media and found that these appeared at a frequency of 1 × 10⁻⁹. These mutants were subsequently confirmed to be 8- and greater than 32-fold resistant to the sulfonamide scaffold (Table 3). Whole genome sequencing of 2 mutants that were obtained revealed that, while both had single nucleotide polymorphisms (SNPs) in nadD (encoding the nicotinate-nucleotide adenylyltransferase), one mutant had a SNP in the likely promoter region of guaB2 (Rv3411c) whereas the other mutant had an approximately 20-fold duplication of a 50kb genomic region spanning Rv3371 to Rv3411c (Fig. 4A, Table 3).
Table 3.
Mutation of indazole sulfonamide resistant mutants
| ID | Deletions | Duplications | SNPs | MIC (fold) |
|---|---|---|---|---|
| SR2.1 | plcD | ~20-fold duplication of Rv3371-Rv3411c | nadD:G180A | 32~64 |
| Rv1787- Rv1790 | ||||
| SR2.2 | None | None | nadD:V14I, nrdZ:C67F | 8 |
| G>A :−49 bp of Rv3411c |
Figure 4. Resistance to the indazole sulfonamides develops through an unusual gene amplification of a 40 gene region that includes IMPDH.

A. Density of reads across the genome as measured by Illumina-based sequencing. B. Quantitative PCR analysis of Rv3392 inside the amplified region as compared to mviN (control outside of amplified region) in the SR2.1 sulfonamide resistant mutant as compared to parental strain showing >10 amplification. C. Guanine, but not guanosine or inosine, rescue growth inhibition by C1.
Using the available X-ray crystal structure of NadD in complex with NADP (PDB ID: 4YBR), we analyzed the effects of the predicted NadD amino acid substitutions on the protein structure and function using a previously established pipeline 20. V14 is located at the dimer interface between the two NadD protomers, making local hydrophobic intra and inter molecular interactions. Mutation to isoleucine is not predicted by SDM 21 and DUET 22 to affect the stability of the protomer. There is sufficient space at the interface to accommodate the isoleucine and maintain the hydrophobic interactions, and accordingly this mutation is not predicted by mCSM-PPI 23 to destabilize the homodimer. V14 is located 8 Å away from the NAD ligand, and mutation to isoleucine is predicted by mCSM-lig 24 to mildly decrease binding affinity. G180A is a surface mutation of a negative phi glycine on an alpha helix of NadD, which SDM and DUET do not predict will destabilize the protomer, and mCSM-PPI predicts this change will have minimal effect on formation of the homodimer. The mutation is located 16.6 Å away from the NAD binding site, and is predicted by mCSM-lig to have minimal effect on the affinity for NAD. This suggested that these mutations were unlikely to play a direct role in the resistance observed to these compounds.
Quantitative PCR confirmed the 20-fold amplification of the Rv3371 to Rv3411 spanning region originally observed in the whole genome sequencing (Fig. 4B) and quantitative RT-PCR analysis confirmed that the SNP in the promoter of Rv3411c caused upregulation of guaB2 transcript expression (Fig. S1). Quantitative PCR of genomic DNA of the mutant compared to the parental strain showed that this gene was amplified 14-fold in the genome of the resistant mutant (results not shown). We reasoned that, if the mechanism of growth inhibition involved the essential Mtb inosine monophosphate dehydrogenase (IMPDH) encoded by guaB2 that catalyzes NAD+-dependent oxidation of IMP to xanthosine monophosphate (XMP) in the de novo biosynthetic pathway for guanosine nucleotides, growth inhibition would be overcome by guanine supplementation 25. Guanine rescue would only be possible in the presence of a functional purine salvage pathway in the cell conferred by the hypoxanthine-guanine phosphoribosyltransferase (HGPRT) encoded by the hpt gene that phosphoribosylates hypoxanthine or guanine to replenish purine nucleotide pools 26. Indeed, concentrations of guanine above 100 µM rescued cells from the effects of 1 and 2 (Fig. 4C, and Table S3) showing that the salvage pathway utilizing the activity of HGPRT could overcome metabolic blockage of IMPDH. In contrast, guanosine and the IMPDH substrate inosine could not rescue growth likely due to lack of uptake mechanisms of these nucleosides (Fig. 4C). As expected, no other nucleobases could rescue Mtb from indazole sulfonamide (results not shown).
Indazole sulfonamides are uncompetitive inhibitors of IMPDH
We next confirmed the ability of this compound to inhibit Mtb IMPDH in vitro. Recombinant Mtb IMPDH was expressed as a truncated isoform of the catalytically active core after deleting both cystathione β-synthase (CBS) domains 27; with no alteration on its steady state kinetic constants when compared to native Mtb IMPDH12. Compound 1 displayed an IC50 of 0.38 ± 0.02 µM (r2 0.99) in the enzyme assay (Fig. 5A). Moreover, comparison of in vitro enzyme inhibition values to potency of analogs (manuscript in preparation) against whole cells showed remarkable correlation (R2 of 0.8) (Fig. 5B).
Figure 5. Indazole sulfonamide inhibits Mtb IMPDH.

A. Kinetics of Mtb IMPDH inhibition. B. Correlation between Mtb IMPDH inhibition and potency against Mtb cells as measured by MIC. C. Identification of IMPDH as a target by chemoproteomics. C5 was covalently immobilized to NHS-activated sepharose beads at the primary amine. The beads were incubated with M. bovis BCG extract either in the presence of vehicle (DMSO), or in the presence of C6 (active) or the inactive analog C7. Relative quantification of all proteins captured on the beads was performed by isobaric peptide tagging and LC-MS/MS. A single protein, IMPDH (BCG_3481c, GuaB2), showed specific and selective binding as indicated by loss of binding in the presence of excess C6, but not C7. D. Affinity capturing on beads in the presence of different concentrations of “free” compounds allowed the determination of an IC50 value of 0.8 µM and an apparent dissociation constant (Kdapp) of C6 for IMPDH, whereas C7 shows only very weak binding. Data shown are the results of two replicate experiments.
To further confirm target engagement in the context of the cellular environment, a chemoproteomic approach was used to identify potential binding partners from the mycobacterial proteome 28. This strategy is based on the immobilization of chemical analogs of the active compound to beads, which are subsequently incubated with bacterial extract. Proteins captured by the beads were identified after tryptic digestion and liquid-chromatography-tandem mass spectrometry (LC-MS/MS). We prepared indazole sulfonamide analogues which derivatized the active pharmacophore with different types of linkers and a primary amino group, allowing covalent attachment to Sepharose beads. Compound 5 retained anti-bactericidal activity (Table 1) suggesting that the derivatization with the linker moiety did not interfere with target binding. The derivatized beads were incubated with Mycobacterium bovis BCG extract and proteins captured by the beads were digested with trypsin, labeled with isobaric mass tags (TMT 10plex), and quantitatively identified by LC-MS/MS. In order to distinguish true targets from nonspecific background binding, aliquots of the bacterial extracts were incubated prior to the pulldown step with either the antibacterial compound 6, or with the structurally related inactive compound 7 (Table 1). The active compound, but not the inactive analog, is expected to bind to the target protein(s) in the lysate and thus reduce the binding of these proteins to the beads. IMPDH (BCG_3481c, GuaB2) was the only protein in our experiments that exhibited this behavior suggesting that the active compound is a selective IMPDH inhibitor (Fig. 5c). The inactive compound 7 showed only partial competition of bead-binding with IMPDH even at the high concentration of 40 µM (Fig. 5d). GuaB1 and GuaB3 were captured by the beads to some degree, but this binding was not affected by excess compound 6, suggesting that they are not targets of compound 6. In order to estimate inhibitor potency, we performed the pulldown step in the presence of different concentrations of “free” compounds, which allowed the determination of an IC50 value of 0.8 µM for IMPDH. The IC50 value represents a measure of target affinity, but is affected by the affinity of the target for the bead-immobilized ligand. The latter effect can be deduced by measuring the depletion of the target protein by the beads 29. The apparent dissociation constant (Kdapp) of compound 6 for IMPDH was determined to be 0.7 µM. In order to exclude potential adverse effects mediated by modulation of host (human) targets, we employed the same strategy to evaluate binding to proteins in extracts from human material (K562 erythroleukemia cells, HEK embryonic kidney cells, and placenta tissue). Notably, the human orthologs IMPDH1 and IMPDH2 were captured by the indazole sulfonamide beads, but were not affected by preincubation with excess “free” compound 6, indicating a high degree of selectivity for the bacterial over the human enzyme.
The mode of enzyme inhibition is critical in evaluating the potential of a compound as a growth inhibitor in vivo since the extent of inhibition of the reaction can be determined by substrate and/or product concentrations depending on inhibitor kinetics. Kinetic evaluation of compound 1 showed the mode of inhibition was uncompetitive with IMP and NAD+ (Fig. 6) with a Ki of 0.220 µM. Uncompetitive inhibitors are appealing in that enzyme inhibition could lead to build-up of substrate further driving enzyme inhibition. In addition, the IC50 of compound 1 against the human IMPDH was found to be 15 µM (Fig. S2) showing a selectivity index of approximately 40 for the Mtb IMPDH.
Figure 6. The indazole sulfonamide is an uncompetitive inhibitor of Mtb IMPDH.

The mechanism of inhibition of compound 1. The Lineweaver-Burk plots (upper) were generated to display the type of inhibition, which is uncompetitive for both IMP and NAD+.
X-ray structure of indazole sulfonamide, compound 1 and IMPDH
The Mycobacterium thermoresistible (Mth) IMPDH protein which shares 85% amino acid identity with the Mtb IMPDH, including a 100% conservation of residues in the active site, was chosen for structural studies since it gave higher protein expression yields than the Mtb homolog. Mth IMPDH ΔCBS crystallized in the I4 space group and diffracted to sub 2 Å resolution. One protomer was present in the asymmetric unit, with the biological tetramer observable through operation of 222 symmetry of the crystal lattice (Fig. 7A). In the X-ray crystal structures of compound 1 with Mth IMPDH, clear electron density for the compound was observed within the NAD binding pocket of IMPDH in the 2F0-Fc difference map (σ = 3.0), stacking with IMP (Fig. 7B, C). It is worth noting that the majority of interactions mediated by compound 1 within the crystal structure are through extensive pi interactions between the indazole group and the hypoxanthine group of IMP (Fig. 7E; Fig. S3) consistent with the uncompetitive binding mode suggested by the enzyme kinetics. The indazole is able to make further pi interactions with A285 (A269 in the Mth structure), and polar interactions with G334 and T343 (G318 and T327 in the Mth structure respectively). The pyrazole makes further pi interactions to A269, in addition to some proximal hydrophobic interactions to E458 (E442 in the Mth structure). Additional polar interactions are mediated by the sulfonyl group to G425 (G409 in the Mth structure).
Figure 7. The X-ray crystal structure of Compound 1 and Compound 6 bound to IMPDH.

A. The IMPDH tetramer (cyan ribbon, with a representative protomer shown in grey) is shown bound to IMP (blue) and Compound 1 (C1) (orange) is shown. B. The structural alignment of the IMPDH crystal structures of C1 (orange) and Compound 6 (C6)(Magenta), showing the inhibitors are orientated identically in the NAD+ binding pocket. C, D. 2F0-Fc difference maps (σ = 3.0) showing clearly visible electron density for C1 (C) and C6 (D) in the NAD+ binding site. E. Interactions made by C1 (E) (orange) in the X-ray crystal structure of the complex of IMPDH (grey; and adjacent protomer in cyan) with IMP (blue). Residue numbering is of the corresponding residues in Mtb. Pi interactions are shown in green, hydrogen bonds in red, polar interactions in orange and proximal hydrophobic interactions in grey. The solid lines are covalent bonds, and the dashed lines are non-covalent interactions.
From crystals soaked with compound 6, the 2F0-Fc difference map (σ = 3.0) revealed strong density for the inhibitor (Fig. 7D). The structure of compound 6 showed the compound bound in a near identical manner to compound 1 (Fig. S3), with the indazole sulfonamide taking advantage of the same extensive interactions to IMP, in addition to a few interactions with neighboring residues in the binding pocket (A285, G334, T343, G425 and E458). The fluorophenyl acetamide extension of Compound 6 is able to make polar interactions with T284, A 285 and H286 (T268, A269 and H270 in the Mth structure, respectively), and the benzene group making proximal hydrophobic interactions to H286, N289 and V292 (H270, N273, and V276 in the Mth structure, respectively). Notably, however, the fluorine is in good orientation to make a 3.2 Å hydrogen bond with the side-chain of N289, helping to lock in the orientation of the compound.
Indazole sulfonamides are growth dependent inhibitors of Mtb
Having confirmed the on-target inhibition of IMPDH both in vitro and in the context of cellular metabolism, we explored the physiological consequences of IMPDH inhibition on Mtb survival. Exposure of Mtb to compound 1 and 2 showed that IMPDH inhibition resulted in slow bacterial death at high concentrations whereas MIC levels of compounds resulted only in bacterial growth inhibition (Fig. 8A). The kinetics of cidality recapitulated the late upregulation of the cell wall responsive iniBAC promoter and bacterial lysis observed during treatment of Mtb with these compounds (Fig. 2A). We confirmed that these compounds exerted a growth inhibitory effect in macrophages (Fig. 8B), although high concentrations were required to effect bacterial stasis. The vulnerability of IMPDH during non-replicative bacterial persistence in vitro was determined by treating starved or anaerobically adapted Mtb with compound 1 or 2 which showed that exposures as long as 3 weeks at 100-fold MIC levels of compound did not significantly affect bacterial survival (Fig. 8C, D), arguing against the vulnerability of this target during non-replicating persistence. These results suggest that IMPDH inhibitors were only effective against replicating Mtb cells.
Figure 8. The indazole sulfonamide is cidal for replicating cells but lacks activity in non-replicating cells and in murine infection.

A. Logarithmically growing Mtb was exposed for 7 days to compounds 1 (C1) and 2 (C2) at 1, 20 and 50X MIC values. Control cells were exposed to 10X MIC concentrations of Rifampicin (RIF). B. C1 lacks cidality against Mtb during growth in macrophages. Mtb-infected J774 macrophages were exposed to C1 at 10, 50 and 100X MIC concentrations for 7 days prior to CFU enumeration. RIF and DMSO were used as positive and negative controls, respectively. C. C1 is inactive against anaerobically persisting cells. Anaerobically adapted cells were exposed up to three weeks to C1 at 20 and 100X MIC values prior to CFU enumeration. Metronidazole at 100 µM was used as positive control. Isoniazid (100µM) and DMSO were used as negative controls. D. C 1 lacks efficacy against starved non-replicating Mtb. Two-week starved Mtb cultures were exposed up to 3 weeks to C1 and RIF at 10X MIC values prior to CFU enumeration. C 1 lacks efficacy in acute (e) and chronic (f) stages of murine infection as measured by CFU analysis of lung tissues. Mice were dosed at 10, 30 and 100mg/kg of C1 and C2 with vehicle and 10 mg/kg RIF treated mice serving as negative and positive controls, respectively.
To establish the vulnerability of IMPDH during host pathogenesis, we first sought to verify the efficacy of these compounds in an animal model that supports Mtb replication. Mtb replicates in lungs of both acute as well as chronically infected C57BL/6 mice, in chronic stages of infection replication being balanced by bacterial death30. Mtb infected C57BL/6 were treated with 10 to 100 mg/kg of 1 and 2 with dosing initiated 2 weeks post infection as well as in 7-week infected mice where a chronic infection had been established. Our results showed a surprising lack of efficacy in both stages of infection as observed by a lack of effect on bacterial organ burdens compared to treatment controls (Fig. 8 E, F).
Factors that contribute to lack of in vivo efficacy
The lack of in vivo efficacy of the indazole sulfonamide contrasted with its in vitro efficacy and led us to explore the factors that contributed to this. The finding that guanine could rescue the cidality in vitro (Fig. 4C, Table S3) could suggest that the pathogen employed scavenging mechanisms for host derived guanine similarly to the scavenging of host derived nicotinamide in NAD salvage observed during growth in macrophages31. Labeling of cells growing axenically in vitro or released after growth in macrophages31 with radiolabeled guanine indicated that guanine uptake mechanisms were downregulated during parasitism of the host (Fig. 9A) as compared to rapidly in vitro replicating cells, arguing against increased salvage of host purines contributing to the discrepancy between in vitro and in vivo efficacy.
Figure 9. Failure to achieve murine efficacy is likely due to sub-optimal exposure, P-GP mediated efflux and high lesion guanine levels.

A. Mtb does not upregulate guanine uptake during host pathogenesis. Mtb growing in macrophages was compared to logarithmically growing cells for their radiolabeling by 14C-guanine. B. Extended exposure of Mtb to compound 1 (C1) at 10- and 20X MIC concentrations is required to effect cidality. Logarithmically growing Mtb was exposed for 7 days to compounds for daily exposure periods of 3h, 6h or 24h followed by compound removal. C. Pharmacokinetics of C1 and C2. D. Measurement of permeability and efflux of C1 and C2 in a Madin Darby canine kidney cell permeability assay. E. Guanine concentrations in microscopically unaffected tissue and in lesions in resected lung tissue from two tuberculosis patients.
We next sought to understand whether inhibitor concentrations at the site of infection could have played a role in lack of in vivo efficacy. We analyzed the compound exposure required to effect bacterial killing in vitro and during infection of host macrophages by daily addition and removal of drug after either 3 or 6 hours of drug exposure compared to constant exposure (24 h). These studies suggested that continuous exposure at 10-fold MIC values was required to exert a cidal effect in vitro (Fig. 9B) and stasis in macrophages (Fig. S4). Analysis of the guanine concentration required to rescue growth inhibition demonstrated that concentrations of 10 µM guanine showed partial rescue of growth in indazole sulfonamide concentration dependent manner whereas 100 µM could fully overcome all growth inhibition (Fig. S5).
Pharmacokinetic analysis of blood concentrations of the two indazole sulfonamides (compounds 1 and 2) used for treatment of infected mice in Fig. 8 E & F showed that, although the highest dose achieved a maximal serum concentration more than 10-fold higher than MIC values and an Area-Under-the-Curve (AUC) value more than 30-fold higher than MIC values (Fig. 9C), the compound was well below the effective cidal concentration after 8 hours of dosing. The AUC following oral PK showed that for compound 1 there was proportional increase as the dose was escalated whilst for compound 2, there was a proportional increase between 5 and 30mg/kg but not between 30 and 100 mg/kg as the exposure was moderate when compared to each other (Table S11). Analysis of drug concentrations for compound 1 in bronchoalveolar lavage analyses similarly showed that despite drug reaching high concentrations in the epithelial lining fluid, concentrations at 4 hours after dosing were below the efficacious concentration and a reflection of the free drug concentration in blood (Tables S11 and S12). Moreover, analysis of permeability and efflux of this scaffold in a Madin Darby canine kidney cell permeability assay indicated that this scaffold was a likely P-glycoprotein (P-gp) substrate (Fig. 9D) which could additionally have contributed to low microenvironmental concentrations of these compounds in the mouse lung.
Our result suggested that efficacy in the mouse model could be improved by developing a compound with better serum exposure and lower P-gp efflux. However, the finding that guanine concentrations determine the efficacy of an IMPDH inhibitor in vitro led us to explore guanine concentrations in lung tissue. Mtb-infected rabbits develop granulomas with many of the defining characteristics of human granulomas 32. Dissecting caseous lesions from Mtb-infected rabbits allowed quantitation of free guanine levels in rabbit caseum directly and revealed guanine concentrations in the range of 0.2–0.5 mM in both uninvolved lung tissue and in lesions in rabbits that is greater than the 0.1 mM guanine required for rescue (Fig. S6). Similarly, curated samples of human tissue from patients with refractory multidrug-resistant tuberculosis who had undergone surgical resection for the treatment of their disease were analyzed for guanine content. Granuloma and cavity caseum had between 0.4 and 0.8 mM guanine and visually uninvolved lung tissue from the same two patients had 2 to 3 times more guanine than present in the lesion tissue (Fig. 9E). In contrast, J774 cells had guanine concentrations (43 µM) in the range of that reported for subpopulations of human cells33 whereas the guanine concentrations in mouse tissues ranged from 7 – 20 µM (Table S13, Fig. S7), concentrations that could partially rescue growth inhibition (Fig. S5).
DISCUSSION
The iniBAC promoter is a reporter of cell wall insult that rapidly responds to broad classes of cell wall inhibitors within 24 hr 15, 16. In the case of the indazole sulfonamides we initially classified them as not cell wall active based on the absence of this response but noted with interest that these compounds induced cell lysis and resulted in a delayed firing of the iniBAC promoter. We had seen a similar pattern of in vitro behavior previously with meropenem, a β-lactam of the carbapenem family. In this case this phenotype was accompanied by a unique polar swelling visualized by electron microscopy 17. The indazole sulfonamides showed a similar swelling at the cell poles but did not exhibit any direct effect on incorporation of 14C-N-acetylglucosamine, a precursor to peptidoglycan, suggesting that they did not exert a direct effect on peptidoglycan biosynthesis despite these similarities to β-lactams. The metabolic profiles resulting from treatment of Mtb cells with the indazole sulfonamides strongly suggested an effect on purine nucleotide pools suggesting that the cell wall effects were downstream consequences of purine nucleotide pool perturbations.
Mutants resistant to the indazole sulfonamides proved remarkably difficult to select and only occurred at very low frequency. Sequencing of these mutants at first revealed no helpful SNPs to suggest the actual target, instead we observed a 2–20 fold tandem duplication of a nearly 50 kb pair region of the chromosome spanning 40 genes from Rv3371 to Rv3411c. Remarkably, large scale repeats of genes in this region of the chromosome have been reported in the Pasteur strain of BCG, the Beijing strain of Mtb, and more recently in several other modern TB lineages 34–36. The only resistant mutant we obtained that did not show this gene amplification harbored a SNP just upstream of the last gene in the amplified region, guaB2. The finding that guanine supplementation rescued Mtb from growth inhibition by this scaffold confirmed the notion that the mechanism of action was related to inhibition of IMPDH.
The connection between IMPDH inhibition and the observed effects on cell envelope integrity was unexpected but three facts are worth considering. The observed cell lysis occurs very slowly and only after about five days, with the iniBAC promoter assay becoming positive slightly earlier at about 3 days. The central role of guanine nucleotides in protein synthesis and biosynthesis of the essential flavin cofactor required for a plethora of reactions including UDP-galactopyranose mutase, could additionally explain the downstream effects on cell wall integrity.
The very low observed frequency of resistance suggested the possibility that there were multiple cellular targets for the indazole sulfonamides. Two experiments suggest that this is not the case. First, across a structurally diverse set of analogs of this series with MICs ranging from 100 nM to 100 µM the IC50 values against IMPDH showed a strong correlation. Second, attachment of an indazole sulfonamide analog to beads specifically pulled IMPDH out of whole cell lysates and this could be competed with an active analog but not with a closely related inactive analog (Fig 5C). A more likely explanation for the low frequency of resistance appeared when we solved the X-Ray crystal structure of our lead compound in complex with the IMPDH from M. thermoresistible. Full-length Mth IMPDH (GuaB2) has 85% sequence identity with Mtb IMPDH and is 100% conserved in the active site, and was chosen for further crystallographic studies due to its higher expression levels and ready crystallization in a soakable crystal form. This structure showed that the inhibitor bound primarily to the substrate IMP at the active site and made relatively few contacts with the protein. The relative lack of direct interaction with the protein itself suggests that mutation of the target is unlikely to give resistance, leaving gene amplification as the only viable route for acquisition of resistance. This gene amplification may occur at an even lower rate in vivo since amplification of this region in vitro leads to mutants with impaired virulence37. The two non-active site mutations observed in nadD, encoding the nicotinate mononucleotide adenylyltransferase involved in NAD biosynthesis, in our resistant mutants are intriguing. We have confirmed that our compound even at 100 µM does not inhibit MtNadD further corroborating the notion that these non-active site mutations are not related to the mechanism of action of the compound.
Consistent with their induction of cell lysis, the indazole sulfonamides were cidal to actively replicating cells over a one week incubation. And consistent with the anabolic role of the products of this enzyme, this series showed no significant cidal activity against cells in which replication had been arrested either by hypoxia. We therefore expected to see an effect of these compounds in acute murine models of disease and for that activity to be significantly curtailed in chronic disease models where replication is slow. Surprisingly we saw no activity of these agents in either model despite what appeared to be suitable exposures. We considered several explanations for the lack of in vivo activity including that the bacteria might have upregulated their ability to scavenge guanine derived from the host and therefore be less susceptible to IMPDH inhibitors. Uptake of [14C]-guanine, however, was not upregulated in Mtb cells released from macrophages compared to those in in vitro culture. Cidal activity was very concentration dependent and at the actual MIC, the compounds were sufficient to block replication but killing was only apparent above 10X MIC concentrations. To mimic the exposures seen in vivo, we next assessed what duration of exposure was required to achieve cidal activity and did daily pulses of exposure for 3, 6 or 24 hours at 20X MIC and found that even 6h at 20X MIC was insufficient to kill cells. We also found that these compounds were subject to active efflux by P-gp so the actual exposure of bacteria within macrophages was likely considerably lower than what was measured in the serum PK study.
Another potential explanation for the lack of in vivo efficacy was that host guanine levels were sufficient to rescue the IMPDH inhibitory effect. To assess this we measured free guanine levels in mouse, rabbit and human TB lesions and found surprisingly high concentrations of guanine in normal lung tissue as well as in the caseum of granulomas of rabbits and humans whereas normal lung tissue of uninfected mice was 10–13 µM. High intracellular concentrations of guanine have previously been reported in both E. coli38, 39 (~180 µM) and in normal human cells33 (70–800 µM). Intracellular guanine concentrations in J774 macrophages used in our work were measured to be 43 µM, levels not high enough to fully rescue growth inhibition by the indazole sulfonamide although high enough to partially alleviate cidality. Although the mouse lung concentrations do not explain the lack of efficacy in this animal model, these levels are a concern for IMPDH as a drug target in humans where salvage of extracellular guanine could provide a bypass mechanism for decreased flux through the de novo pathway (Fig. 1). The most recalcitrant bacteria are thought to be the non-replicating bacilli found within the necrotic core of lesions where guanine was the lowest but where the metabolic requirement for guanosine nucleotides is minimal as evidenced by the growth rate dependence of IMPDH inhibition. In combination, these data suggest that IMPDH, although essential for Mtb survival in vitro in laboratory growth media, is relatively invulnerable and has low potential for achieving treatment-shortening in humans infected with Mtb.
MATERIALS AND METHODS
Animal care and human ethics assurance
Mouse and rabbit studies were carried out in accordance with the Guide for the Care and Use of Laboratory Animals of the National Institutes of Health under Animal study protocol numbers LCID 4E and LCID3, additional rabbit studies were done with approval from the Institutional Animal Care and Use Committee of the New Jersey Medical School, Newark, NJ under Rutgers Animal Welfare Assurance Number A3158-01. For human samples, anonymized lung tissue containing granulomas were collected from patients with treatment refractory TB during therapeutic lung resection surgery at National Masan Hospital, Republic of South Korea. The collection was approved by the hospital’s institutional review board, an exemption from National Institutes of Health, Office for Human Research Protections, and with written, informed consent of the subjects. All regulated procedures on living animals performed at the University of Dundee were carried out under the authority of a license issued by the Home Office under the Animals (Scientific Procedures) Act 1986, as amended in 2012 (and in compliance with EU Directive EU/2010/63). License applications will have been approved by the University's Ethical Review Committee (ERC) before submission to the Home Office. The ERC has a general remit to develop and oversee policy on all aspects of the use of animals on University premises and is a sub-committee of the University Court, its highest governing body.
Strains and media
Mycobacterium tuberculosis H37Rv was used for all experiments except pini-luc and GFP release assay. The piniBAC- luciferase expressing strain and a GFP-expressing Mtb/pMSP12 strain were used for pini-luc and GFP release assay, respectively 17. Middlebrook 7H9 (Becton Dickinson) supplemented with ADC [albumin (50 g l−1)/dextrose (20 g l−1)/NaCl (8.1 g l−1)], 0.2% glycerol] and 0.05% Tween 80 was used for liquid media and Middlebrook 7H11 (Becton Dickinson) supplemented with OADC [ADC with 0.06% oleic acid] was used for solid media for in vitro growth of Mtb. MIC determinations were performed as previously described 40.
Evaluation of Indazole Sulfonamide effects on Mtb cell wall synthesis
The pini-luc strain was grown at 1× MIC of each compound at 37°C for 7 days in 96 well plates. Every 24 h, 50 µl of culture was taken and mixed with 50 ul luciferase assay buffer [50 mM HEPES pH 8.0, 0.4% Triton X100, D-luciferin (28 mg l-1), 50 mM DTT]. The mixture was incubated at 37°C for 30 min and RLU was measured by FlUOstar Optima (BMG LABTECH). For the GFP release assay, Mtb/pMSP12 strain was incubated in 7H9/ADC/Tween with 30 µg/ml of kanamycin in roller bottles at 37°C to exponential phase (OD 0.2) 17. The culture was split to 30 ml in 250 ml roller bottles with test compounds added at 1X and 10X MIC and cultured for 14 days. Each day 1 ml of each culture was centrifuged at 15,000 g for 5 min. Supernatant was dispensed in 100 µl aliquots (triplicates) in consecutive wells of 96-well black plate. GFP fluorescence was measured by FLUOstar optima (λex485 nm and λem 520 nm) and divided by OD650 of the culture. For macromolecular incorporation, Mtb was grown to an OD650nm of 0.4 in 200ml and split into 11 ml aliquots containing test compounds. After 2 hours at 37°C, 220 µl of 0.1 mCi/ml 14C-N-acetyl-D-glucosamine (NAG, American Radiolabeled Chemicals, Inc.) was added to each aliquot. After 24 and 48 hours, 2.5 ml of NAG labelled samples were centrifuged at 3,000 g for 10 min. The pellet was resuspended in 2 ml CHCl3:CH3OH (2:1) and incubated at 37°C overnight. Harvested pellets were resuspended well in 200 µl of scintillation fluid and CPM was counted by Scintillation counter (Beckman Coulter LS6500).
Metabolomic Sample Preparation and Analysis
Samples used for metabolomic analysis of indazole sulfonamide compounds on viable Mtb cells were prepared using our previously published filter cultured system41. In short, Mtb was grown to mid-log phase and then diluted to an OD600nm of 0.1. A 1 ml culture was then inoculated onto 22 mm 0.2 µm PVDF filters (Millipore) using vacuum filtration, placed on 7H10+ADN plates, and incubated at 37°C. On day 5 post-inoculation, Mtb-laden filters were transferred to plates containing DMSO vehicle, 0.5X, 1X, 5X or 10X MIC C1 (or equivalent molar concentrations of its inactive congener) and incubated for 20h, at which point there was no grossly measurable loss of viability, as previously described42. Samples were then metabolically quenched by plunging Mtb-laden or mock drug-exposed filters in −20°C acetonitrile:methanol:H2O (40:40:20). Metabolically quenched Mtb removed from these filters in solution were mechanically lysed with 0.1 mm silica beads in a Precellys tissue homogenizer under continuous cooling at 2°C. Samples were then clarified by centrifugation and the supernatant filtered through a 0.22 µm filter. Biomass of each sample was determined by measuring residual protein content using a colorimetric assay (Pierce BCA Protein Assay) and used to enable inter-sample normalization of measured metabolite abundances. Each experiment included three technical replicates for every condition tested and was performed twice.
Samples used for metabolomic analysis of lung tissue and macrophages were prepared by mechanical lysis in −20°C acetonitrile:methanol:H2O (40:40:20) using a Precellys tissue homogenizer under continuous cooling at 2°C and processed as described above. Biomass of each sample was determined by weight and used to determine lesional concentrations of guanine as described below.
Liquid Chromatography-Mass Spectrometry
Metabolites were separated using a Cogent Diamond Hydride Type C column (Gradient 3) as previously described43 and then analyzed using an Agilent 1200 liquid chromatography system coupled to an Agilent High Resolution Accurate Mass 6220 TOF. This system achieves mass errors of approximately 5 ppm, mass resolution ranging from 10,000 to 25,000 (over m/z 121–955), and a 5 log10 dynamic range.
Metabolomic datasets were queried by targeted analysis using Agilent Profinder 8.0 configured to a mass tolerance of <10 ppm. Putative metabolite identities were assigned based on accurate mass (m/z) and chromatographic retention time identifiers and confirmed by co-elution with authentic chemical standards. Metabolite concentrations were calculated using the method of standard addition with authentic chemical standards. Metabolite abundances were normalized within experiments to residual protein biomass as described above. Absent a validated internal standard to determine absolute recovery rates, the reported metabolite abundances and concentrations likely represent underestimations. Lung tissue and macrophage guanine concentrations were determined by dividing the normalized metabolite abundances by the volume of lung tissue (assuming a lung tissue density of approximately 1 g/ml) or total cell volume of macrophages (assuming an approximate cell volume of 2.1 ul/106 cells44).
Metabolic pathway enrichment analysis was carried out using the online analytical tool MetaboAnalyst 3.0 (www.metaboanalyst.ca)19. Enriched pathways were identified by hypergeometeric test based on a cumulative binomial distribution.
FDR (false discovery rate)-controlling procedures are designed to control the rate of Type I, or false positive, errors in large datasets. FDR methods have greater power (sensitivity) than so-called familywise error rate (FWER) controlling methods such as Bonferroni-based corrections but provide less stringent control of Type I errors45. Holm–Bonferroni method46 is a FWER controlling method used to handle the problem of multiple comparisons that is more powerful than the standard Bonferroni correction.
Generation and characterization of indazole Sulfonamide resistant mutants
To generate mutants against the indazole sulfonamide scaffold, 50 ml of Mtb was grown to OD650 0.2. Harvested cells were resuspended in 500 µl of media and 100 µl of it (109 cells) were plated on 7H11/OACD plates with 5×, 10×, 50× MIC 1 and 2. They were incubated at 37C for 4 weeks. After 4 weeks, the 2 mutants on 10× MIC compound 2 plates were inoculated in 7H9/ADC/Tween media. Genomic DNA of mutants was isolated by CTAB method 15. Whole genome sequencing was performed and analyzed as described 47. To confirm the large duplication of SR2.1, qPCR were performed with primer sets within the duplication region (Rv3392) and out of the region (Rv3910). These DNA fragments were amplified by 25 cycles of PCR with 0.1, 0.2, 0.4, and 1 ng of genomic DNA of SR2.1 and parental strain. The amount of amplified PCR product was compared on agarose gels. Quantitative PCR was further used to confirm amplification of guaB2 in the genome. For this, quantitative PCR was performed by real-time PCR with SYBR green. One nanogram of genomic DNA from parental strain and SR2.1 were used for each reaction. Data was normalized with 16S rRNA gene. Relative gene quantification was calculated in REST-382©-version148. The intergenic sequence of wild type and mutated guaB2 were used to replace the hsp promoter of pMV306hsp (Addgene plasmid # 26155), respectively49. The original plasmid contains luciferase driven by the hsp promoter. They were electroporated into M. smegmatis mc2155. Luciferase activity was measured as describe above in pini-luc assay. Guanine rescue test was performed by addition of the supplements to the medium used in the MIC determination using a final concentration of 100 µM guanine, guanosine, inosine, xanthine and hypoxanthine.
Efficacy and validating inhibition of Indazole sulfonamide scaffold against Mtb in vitro and in vivo
In vitro efficacy was performed in aerobic, anaerobic, and starvation condition. For aerobic conditions logarithmically growing Mtb (OD650 0.2) was diluted 1,000 fold in 1 ml of 7H9 media and exposed to 1×, 20×, and 50 × MIC of compound 1 and compound 2 for up to 7days in duplicates. After 4 days and 7 days of treatment appropriate cell dilutions were plated on 7H11/OADC plates for CFU enumeration. For anaerobic conditions, Mtb was cultured in the self-generated oxygen-depletion model as previously described 31. One milliliter of anaerobic Mtb culture was exposed up to 3 weeks to 20X and 100X MIC compound 1 and compound 2. For the starvation condition, logarithmically growing 5 ml of Mtb (OD650 0.2) culture was washed with PBST (phosphate buffered saline with 0.05% tyloxapol) 3 times and incubated in PBST for 2 weeks. Two weeks starved Mtb culture was aliquot to 1 ml and exposed up to 3 weeks to compound 1 and 2. Dilutions were plated on 7H11/OADC plates on a weekly basis.
For the ex vivo efficacy test, J774 cells (5× 10⁴ cells/well) were seeded in flat-bottom 96 well plates (Corning incorporated) in DMEM GlutaMAX (Gibco) supplemented with 10% fetal bovine serum, 20 mM HEPES + 0.5 mM sodium pyruvate and infected with Mtb (MOI 1:1) for 24 hours. Subsequently, cells were washed with PBS (pH 7.4) twice and exposed to test compounds in the above growth medium. Cells were incubated at 37°C, 95% humidity, 5% CO2 incubator for 7 days. Media was changed after 4 days. After 7 days incubation 0.1% SDS was added in each well to ensure macrophage lysis. After 5 minutes, lysate was rapidly mixed to shear eukaryotic DNA and diluted in 7H9/ADC and plated on 7H11/OADC plates.
For evaluation of in vivo efficacy, C57BL/6 mice were infected by the aerosol route as previously described 50. After 14 days, groups of 10 mice were dosed with 1 and 2 given by oral gavage at 10 mg/kg, 30 mg/kg, or 100 mg/kg. Control groups were dosed with vehicle control (1% carboxymethyl cellulose) or 10mg/kg Rifampicin. After 2 and 4 weeks of treatment, groups of 5 mice were euthanized and appropriate dilutions in 7H9/ADC/Tween of organ homogenates plated on 7H11/OADC plates for CFU enumeration. Similarly, mice were treated by daily oral gavage with the above drugs for 2 and 4 weeks at 70 days post-infection to determine drug efficacy in chronic established infections.
To determine the length of daily exposure required to effect cidality, 3 ml of Mtb cell culture at OD650 of 0.2 was diluted 100-fold and exposed to test compounds as described above. Cells were exposed to compound for 3 or 6 hours on a daily basis after which test compounds were removed by centrifugation (4,000 g, 10 min) and washing with PBS 3 times. Washed Mtb cells were resuspended in 7H9/ADC/Tween without compounds and incubated at 37°C for 21 hours and 18 hours, respectively. Control cells were continually exposed to test compound without daily washing. This process was repeated on a daily basis for 7 days after which appropriate dilutions were plated on 7H11/OADC plates. Similarly, to determine the daily exposure required to achieve bacteriostasis during macrophage infection, J774 cells (1× 10⁵ cells/well) were seeded in 24 well plate and infected with Mtb at an MOI 1 and exposed to test compounds as described above. Infected cells were continually exposed to compound or for daily exposure periods of 3 or 6 hours followed by washing of monolayers 3 times with PBS and DMEM/FBS medium replacement for a total of 7 days. Cell lysis and plating was as described above.
To compare the level of guanine uptake of in vitro cultures of Mtb to Mtb growing inside host macrophages, 14C-guanine was fed to 108 Mtb cells derived from early log-phase (OD650 0.2) 7H9/ADC/Tween culture or from a similar number of Mtb cells derived from 5-day infected J774 cells lysed with deionized sterile water. After 3 days at 37°C, cells were harvested by centrifugation, washed 3 times, a small aliquot used for CFU enumeration by plating on 7H11/OADC agar plate and the remaining cells resuspended in scintillation liquid to determine guanine incorporation by scintillation counting.
Mtb IMPDH activity and inhibition assays
Enzyme activity and inhibition assays were performed with recombinant truncated Mtb IMPDH where amino acids 126 to 251, corresponding to two CBS domains on the native enzyme were substituted by two glycine residues. Truncated Mtb IMPDH activity was monitored by the increase in absorbance at 340nm, due to product NADH formation (ε340nmNADH: 6220 M−1cm−1) at 25°C in activity buffer (Tris HCl 50mM, KCl 150mM, TECEP 1.5mM, pH 8.0). The KM values of substrates IMP (70 ± 2 µM) and NAD (937 ± 62 µM), forward reaction kcat (0.67 ± 0.01 s−1) and NAD+ substrate inhibition (10 ± 0.8 mM) of truncated Mtb IMPDH showed no difference when compared to native IMPDH12. Inhibition assays were performed on activity buffer in presence of Mtb IMPDH 1 µM, IMP 0.5 mM, NAD+ 1 mM, in final 50 µL volume. Compound 1, in 100% DMSO solution, was varied from 3 nM to 800 µM. All data points, including controls, contained equal final volume of DMSO (2 µL). All reactions were performed in triplicates. The fractional activity as a function of the inhibitor concentration was fitted to the equation: v1/v0 = 1/1 + ([I]/IC50) for IC50 value determination using SigmaPlot v.12.
Ki constants were determined by some modifications to the above protocol. Specifically, the enzymatic activity was measured by a continuous spectrophotometric assay 10 in a 200 µl reaction mixture that contained 50mM Tris HCl buffer, pH 8.0, 150mM KCl, 1mM DTT, 1mM EDTA, 3mM NAD+ and 1.25mM IMP (all chemicals were purchased from Sigma-Aldrich). After 1 minute of pre-incubation, the reaction was started by adding 0.5 micrograms of either the Mtb or human enzyme and the increase in the absorbance at 340 nm, caused by the reduction of NAD+ to NADH (ε340 = 6220 M−1 cm−1), measured. The assay was performed in quartz cuvettes with a Varian Cary 50-BiO UV-visible spectrophotometer equipped with a temperature controlled cuvette holder. The mechanism of inhibition and the Ki of compound 1 against Mtb GuaB2, was determined by analysis of the initial velocity data plotted against the substrate concentration (Fig. 3 panel d). The data were fitted to equation describing the uncompetitive inhibition model using Sigma Plot-Enzyme Kinetics Module 1.3. The concentrations of compound 1 were varied from 0 to 1 µM. Data points were obtained from two independent experiments. In the case of human IMPDH, the concentration of compound 1 required to reduce the fractional enzyme activity to half of its initial value (IC50) was calculated plotting the enzyme fractional activity against the logarithm of inhibitor concentration (Fig. S2), and fitting the curves to a dose response curve (Equation 2):
| (Eq.2) |
in which y is the fractional activity of the enzyme in the presence of inhibitor at concentration [I], max is the maximum value of y observed at [I]=0, and min is the minimum limiting value of y at high inhibitor concentrations.
Chemistry
Compound syntheses and analytical data are described in the supplemental information.
Cloning, expression and protein purification
The M. thermoresistible GuaB2 gene was amplified from genomic DNA and cloned into the pHat2 vector without the 2 CBS domains and a Glycine-Glycine linker connecting the two parts of the catalytic region (Mth IMPDH ΔCBS). The Mth IMPDH ΔCBS protein was expressed in BL21 DE3 (NEB) cells at 37°C until the OD600 measured 0.6, then the temperature was reduced to 18°C and IPTG was added at a final concentration of 500 µM. Cells were left growing overnight. Cells were harvested by centrifugation, resuspended in 50 mM Hepes pH 8.0, 500 mM NaCl, 5% glycerol, 10 mM beta-mercaptoethanol, 20 mM imidazole. Lysis was performed using an Emulsiflex cell disruptor (Avastin). Clarification of the lysate was achieved by high-speed centrifugation and filtration through a 0.45 µm filter. The clarified supernatant was then applied to a Hi-Trap IMAC FF column (GE Healthcare) charged with Nickel. The bound protein was eluted with lysis buffer + 250 mM imidazole. Overnight dialysis into lysis buffer – imidazole was performed, including incubation with TEV protease to remove the N-terminal His-Tag. Then, in order to remove both uncleaved protein and protease, the sample was passed through a gravity flow Nickel column. The flow-through from this step was concentrated and injected onto a Superdex 200 gel filtration column pre-equilibrated with 20 mM Hepes pH 8.0, 500 mM NaCl, 5% glycerol, 1 mM TCEP. Elution fractions were collected and concentrated to 12.5 mg/mL for crystallization.
Chemoproteomics
The chemoproteomic affinity capturing experiments were performed as previously described 28, 29. Briefly, sepharose beads were derivatized with 5 at 1mM concentration, and beads were washed and equilibrated in lysis buffer (50 mM Tris-HCl, pH 7.4, 0.4 % Igepal-CA630, 1.5 mM MgCl2, 5 % Glycerol, 150 mM NaCl, 25 mM NaF, 1 mM Na3VO4, 1 mM DTT, and one Complete EDTA-free protease inhibitor tablet (Roche) per 25 mL). They were incubated at 4°C for 1 h either with 0.1 mL (0.3 mg) M. bovis BCG extract or with 1 mL (5 mg) mixed HEK293/K-562/Placenta extract, which was pre-incubated with compound or DMSO (vehicle control). Beads were transferred either to Filter plates (Durapore (PVDF membrane, Merck Millipore) or to disposable columns (MoBiTec), washed extensively with lysis buffer and eluted with SDS sample buffer. Proteins were alkylated, separated on 4–12 % Bis-Tris NuPAGE (Life technologies) and stained with colloidal Coomassie. Gel lanes were cut into three slices and subjected to in-gel digest using LysC for 2 h and trypsin overnight28. Digestion, labeling with TMT isobaric mass tags, peptide fractionation, and mass spectrometric analyses were performed51. Proteins were quantified by isobaric mass tagging and LC-MS/MS. The proteins.fasta file for M. bovis BCG was downloaded (May 11th 2011) from http://genome.tbdb.org/annotation/genome/tbdb/MultiDownloads.html and supplemented with the sequences of bovine serum albumin, porcine trypsin and mouse, rat, sheep and dog keratins. Decoy versions of all proteins were created and added. The search database contained a total of 11,492 protein sequences, 50 % forward, 50 % reverse. Protein identification and quantification was performed52. Proteins identified with >1 unique peptide matches were considered for further data analysis. Apparent dissociation constants were determined by taking into account the protein depletion by the beads 29. Raw data tables for the chemoproteomics experiments can be found in the Supplementary Table 4 to 9.
Crystallization, compound soaking and X-ray data collection
The Mth IMPDH ΔCBS protein crystallized in 2 µl hanging drops in 1:1 ratio with 100mM sodium acetate pH 5.5, 200mM calcium chloride, 8–14% iso-propanol. Crystals appeared after 24 hours and grew to full size within a week. Crystals were soaked overnight in drops of well solution + 5mM IMP and 5mM Compound 1 dissolved in water or for 3 days in 1mM Compound 6 solubilized in 100% DMSO. Cryoprotected crystals were passed through drops containing well solution + 25% glycerol, and were subsequently flash-frozen in liquid nitrogen. Data were collected from the crystals at Diamond Light Source beamline I03 (Compound 1) and I04 (Compound 6).
Structure solution, ligand fitting and refinement
Data were processed using XDS 53 and Pointless (ccp4). To solve the structure molecular replacement was performed with Phenix Phaser 54 using a previously solved IMP-bound Mth IMPDH ΔCBS structure as a probe, with the NAD site empty (unpublished data). Refinement was performed using Phenix.refine and manually in Coot 55. IMP and compound 1 were sequentially fitted into the density using the LigandFit function of Phenix and the structures were manually refined further using Coot. Final R/Rfree scores obtained were 0.21/0.20 for Compound 1 and 0.20/0.19 for Compound 6 respectively.
Information regarding the crystallographic statistics can be found in Table S10. All figures were made using Pymol (Schrodinger) and Coot. Protein-ligand interactions were analyzed using Arpeggio (H. Jubb – unpublished software).
Structures have been deposited in the protein data bank (PDB) as 5K4X for IMPDH:IMP:Compound 1 and 5K4Z for IMPDH:IMP:Compound 6 complex structures.
Mouse pharmacokinetics and bronchoalveolar lavage (BAL) studies
Test compound was dosed to female C57BL/6 mice (n=3) orally by gavage as a fine suspension at 5, 30 and 100mg/kg free base (dose volume: 10mL/kg; Dose vehicle: 1% carboxy-methyl cellulose (CMC). Female C57BL/6 mice were chosen as these represent the sex and strain used for the in vivo tuberculosis efficacy models. Blood samples were taken from the tail vein of each mouse at pre-determined time intervals post-dose, mixed with two volumes of distilled water and stored frozen until analysed using UPLC/MS-MS. Pharmacokinetic parameters were derived from the blood concentration time curve using PK Solutions software v 2.0 (Summit Research Services, USA).
For the bronchoalveolar lavage studies, mice were dosed at 100mg/kg freebase as above. The BAL fluid were extracted following tracheostomy where a small medial incision was made, and an Insyte IV catheter (20G – Becton Dickinson, UK) was inserted up to 1.5 cm inside the trachea and tied with a suture to avoid leakage during BAL sampling. Both lungs were flushed with a total 1.0 mL (0.5 mL X 2) of ice cold phosphate buffered saline (PBS) and aspirated immediately after administration. Aspirated volumes were recorded exactly and the samples were stored on ice until centrifugation. Blood samples were centrifuged at 3000 rpm for 5 min whilst BAL samples were centrifuged at 1500 rpm for 5 min as well. Plasma and clean BAL were transferred into Eppendorf tubes, which were stored frozen in the up-right position prior to analysis as detailed above. The epithelial lung fluid (ELF) drug concentration was determined as shown below: ELF drug concentration= BAL fluid drug concentration * (plasma urea concentration/BAL fluid urea concentration) after the method of Laohavaleeson et al 56.
Mouse, rabbit and human granuloma sample analysis
For rabbit studies, specific pathogen-free, individually housed female NZW rabbits, weighing 2.2 to 2.6 kg, were used for aerosol infection by M. tuberculosis HN878, as previously described 57, since it generates a representative range of human-like lesions in infected rabbits. Briefly, rabbits were exposed to M. tuberculosis-containing aerosol using a nose-only delivery system. Three hours post-infection, rabbits were euthanized, and serial dilutions of the lung homogenates were cultured on Middlebrook 7H11 agar plates to enumerate the number of bacterial colony forming units (CFUs) implanted in the lungs. The infection was allowed to progress for 16 to 20 weeks, at which point the animal were euthanized to dissect uninvolved lung pieces and lesions as previously described58. Dissected lung tissue and lesions were weighed, categorized as uninvolved lung, cellular granuloma, caseous/necrotic granuloma, or cavity caseum. Each sample was homogenized in approximately 5 volumes of phosphate buffer saline (PBS), and stored at −80°C until analysed.
Human samples were derived from lobectomies at National Masan Hospital. Immediately following surgery, the lung tissue was sterilely dissected into individual lesions and uninvolved lung tissue. Larger lesions (50–150mg, individually weighed) were separated into caseum and lesion wall when possible. All samples for metabolite analysis were snap frozen in liquid nitrogen.
Mouse organ samples were obtained from three uninfected C57BL/6 mice and flash frozen on dry ice. J774 cell samples were obtained by washing monolayers of cells with PBS, scraping of cells, harvesting, removal of PBS supernatant and flash freezing the cell pellet on dry ice.
Supplementary Material
Acknowledgments
This work was funded, in part, by the Intramural Research Program of NIAID and in part by grants from the Foundation for the National Institutes of Health with support from the Bill & Melinda Gates Foundation (to C.E.B. III, V.M and P.W), and the South African Medical Research Council (to V.M.). D.B.A was supported by an NHMRC CJ Martin Fellowship (APP1072476). D.B.A. and T.L.B received funding from the Newton Fund RCUK-CONFAP Grant awarded by The Medical Research Council (MRC) and Fundação de Amparo à Pesquisa do Estado de Minas Gerais (FAPEMIG) (MR/M026302/1). P.W received joint funding from the Bill and Melinda Gates Foundation and Wellcome Trust for A Centre of Excellence for Lead Optimisation for Diseases of the Developing World. We acknowledge Beth Fischer and Vinod Nair for help with electron microscopy.
ABBREVIATIONS
- IMPDH
Inosine monophosphate dehydrogenase
- Mtb
Mycobacterium tuberculosis
- HGPRT
hypoxanthine-guanine phosphoribosyltransferase
- IMP
Inosine monophosphate
- XMP
xanthosine monophosphate
- MIC
minimum inhibitory concentration
Footnotes
Supplementary files describe compound syntheses and characterization, graphs showing determination of transcriptional activity of the guaB2 promoter, the data used to calculate IC50 value for C1, X-ray structure of IMPDH with C6, efficacy of indazole sulfonamides during infection of host cells, the concentration dependence of guanine rescue during IMPDH inhibition and guanine levels on rabbit lung, mouse tissues and J774 cells as well as data tables describing metabolomic data from treatment of Mtb with indazole sulfonamide scaffolds, data describing correlation between IC50 and whole cell activity, data from chemoproteomic profiling, data from crystallographic analyses, PK data and guanine concentrations in mouse organs and J774 cells. This information is available free of charge via the Internet at http://pubs.acs.org/.
AUTHOR CONTRIBUTIONS
YP, KA and HB performed drug susceptibility determinations, electron microscopy analyses, macromolecular incorporation, pini-luc and GFP release assays. ZW, TH and KR performed metabolomics and lung guanine analyses. VD and LV generated and/or provided lung tissue samples. YP generated and characterized the mutants, performed macrophage and mouse efficacy and time kill kinetics. JS, AB and NZ performed enzyme IC50 determinations. MR and SD did enzyme kinetic evaluation. TI performed and analyzed the whole genome sequencing. TB, AP and DA performed and analyzed all protein structural work. OE, LS, FS, MOC, LE and KR performed ADME assays. HP, MB, and SG-D performed biochemical and mass spectrometry experiments, SG-D and GD designed experiments, analysed data, and contributed to the manuscript. Synthetic and computational chemistry was done by SJ, CM, LC, TB, AS, SD, DM, KB, PT, MH, FZ, PR, PW. SG analyzed data. HB, YP and CEB analyzed the data and wrote the manuscript.
References
- 1.Zumla A, George A, Sharma V, Herbert RH, Baroness Masham of, I. Oxley A, Oliver M. The WHO 2014 global tuberculosis report--further to go. Lancet Glob Health. 2015;3:e10–12. doi: 10.1016/S2214-109X(14)70361-4. [DOI] [PubMed] [Google Scholar]
- 2.Dheda K, Barry CE, 3rd, Maartens G. Tuberculosis. Lancet. 2016;387:1211–1226. doi: 10.1016/S0140-6736(15)00151-8. [DOI] [PMC free article] [PubMed] [Google Scholar]
- 3.Horsburgh CR, Jr, Barry CE, 3rd, Lange C. Treatment of Tuberculosis. N Engl J Med. 2015;373:2149–2160. doi: 10.1056/NEJMra1413919. [DOI] [PubMed] [Google Scholar]
- 4.Payne DJ, Gwynn MN, Holmes DJ, Pompliano DL. Drugs for bad bugs: confronting the challenges of antibacterial discovery. Nat Rev Drug Discov. 2007;6:29–40. doi: 10.1038/nrd2201. [DOI] [PubMed] [Google Scholar]
- 5.Ioerger TR, O'Malley T, Liao R, Guinn KM, Hickey MJ, Mohaideen N, Murphy KC, Boshoff HI, Mizrahi V, Rubin EJ, Sassetti CM, Barry CE, 3rd, Sherman DR, Parish T, Sacchettini JC. Identification of new drug targets and resistance mechanisms in Mycobacterium tuberculosis. PLoS One. 2013;8:e75245. doi: 10.1371/journal.pone.0075245. [DOI] [PMC free article] [PubMed] [Google Scholar]
- 6.Warner DF, Evans JC, Mizrahi V. Nucleotide Metabolism and DNA Replication. Microbiol Spectr. 2014:2. doi: 10.1128/microbiolspec.MGM2-0001-2013. [DOI] [PubMed] [Google Scholar]
- 7.Ducati RG, Breda A, Basso LA, Santos DS. Purine Salvage Pathway in Mycobacterium tuberculosis. Curr Med Chem. 2011;18:1258–1275. doi: 10.2174/092986711795029627. [DOI] [PubMed] [Google Scholar]
- 8.Long MC, Escuyer V, Parker WB. Identification and characterization of a unique adenosine kinase from Mycobacterium tuberculosis. J Bacteriol. 2003;185:6548–6555. doi: 10.1128/JB.185.22.6548-6555.2003. [DOI] [PMC free article] [PubMed] [Google Scholar]
- 9.Meldau R, Peter J, Theron G, Calligaro G, Allwood B, Symons G, Khalfey H, Ntombenhle G, Govender U, Binder A, van Zyl-Smit R, Dheda K. Comparison of same day diagnostic tools including Gene Xpert and unstimulated IFN-gamma for the evaluation of pleural tuberculosis: a prospective cohort study. BMC Pulm Med. 2014;14:58. doi: 10.1186/1471-2466-14-58. [DOI] [PMC free article] [PubMed] [Google Scholar]
- 10.Usha V, Gurcha SS, Lovering AL, Lloyd AJ, Papaemmanouil A, Reynolds RC, Besra GS. Identification of novel diphenyl urea inhibitors of Mt-GuaB2 active against Mycobacterium tuberculosis. Microbiology. 2011;157:290–299. doi: 10.1099/mic.0.042549-0. [DOI] [PubMed] [Google Scholar]
- 11.Griffin JE, Gawronski JD, Dejesus MA, Ioerger TR, Akerley BJ, Sassetti CM. High-resolution phenotypic profiling defines genes essential for mycobacterial growth and cholesterol catabolism. PLoS Pathog. 2011;7:e1002251. doi: 10.1371/journal.ppat.1002251. [DOI] [PMC free article] [PubMed] [Google Scholar]
- 12.Makowska-Grzyska M, Kim Y, Gorla SK, Wei Y, Mandapati K, Zhang M, Maltseva N, Modi G, Boshoff HI, Gu M, Aldrich C, Cuny GD, Hedstrom L, Joachimiak A. Mycobacterium tuberculosis IMPDH in Complexes with Substrates, Products and Antitubercular Compounds. PLoS One. 2015;10:e0138976. doi: 10.1371/journal.pone.0138976. [DOI] [PMC free article] [PubMed] [Google Scholar]
- 13.Chen L, Wilson DJ, Xu Y, Aldrich CC, Felczak K, Sham YY, Pankiewicz KW. Triazole-linked inhibitors of inosine monophosphate dehydrogenase from human and Mycobacterium tuberculosis. J Med Chem. 2010;53:4768–4778. doi: 10.1021/jm100424m. [DOI] [PMC free article] [PubMed] [Google Scholar]
- 14.Usha V, Hobrath JV, Gurcha SS, Reynolds RC, Besra GS. Identification of novel Mt-Guab2 inhibitor series active against M. tuberculosis. PLoS One. 2012;7:e33886. doi: 10.1371/journal.pone.0033886. [DOI] [PMC free article] [PubMed] [Google Scholar]
- 15.Alland D, Steyn AJ, Weisbrod T, Aldrich K, Jacobs WR., Jr Characterization of the Mycobacterium tuberculosis iniBAC promoter, a promoter that responds to cell wall biosynthesis inhibition. J Bacteriol. 2000;182:1802–1811. doi: 10.1128/jb.182.7.1802-1811.2000. [DOI] [PMC free article] [PubMed] [Google Scholar]
- 16.Lee RE, Protopopova M, Crooks E, Slayden RA, Terrot M, Barry CE., 3rd Combinatorial lead optimization of [1,2]-diamines based on ethambutol as potential antituberculosis preclinical candidates. J Comb Chem. 2003;5:172–187. doi: 10.1021/cc020071p. [DOI] [PubMed] [Google Scholar]
- 17.Kumar P, Arora K, Lloyd JR, Lee IY, Nair V, Fischer E, Boshoff HI, Barry CE., 3rd Meropenem inhibits D,D-carboxypeptidase activity in Mycobacterium tuberculosis. Mol Microbiol. 2012;86:367–381. doi: 10.1111/j.1365-2958.2012.08199.x. [DOI] [PMC free article] [PubMed] [Google Scholar]
- 18.Tahlan K, Wilson R, Kastrinsky DB, Arora K, Nair V, Fischer E, Barnes SW, Walker JR, Alland D, Barry CE, 3rd, Boshoff HI. SQ109 targets MmpL3, a membrane transporter of trehalose monomycolate involved in mycolic acid donation to the cell wall core of Mycobacterium tuberculosis. Antimicrob Agents Chemother. 2012;56:1797–1809. doi: 10.1128/AAC.05708-11. [DOI] [PMC free article] [PubMed] [Google Scholar]
- 19.Xia J, Sinelnikov IV, Han B, Wishart DS. MetaboAnalyst 3.0--making metabolomics more meaningful. Nucleic Acids Res. 2015;43:W251–257. doi: 10.1093/nar/gkv380. [DOI] [PMC free article] [PubMed] [Google Scholar]
- 20.Pires DE, Chen J, Blundell TL, Ascher DB. In silico functional dissection of saturation mutagenesis: Interpreting the relationship between phenotypes and changes in protein stability, interactions and activity. Sci Rep. 2016;6:19848. doi: 10.1038/srep19848. [DOI] [PMC free article] [PubMed] [Google Scholar]
- 21.Worth CL, Preissner R, Blundell TL. SDM--a server for predicting effects of mutations on protein stability and malfunction. Nucleic Acids Res. 2011;39:W215–222. doi: 10.1093/nar/gkr363. [DOI] [PMC free article] [PubMed] [Google Scholar]
- 22.Pires DE, Ascher DB, Blundell TL. mCSM: predicting the effects of mutations in proteins using graph-based signatures. Bioinformatics. 2014;30:335–342. doi: 10.1093/bioinformatics/btt691. [DOI] [PMC free article] [PubMed] [Google Scholar]
- 23.Pires DE, Ascher DB, Blundell TL. DUET: a server for predicting effects of mutations on protein stability using an integrated computational approach. Nucleic Acids Res. 2014;42:W314–319. doi: 10.1093/nar/gku411. [DOI] [PMC free article] [PubMed] [Google Scholar]
- 24.Pires DE, Blundell TL, Ascher DB. Platinum: a database of experimentally measured effects of mutations on structurally defined protein-ligand complexes. Nucleic Acids Res. 2015;43:D387–391. doi: 10.1093/nar/gku966. [DOI] [PMC free article] [PubMed] [Google Scholar]
- 25.Hedstrom L, Liechti G, Goldberg JB, Gollapalli DR. The antibiotic potential of prokaryotic IMP dehydrogenase inhibitors. Curr Med Chem. 2011;18:1909–1918. doi: 10.2174/092986711795590129. [DOI] [PMC free article] [PubMed] [Google Scholar]
- 26.Biazus G, Schneider CZ, Palma MS, Basso LA, Santos DS. Hypoxanthine-guanine phosphoribosyltransferase from Mycobacterium tuberculosis H37Rv: cloning, expression, and biochemical characterization. Protein Expr Purif. 2009;66:185–190. doi: 10.1016/j.pep.2009.04.001. [DOI] [PubMed] [Google Scholar]
- 27.Zhang R, Evans G, Rotella FJ, Westbrook EM, Beno D, Huberman E, Joachimiak A, Collart FR. Characteristics and crystal structure of bacterial inosine-5'-monophosphate dehydrogenase. Biochemistry. 1999;38:4691–4700. doi: 10.1021/bi982858v. [DOI] [PubMed] [Google Scholar]
- 28.Cox JAG, Abrahams KA, Alemparte C, Ghidelli-Disse S, Rullas J, Angulo-Barturen I, Singh A, Gurcha SS, Nataraj V, Bethell S, Remuiñán MJ, Encinas L, Jervis PJ, Cammack NC, Bhatt A, Kruse U, Bantscheff M, Fütterer K, Barros D, Ballell L, Drewes G, Besra GS. THPP target assignment reveals EchA6 as an essential fatty acid shuttle in mycobacteria. Nature Microbiology. 2016;1:15006. doi: 10.1038/nmicrobiol.2015.6. [DOI] [PubMed] [Google Scholar]
- 29.Bantscheff M, Hopf C, Savitski MM, Dittmann A, Grandi P, Michon AM, Schlegl J, Abraham Y, Becher I, Bergamini G, Boesche M, Delling M, Dumpelfeld B, Eberhard D, Huthmacher C, Mathieson T, Poeckel D, Reader V, Strunk K, Sweetman G, Kruse U, Neubauer G, Ramsden NG, Drewes G. Chemoproteomics profiling of HDAC inhibitors reveals selective targeting of HDAC complexes. Nat Biotechnol. 2011;29:255–265. doi: 10.1038/nbt.1759. [DOI] [PubMed] [Google Scholar]
- 30.Gill WP, Harik NS, Whiddon MR, Liao RP, Mittler JE, Sherman DR. A replication clock for Mycobacterium tuberculosis. Nat Med. 2009;15:211–214. doi: 10.1038/nm.1915. [DOI] [PMC free article] [PubMed] [Google Scholar]
- 31.Boshoff HI, Xu X, Tahlan K, Dowd CS, Pethe K, Camacho LR, Park TH, Yun CS, Schnappinger D, Ehrt S, Williams KJ, Barry CE., 3rd Biosynthesis and recycling of nicotinamide cofactors in mycobacterium tuberculosis. An essential role for NAD in nonreplicating bacilli. J Biol Chem. 2008;283:19329–19341. doi: 10.1074/jbc.M800694200. [DOI] [PMC free article] [PubMed] [Google Scholar]
- 32.Via LE, Lin PL, Ray SM, Carrillo J, Allen SS, Eum SY, Taylor K, Klein E, Manjunatha U, Gonzales J, Lee EG, Park SK, Raleigh JA, Cho SN, McMurray DN, Flynn JL, Barry CE., 3rd Tuberculous granulomas are hypoxic in guinea pigs, rabbits, and nonhuman primates. Infect Immun. 2008;76:2333–2340. doi: 10.1128/IAI.01515-07. [DOI] [PMC free article] [PubMed] [Google Scholar]
- 33.Simmonds RJ, Harkness RA. High-performance liquid chromatographic methods for base and nucleoside analysis in extracellular fluids and in cells. J Chromatogr. 1981;226:369–381. doi: 10.1016/s0378-4347(00)86071-5. [DOI] [PubMed] [Google Scholar]
- 34.Brosch R, Gordon SV, Buchrieser C, Pym AS, Garnier T, Cole ST. Comparative genomics uncovers large tandem chromosomal duplications in Mycobacterium bovis BCG Pasteur. Yeast. 2000;17:111–123. doi: 10.1002/1097-0061(20000630)17:2<111::AID-YEA17>3.0.CO;2-G. [DOI] [PMC free article] [PubMed] [Google Scholar]
- 35.Weiner B, Gomez J, Victor TC, Warren RM, Sloutsky A, Plikaytis BB, Posey JE, van Helden PD, Gey van Pittius NC, Koehrsen M, Sisk P, Stolte C, White J, Gagneux S, Birren B, Hung D, Murray M, Galagan J. Independent large scale duplications in multiple M. tuberculosis lineages overlapping the same genomic region. PLoS One. 2012;7:e26038. doi: 10.1371/journal.pone.0026038. [DOI] [PMC free article] [PubMed] [Google Scholar]
- 36.Domenech P, Kolly GS, Leon-Solis L, Fallow A, Reed MB. Massive gene duplication event among clinical isolates of the Mycobacterium tuberculosis W/Beijing family. J Bacteriol. 2010;192:4562–4570. doi: 10.1128/JB.00536-10. [DOI] [PMC free article] [PubMed] [Google Scholar]
- 37.Domenech P, Rog A, Moolji JU, Radomski N, Fallow A, Leon-Solis L, Bowes J, Behr MA, Reed MB. Origins of a 350-kilobase genomic duplication in Mycobacterium tuberculosis and its impact on virulence. Infect Immun. 2014;82:2902–2912. doi: 10.1128/IAI.01791-14. [DOI] [PMC free article] [PubMed] [Google Scholar]
- 38.Bennett BD, Kimball EH, Gao M, Osterhout R, Van Dien SJ, Rabinowitz JD. Absolute metabolite concentrations and implied enzyme active site occupancy in Escherichia coli. Nat Chem Biol. 2009;5:593–599. doi: 10.1038/nchembio.186. [DOI] [PMC free article] [PubMed] [Google Scholar]
- 39.Park JO, Rubin SA, Xu YF, Amador-Noguez D, Fan J, Shlomi T, Rabinowitz JD. Metabolite concentrations, fluxes and free energies imply efficient enzyme usage. Nat Chem Biol. 2016;12:482–489. doi: 10.1038/nchembio.2077. [DOI] [PMC free article] [PubMed] [Google Scholar]
- 40.Duckworth BP, Wilson DJ, Nelson KM, Boshoff HI, Barry CE, 3rd, Aldrich CC. Development of a selective activity-based probe for adenylating enzymes: profiling MbtA Involved in siderophore biosynthesis from Mycobacterium tuberculosis. ACS Chem Biol. 2012;7:1653–1658. doi: 10.1021/cb300112x. [DOI] [PMC free article] [PubMed] [Google Scholar]
- 41.de Carvalho LP, Fischer SM, Marrero J, Nathan C, Ehrt S, Rhee KY. Metabolomics of Mycobacterium tuberculosis reveals compartmentalized co-catabolism of carbon substrates. Chem Biol. 2010;17:1122–1131. doi: 10.1016/j.chembiol.2010.08.009. [DOI] [PubMed] [Google Scholar]
- 42.Nandakumar M, Nathan C, Rhee KY. Isocitrate lyase mediates broad antibiotic tolerance in Mycobacterium tuberculosis. Nat Commun. 2014:5. doi: 10.1038/ncomms5306. [DOI] [PubMed] [Google Scholar]
- 43.Pesek JJ, Matyska MT, Loo JA, Fischer SM, Sana TR. Analysis of hydrophilic metabolites in physiological fluids by HPLC-MS using a silica hydride-based stationary phase. J Sep Sci. 2009;32:2200–2208. doi: 10.1002/jssc.200900270. [DOI] [PubMed] [Google Scholar]
- 44.Melmed RN, Karanian PJ, Berlin RD. Control of cell volume in the J774 macrophage by microtubule disassembly and cyclic AMP. J Cell Biol. 1981;90:761–768. doi: 10.1083/jcb.90.3.761. [DOI] [PMC free article] [PubMed] [Google Scholar]
- 45.Benjamini Y, Hochberg Y. Controlling the False Discovery Rate: A Practical and Powerful Approach to Multiple Testing. Journal of the Royal Statistical Society. Series B (Methodological) 1995;57:289–300. [Google Scholar]
- 46.Holm S. A Simple Sequentially Rejective Multiple Test Procedure. Scandinavian Journal of Statistics. 1979;6:65–70. [Google Scholar]
- 47.Ioerger TR, Feng Y, Ganesula K, Chen X, Dobos KM, Fortune S, Jacobs WR, Jr, Mizrahi V, Parish T, Rubin E, Sassetti C, Sacchettini JC. Variation among genome sequences of H37Rv strains of Mycobacterium tuberculosis from multiple laboratories. J Bacteriol. 2010;192:3645–3653. doi: 10.1128/JB.00166-10. [DOI] [PMC free article] [PubMed] [Google Scholar]
- 48.Pfaffl MW, Horgan GW, Dempfle L. Relative expression software tool (REST) for group-wise comparison and statistical analysis of relative expression results in real-time PCR. Nucleic Acids Res. 2002;30:e36. doi: 10.1093/nar/30.9.e36. [DOI] [PMC free article] [PubMed] [Google Scholar]
- 49.Andreu N, Zelmer A, Fletcher T, Elkington PT, Ward TH, Ripoll J, Parish T, Bancroft GJ, Schaible U, Robertson BD, Wiles S. Optimisation of bioluminescent reporters for use with mycobacteria. PLoS One. 2010;5:e10777. doi: 10.1371/journal.pone.0010777. [DOI] [PMC free article] [PubMed] [Google Scholar]
- 50.Singh R, Barry CE, 3rd, Boshoff HI. The three RelE homologs of Mycobacterium tuberculosis have individual, drug-specific effects on bacterial antibiotic tolerance. J Bacteriol. 2010;192:1279–1291. doi: 10.1128/JB.01285-09. [DOI] [PMC free article] [PubMed] [Google Scholar]
- 51.Savitski MM, Fischer F, Mathieson T, Sweetman G, Lang MJ, Bantscheff M. Targeted Data Acquisition for Improved Reproducibility and Robustness of Proteomic Mass Spectrometry Assays. J Am Soc Mass Spectr. 2010;21:1668–1679. doi: 10.1016/j.jasms.2010.01.012. [DOI] [PubMed] [Google Scholar]
- 52.Werner T, Sweetman G, Savitski MF, Mathieson T, Bantscheff M, Savitski MM. Ion coalescence of neutron encoded TMT 10-plex reporter ions. Anal Chem. 2014;86:3594–3601. doi: 10.1021/ac500140s. [DOI] [PubMed] [Google Scholar]
- 53.Kabsch W. Xds. Acta Crystallogr D Biol Crystallogr. 2010;66:125–132. doi: 10.1107/S0907444909047337. [DOI] [PMC free article] [PubMed] [Google Scholar]
- 54.Adams PD, Afonine PV, Bunkoczi G, Chen VB, Davis IW, Echols N, Headd JJ, Hung LW, Kapral GJ, Grosse-Kunstleve RW, McCoy AJ, Moriarty NW, Oeffner R, Read RJ, Richardson DC, Richardson JS, Terwilliger TC, Zwart PH. PHENIX: a comprehensive Python-based system for macromolecular structure solution. Acta Crystallogr D Biol Crystallogr. 2010;66:213–221. doi: 10.1107/S0907444909052925. [DOI] [PMC free article] [PubMed] [Google Scholar]
- 55.Emsley P, Cowtan K. Coot: model-building tools for molecular graphics. Acta Crystallogr D Biol Crystallogr. 2004;60:2126–2132. doi: 10.1107/S0907444904019158. [DOI] [PubMed] [Google Scholar]
- 56.Laohavaleeson S, Tessier PR, Nicolau DP. Pharmacodynamic characterization of ceftobiprole in experimental pneumonia caused by phenotypically diverse Staphylococcus aureus strains. Antimicrob Agents Chemother. 2008;52:2389–2394. doi: 10.1128/AAC.01422-07. [DOI] [PMC free article] [PubMed] [Google Scholar]
- 57.Subbian S, Tsenova L, Yang G, O'Brien P, Parsons S, Peixoto B, Taylor L, Fallows D, Kaplan G. Chronic pulmonary cavitary tuberculosis in rabbits: a failed host immune response. Open Biol. 2011;1:110016. doi: 10.1098/rsob.110016. [DOI] [PMC free article] [PubMed] [Google Scholar]
- 58.Prideaux B, Via LE, Zimmerman MD, Eum S, Sarathy J, O'Brien P, Chen C, Kaya F, Weiner DM, Chen PY, Song T, Lee M, Shim TS, Cho JS, Kim W, Cho SN, Olivier KN, Barry CE, 3rd, Dartois V. The association between sterilizing activity and drug distribution into tuberculosis lesions. Nat Med. 2015;21:1223–1227. doi: 10.1038/nm.3937. [DOI] [PMC free article] [PubMed] [Google Scholar]
Associated Data
This section collects any data citations, data availability statements, or supplementary materials included in this article.