Figure 7.
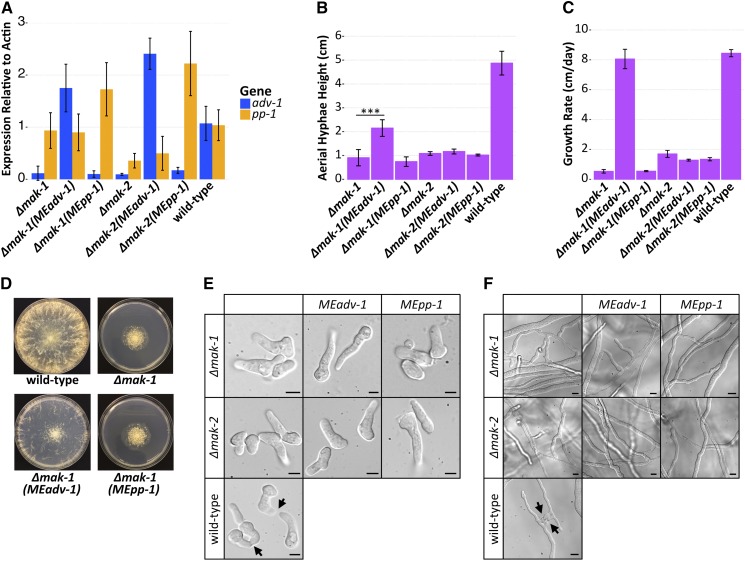
Misexpression of adv-1 suppresses the growth phenotype of the Δmak-1 mutant. (A) qRT-PCR data showing mRNA expression levels of adv-1 and pp-1 in Δmak-1 (Ptef1-adv-1-v5; his-3 (MEadv-1)), Δmak-1 (Ptef1-pp-1-v5; his-3 (MEpp-1)), Δmak-2 (Ptef1-adv-1-v5; his-3 (MEadv-1)), and Δmak-2 (Pccg1-pp-1-gfp; his-3 (MEpp-1)) strains compared to Δmak-1, Δmak-2, and wild-type cells. (B) Mean height of aerial hyphae of strains in A 3 days after inoculation (ANOVA + Tukey HSD, *** P = 3.6E−8, n = 6). (C) Mean growth rate per day of strains in A measured over 4 days (ANOVA + Tukey HSD, P < 0.01, n = 3). For all bar plots, error bars indicate SD. (D) Colony morphology of the Δmak-1 mutant relative to the wild-type strain and the Δmak-1 (Ptef1-adv-1-v5; his-3 (MEadv-1)) and Δmak-1 (Ptef1-pp-1-v5; his-3 (MEpp-1)) strains. Photos showing a lack of (E) germling fusion (Bar, 5 μm) or (F) hyphal fusion (Bar, 10 μm) for each of the strains shown in A. Arrows indicate chemotropic interactions in the wild-type strain. Plates shown in D are 8 cm in diameter.

