Abstract
Context:
The neonatal skeletal outcomes due to maternal Vitamin D deficiency.
Aims:
The aim of this study is to assess the serum 25 hydroxy Vitamin D (25[OH]D) status in pregnant women and correlate with cord blood 25(OH)D levels, femur length at 34 weeks gestation, and neonatal anthropometry (birth weight, birth length, and head circumference).
Settings and Design:
This was prospective cohort study.
Subjects and Methods:
This study was carried out in 250 healthy primigravida between 18 and 40 years of age in the third trimester of gestation attending the Obstetrics and Gynaecology Department of Gauhati Medical College, Guwahati from December 2012 to December 2015. Dietary assessment of calcium and Vitamin D intake, sunlight exposure among the pregnant mothers and fetal femur length measurements were done. The neonates were followed up at birth for biometric assessment and the estimation of cord 25(OH)D.
Statistical Analysis Used:
Chi-square test and Pearson correlation were carried out to see the association and correlation between different variables. Statistical significance was set at the 0.05 level.
Results:
We found low Vitamin D levels (60%) in the majority of pregnant mothers and newborns (62.4%). The mean Vitamin D levels were 17.51 ± 2.24 ng/ml and 14.51 ± 1.8 ng/ml among the low Vitamin D maternal subjects and their new born, respectively. There was a significant association of maternal Vitamin D levels with sun exposure, dietary intake of Vitamin D, serum calcium, serum alkaline phosphatase levels, and serum parathyroid hormone in subjects with low Vitamin D. Fetal femur length and birth length were significantly shorter in mothers with low Vitamin D (P < 0.01).
Conclusions:
Maternal hypovitaminosis D was associated with adverse skeletal outcome in neonates.
Keywords: Femur length, fetal outcomes, pregnancy, Vitamin D
INTRODUCTION
Vitamin D deficiency among pregnant mothers has been studied in depth in the past two decades. The worldwide prevalence of Vitamin D deficiency in pregnant women ranged from 25% to as high as 84%.[1,2,3,4,5,6] In India, the prevalence figure is much larger (ranging from 76% to 98%).[7,8,9] The neonatal effects described include low birth weight and abnormal anthropometric measurements[10], and in later stages, children tend to develop insulin resistance.[11] Until date, there have been no similar studies from North-Eastern province of India, and our aim is to see the fetal and neonatal outcomes among Vitamin D deficient pregnant mothers.
SUBJECTS AND METHODS
The study is a cross-sectional study carried out in primigravida of age between 18 and 40 years, attending Department of Obstetrics and Gynaecology of Gauhati Medical College, Assam from December 2012 to December 2015 for routine antenatal visits. All pregnant mothers (n = 250) had an only single fetus. The patients in the study were grouped into two: Group I (cases) – Pregnant mothers who had low serum Vitamin D levels (n = 150) and Group II (controls) - Pregnant mothers who had normal serum Vitamin D levels (n = 100). Low serum Vitamin D level in pregnant mothers comprised subjects with deficient serum Vitamin D (n = 134) and insufficient Vitamin D levels (n = 16). Vitamin D deficiency was defined as serum 25(OH)D levels of <20 ng/ml and insufficiency was defined as 25 hydroxy Vitamin D (25[OH]D) levels from 21 to 29 ng/ml as per the Endocrine Society's Clinical Practice Guidelines.[12] Patients with a history of thyroid, parathyroid, adrenal diseases, hepatic, renal failure, metabolic bone diseases, malabsorption, the use of medications affecting bone metabolism, diabetes mellitus (overt diabetes and GDM), hypertension, and documented IUGR babies were excluded from the study. Figure 1 shows the linear correlation between maternal 25 hyrdoxy vitamin D levels with femur length of fetus at 34 weeks of gestation of the whole study subjects (n=250) and Figure 2 shows the linear relationship between between maternal 25 hyrdoxy vitamin D levels with birth length of the newborn of the whole study subjects (n=250). Patient who fulfilled the study criteria underwent a detailed medical history, clinical examination, and dietary history. Dietary assessment included calcium and Vitamin D intake by estimating the average composition of the daily diet from a 24 h recall of the food intake by a published data on the nutritive value of Indian food.[13] All pregnant mothers received oral calcium supplementation (elemental calcium 500 mg/day) from Obstetrics and Gynaecology department during antenatal visits at third trimester. Total calcium intake calculated in pregnant mothers is a sum of dietary and oral calcium supplementation. Sunlight exposure was assessed using documenting average duration of exposure and percentage of the surface area of the body exposed daily. A detailed history of the daily routine during summer and winter seasons and of the type of clothing worn was taken. The percentage of body surface area exposed was assessed by Wallace's rule of nine. Sunshine exposure was calculated as – Sunshine exposure (%) = Hours of exposure/day × percentage of body surface area exposed.[8] Holick recommended that sunlight exposure of face, arms, and hands would amount to 22% of body surface area exposure. This area of exposure thrice a week for a duration of 1 h/day between 10 am to 4 pm is probably sufficient for elderly people living in a temperate climate to maintain serum 25(OH)D at 20 ng/mL.[14] A similar amount of Vitamin D is expected to be formed in the skin of the younger pregnant women who lives in more tropical latitude like northeast India if exposed for the same duration and specific time. So a value of more than 11% of sunshine exposure per day for 1 h daily would be was considered adequate for Vitamin D synthesis from the skin.[8] Biochemical tests were done in pregnant subjects at 34 weeks gestation. This included blood samples (without venostasis) for 25(OH)D, serum calcium (Ca), serum albumin, serum phosphorus (P), serum alkaline phosphatase (ALP), and serum parathyroid hormone (PTH). Blood samples were collected in the morning after subjects had fasted for at least 8 h. Furthermore, fetal femur length (in mm) was measured at 34 weeks of gestation by ultrasound technique by a competent radiologist of our medical college.
Figure 1.
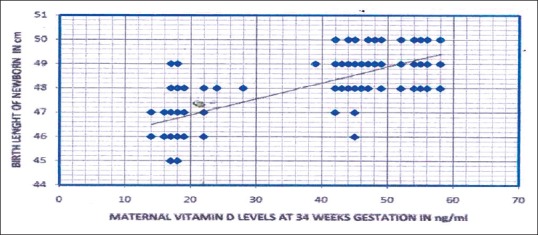
Scatter diagram showing the relation of maternal 25 hydroxy Vitamin D levels with birth length of newborn of the whole study subjects (n = 250, r = 0.78, P < 0.01)
Figure 2.
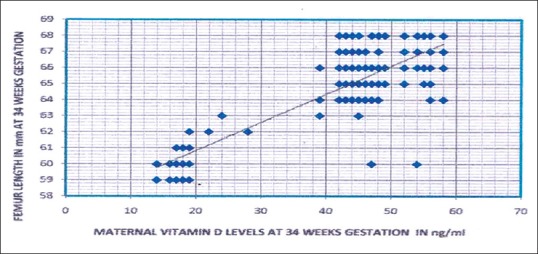
Scatter diagram showing the relation of maternal 25 hydroxy Vitamin D levels with femur length of fetus at 34 weeks of gestation of the whole study subjects (n = 250, r = 0.823, P < 0.01)
Pregnancy outcomes were noted in each subject. Anthropometric values were measured in the newborn which included birth weight (in kilogram), birth length (in cm), and head circumference (in cm). The measurements were calculated using a plastic encircling tape. Samples of cord blood were taken in newborns for cord 25(OH)D. All blood samples were separated in a refrigerated centrifuge at 1200 rotation/min for 15 min at 4°C and divided into five aliquots and stored at −20°C until analysis. Serum calcium, phosphorus, albumin, and alkaline phosphatase were measured theusing the semi-autoanalyzer method. The normal range for serum calcium is 8.4–10.2 mg/dl, for albumin 3.8–5.1 g/dl, or serum phosphorus 2.5–5 mg/dl and for alkaline phosphatase 64–306 U/l at 37°C in pregnancy. The normal range of cord 25(OH)D was taken as 20–80 ng/ml and serum PTH 20–70 pg/ml.[15] Serum and cord 25(OH)D were measured using RIA according to the manufacturer's protocol (25(OH)D RIA Kit Manufacturer Beckman Coulter). The sensitivity of this assay is 2.5 ng/ml. The intra-assay coefficient of variation is 9.1% at 22.7 ng/ml. Serum PTH was measured using immunometric assay (IRMA) according to the manufacturer's protocol (N-TACT PTH IRMA kit USA, Beckman Coulter) 10 in Automatic Gamma Counter (Gamma 10, version 2). The study was performed according to the guidelines of the Ethics Committee of our institute with informed consent. Statistical analysis was performed using SAS 9.3. Data were presented as a mean ± standard deviation. Chi-square test was carried out to see the association between different variables. Pearson correlation was done to find the pattern of correlation between the independent variables. Statistical significance was set at the 0.05 level.
RESULTS
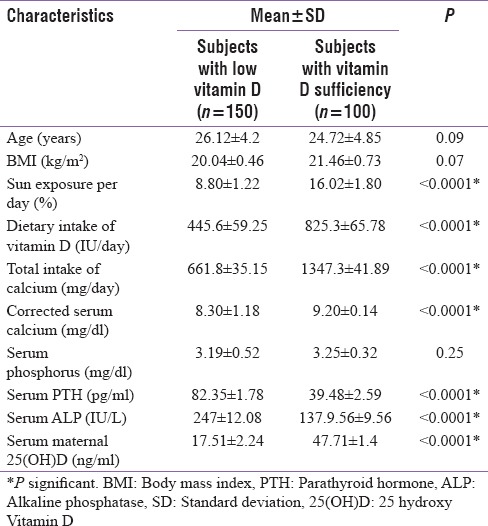
The ages of the pregnant women ranged from 18 to 40 years in all population (n = 250). The number of subjects with low Vitamin D level (deficiency and insufficiency) was 150, and Vitamin D sufficiency was 100. The mean Vitamin D levels were 17.51 ± 2.24 ng/ml and 47.71 ± 1.4 ng/ml, respectively, among the low Vitamin D and Vitamin D sufficient maternal subjects (P < 0.01). The subjects with low Vitamin D intake (deficiency and insufficiency) have significantly lower sun exposure in percentage, lower mean total calcium intake in mg per day and mean Vitamin D in IU per day and lower levels of serum corrected calcium as compared to Vitamin D sufficient subjects. On the other hand, the mean serum PTH in pg/ml and mean total alkaline phosphatase levels in IU/L were significantly higher in subjects with low Vitamin D compared to the Vitamin D sufficient group.
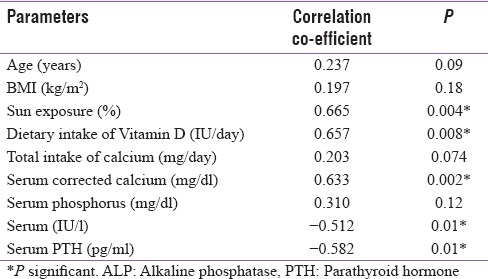
On correlation analysis, significant positive correlation between maternal serum 25(OH)D levels with sun exposure (r = 0.66), dietary intake of Vitamin D (r = 0.65), and corrected calcium level (r = 0.63) were found among the pregnant mothers with low Vitamin D levels [Table 3]. Significant negative correlations were found between 25(OH)D levels, serum total alkaline phosphatase levels (r = −0.512), and serum PTH levels (−0.582). Linear regression model analysis was performed and showed significant association between maternal serum 25(OH)D with sun exposure and intake of Vitamin D
Table 3.
Pearson correlation co-efficients showing the correlation of 25 hydroxy Vitamin D levels with different variables in pregnant women with low Vitamin D levels (n=150)
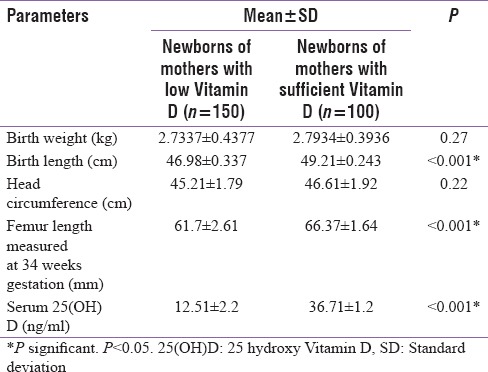
A significantly lower mean fetal femur length and birth length was seen infants of women born with low Vitamin D levels. No significant differences were found among the newborns with regard to birth weight and head circumference. The mean cord Vitamin D levels were 12.51 ± 2.2 ng/ml and 36.71 ± 1.2 ng/ml, respectively, among the low Vitamin D and Vitamin D sufficient neonates (P < 0.001)
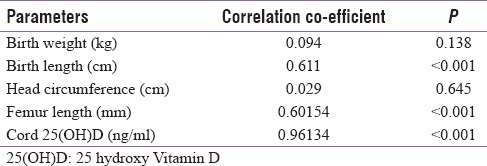
Finally, we did a Pearson correlation analysis to find a relationship between maternal Vitamin D levels among the pregnant subjects with low Vitamin D and their fetal outcomes (birth weight, femur length, and cord blood Vitamin D levels) [Table 1]. In this, we found a significant positive correlation between femur length, birth length, and maternal serum Vitamin D levels (r = 0.60, P < 0.01 and r = 0.611, P < 0.01). We also found that the cord blood Vitamin D in these newborn levels also had a significant positive correlation with their maternal Vitamin D levels (r = 0.96, P < 0.01).
Table 1.
Pearson correlation analysis showing the correlation between maternal 25 hydroxy Vitamin D levels among the pregnant subjects with low Vitamin D (n=150) and different parameters of their newborns
DISCUSSION
Among the 250 pregnant mothers studied 53.6% were Vitamin D deficient, 6.4% were Vitamin D insufficient and 40% were in Vitamin D sufficient range. Nearly half the maternal population (53.6%) in north-east are Vitamin D deficient. Compared to studies done in other parts of India the prevalence is quite low in North-East India. In Lucknow, the same has been reported as 74% by Sahu et al.[7] as 84% by Sachan et al.[8] whereas Marwah et al.[9] stated 96.3% deficiency in pregnant women of Delhi. This low prevalence of Vitamin D deficiency in our subjects in the northeast may be attributed to several factors. The first reason is the geographical location of the north-east India which ensures adequate sunshine throughout the year. The average duration of cloud-free sunshine in this region is around 8-10 h/day throughout the year. This translates that ample sunshine reaches the population winter is short with the lowest temperature of 12°C and highest of 22°C.[16] Hence, there is a little seasonal variation of the peak intensity of sunlight in northeast India. Second, the diet of the people in this region is naturally rich in Vitamin D. Rice is the staple food, and it contains very low phytate. Moreover, milk, vegetables, and fishes are consumed in abundance which contain adequate amount of the Vitamin D. Hence, an individual in the northeast who takes an adequate Vitamin D and have sunlight exposure is unlikely to be Vitamin D deficient. This is also evident from this study when we compared Vitamin D sufficient pregnant women with the low Vitamin D group [Table 2]. Table 2 shows that subjects with low Vitamin D levels (deficiency and insufficiency) have significantly less sun exposure and Vitamin D as compared to Vitamin D sufficient subjects suggesting that the adequacy of serum Vitamin D levels are solely depend on sunlight and dietary intake. On correlation model analysis, a similar finding was also seen. There was a significant positive correlation between maternal serum 25(OH)D levels with sun exposure (r = 0.665) and dietary intake of Vitamin D (r = 0.657) [Table 3]. These findings are similar to earlier studies done in India.[7,8,9] It was noticed that despite giving calcium supplements (500 mg/day) to all pregnant mothers, the total calcium intake among the low Vitamin D pregnant group was far below (661.8 ± 35.15 mg/dl) the calcium requirement for an average pregnant lady (RDA 1200 mg/day). Low Vitamin D subjects also had an elevated total alkaline phosphate and PTH levels. On correlation model, a significant negative correlations between 25(OH)D levels and serum total alkaline phosphatase levels (r = −0.512) and PTH levels (r = −0.582). These findings were consistent with earlier studies like from India Marya et al. (found raised alkaline phosphatase in 13% of pregnant women who were not receiving Vitamin D supplement).[10] Similar findings were also seen in studies from other countries such as Rab et al. from Pakistan[17] and Brooke et al. from the UK.[18] This elevation is attributed to raised bone alkaline phosphate seen in Vitamin D deficiency state. Elevation in PTH secretion is compensatory (secondary hyperparathyroidism) due to hypocalcemic stimuli.[19] The mean serum calcium levels in the low Vitamin D subjects were below the lower range of normal calcium (8.30 ± 1.18 mg/dl) qualifying to the definition of hypocalcemia and hence raising PTH levels. Although the mean serum calcium levels in the low Vitamin D group was below the lower range of normal calcium (8.30 ± 1.18), none of the subjects had symptoms or signs of hypocalcemia. There three major sources of maternal calcium to maintain fetal bone growth. They are increased absorption of intestinal calcium, reduced renal calcium excretion, and calcium resorption from the maternal skeleton. Increased intestinal calcium absorption is an important compensatory mechanism for attaining additional calcium during pregnancy.[19] It occurs along with an increase in Vitamin D concentrations (4%–62%) in the third trimester. The intestinal absorption of calcium increases by 60%–70% during pregnancy, from approximately 33%–36% in the nonpregnant state to 50%–56% in the second trimester and to 54%–62% in the third trimester. Renal calcium excretion increases by 46% during the period of pregnancy among women.[19] This increase is due to the increased glomerular filtration rate occurring during pregnancy. In our study, low corrected serum calcium levels in low Vitamin D subjects may be attributed to low serum Vitamin D levels. Low Vitamin D leads to defective absorption of calcium from gut.[19] Linear regression model analysis done to find the association between the different variables in pregnant mothers with low Vitamin D levels and showed the same results (P < 0.01).
Table 2.
Baseline characteristics of subjects (n=250)
The newborns of low Vitamin D mothers in our study had significantly lower mean birth length and femur length measured at 34 weeks gestation as compared to Vitamin D sufficient mothers [Table 4]. Pearson correlation analysis between the pregnant subjects with low Vitamin D and their newborns showed a significant positive correlation between birth length, femur length, and maternal serum Vitamin D levels [Table 1]. The femur length measurement in USG during gestation signifies the fetal gestational age. Fetal length can be demarcated as early as 13 weeks and its growth proceeds till term. Altman and Chitty et al. have taken femur length in millimeters to estimate gestational age of fetus in weeks expressed in percentile (from 5th centile to 95th centile of gestational age) starting from 13 weeks of gestation till 38 weeks defined by ultrasound scan.[20] At 34 weeks of gestation, femur head completes its ossification and helps to identify the bone age. The coinciding of the chronological gestational age with the bone age signifies normal fetal growth.[21] We choose 34 weeks as the age of estimation of femur length considering the same. Furthermore, we could find a significant correlation was found between cord 25(OH)D and birth length (r = 0.62, P < 0.001). Now the explanation for a low femur length has already been elaborated by Morley et al.[22] He proposed that reduced osteoblastic activity as a consequence of fetal low 25(OH)D and activation of PTH/PTHrP activity in the fetus lead to contraction of the cortical bone envelope and cause reduced long bone growth like the femur. The low Vitamin D levels among newborns might be the cause for the short femur length as explained by Morley et al. Now seeing into the Vitamin D status in newborn of low Vitamin D mothers [Table 1] it is well understood that the Vitamin D status in newborn is dependent on maternal 25(OH)D levels which are the entire source of Vitamin D pool of the fetus.[23] The levels of 25(OH)D in cord blood ranges from 68% to 100% of maternal concentrations at the time of delivery.[24] Wegienka et al. have revealed a strong correlation between prenatal and cord Vitamin D levels, with the degree of association being influenced by race, parity, and the maternal level.[24] Similarly, Godang et al. found a strong positive association between maternal levels of 25(OH)D and cord 25(OH)D (β = 0.42, P < 0.001) in 202 Scandinavian women.[25] We also got a significant positive co-relation between maternal and cord Vitamin D levels in low Vitamin D pregnant subjects and their newborns (r = 0.96, P < 0.01). Our findings of low cord blood 25(OH)D, therefore, reflects the maternal Vitamin D deficiency. Hence to summarize low calcium flow from mother to fetus along with low Vitamin D in mother explains the entire vicious. Maternal calcium and Vitamin D are essential for fetal skeletal development. However, no significant differences were found among the newborns with birth weight and head circumference and Vitamin D levels in mother.
Table 4.
Comparison of different parameters of the newborns of mothers with low Vitamin D with newborns of Vitamin D sufficient mothers
CONCLUSIONS
Maternal hypovitaminosis D is associated with significantly short femur length at 34 weeks of gestation with significant lower birth length. However, no significant association was noted between birth weight and head circumference and maternal Vitamin D levels among the newborn. As seen in previous studies, the integrity of Vitamin D and calcium axis in mother and fetus is completely dependent on the dietary intake of Vitamin D, calcium and exposure to sunlight in mothers.
Financial support and sponsorship
This study was financially supported by Srimanta Sankardev University of Heath Sciences (SSUHS).
Conflicts of interest
There are no conflicts of interest.
REFERENCES
- 1.Dawodu A, Wagner CL. Mother-child Vitamin D deficiency: An international perspective. Arch Dis Child. 2007;92:737–40. doi: 10.1136/adc.2007.122689. [DOI] [PMC free article] [PubMed] [Google Scholar]
- 2.Javaid MK, Crozier SR, Harvey NC, Gale CR, Dennison EM, Boucher BJ, et al. Maternal Vitamin D status during pregnancy and childhood bone mass at age 9 years: A longitudinal study. Lancet. 2006;367:36–43. doi: 10.1016/S0140-6736(06)67922-1. [DOI] [PubMed] [Google Scholar]
- 3.Dawodu A, Agarwal M, Patel M, Ezimokhai M. Serum 25-hydroxyvitamin D and calcium homeostasis in the United Arab Emirates mothers and neonates: A preliminary report. Middle East Paediatr. 1997;2:9–12. [Google Scholar]
- 4.Bassir M, Laborie S, Lapillonne A, Claris O, Chappuis MC, Salle BL, et al. Vitamin D deficiency in Iranian mothers and their neonates: A pilot study. Acta Paediatr. 2001;90:577–9. [PubMed] [Google Scholar]
- 5.Judkins A, Eagleton C. Vitamin D deficiency in pregnant New Zealand women. N Z Med J. 2006;119:U2144. [PubMed] [Google Scholar]
- 6.van der Meer IM, Karamali NS, Boeke AJ, Lips P, Middelkoop BJ, Verhoeven I, et al. High prevalence of Vitamin D deficiency in pregnant non-western women in the Hague, Netherlands. Am J Clin Nutr. 2006;84:350–3. doi: 10.1093/ajcn/84.1.350. [DOI] [PubMed] [Google Scholar]
- 7.Sahu M, Das V, Aggarwal A, Rawat V, Saxena P, Bhatia V, et al. Vitamin D replacement in pregnant women in rural North India: A pilot study. Eur J Clin Nutr. 2009;63:1157–9. [Google Scholar]
- 8.Sachan A, Gupta R, Das V, Agarwal A, Awasthi PK, Bhatia V, et al. High prevalence of Vitamin D deficiency among pregnant women and their newborns in Northern India. Am J Clin Nutr. 2005;81:1060–4. doi: 10.1093/ajcn/81.5.1060. [DOI] [PubMed] [Google Scholar]
- 9.Marwaha RK, Tandon N, Chopra S, Agarwal N, Garg MK, Sharma B, et al. Vitamin D status in pregnant Indian women across trimesters and different seasons and its correlation with neonatal serum 25-hydroxyvitamin D levels. Br J Nutr. 2011;106:1383–9. doi: 10.1017/S000711451100170X. [DOI] [PubMed] [Google Scholar]
- 10.Marya RK, Rathee S, Dua V, Sangwan K. Effect of Vitamin D supplementation during pregnancy on foetal growth. Indian J Med Res. 1988;88:488–92. [PubMed] [Google Scholar]
- 11.Krishnaveni GV, Veena SR, Winder NR, Hill JC, Noonan K, Boucher BJ, et al. Maternal Vitamin D status during pregnancy and body composition and cardiovascular risk markers in Indian children: The mysore parthenon study. Am J Clin Nutr. 2011;93:628–35. doi: 10.3945/ajcn.110.003921. [DOI] [PMC free article] [PubMed] [Google Scholar]
- 12.Holick MF, Binkley NC, Bischoff-Ferrari HA, Gordon CM, Hanley DA, Heaney RP, et al. Evaluation, treatment, and prevention of Vitamin D deficiency: An endocrine society clinical practice guideline. J Clin Endocrinol Metab. 2011;96:1911–30. doi: 10.1210/jc.2011-0385. [DOI] [PubMed] [Google Scholar]
- 13.Sesikeran B. Revised RDA for Indians- (Report of the Expert Group of ICMR) -NIN-ICMR, Hyderabad. 2010 [Google Scholar]
- 14.Holick MF. McCollum award lecture, 1994: Vitamin D – New horizons for the 21st century. Am J Clin Nutr. 1994;60:619–30. doi: 10.1093/ajcn/60.4.619. [DOI] [PubMed] [Google Scholar]
- 15.Vieth R. Vitamin D supplementation, 25-hydroxyvitamin D concentrations, and safety. Am J Clin Nutr. 1999;69:842–56. doi: 10.1093/ajcn/69.5.842. [DOI] [PubMed] [Google Scholar]
- 16.Harinarayan CV, Holick MF, Prasad UV, Vani PS, Himabindu G. Vitamin D status and sun exposure in India. Dermatoendocrinol. 2013;5:130–41. doi: 10.4161/derm.23873. [DOI] [PMC free article] [PubMed] [Google Scholar]
- 17.Rab SM. Occult osteomalacia amongst healthy and pregnant women in Pakistan. Lancet. 1976;2:1211–3. doi: 10.1016/s0140-6736(76)91141-7. [DOI] [PubMed] [Google Scholar]
- 18.Brooke OG, Brown IR, Cleeve HJ, Sood A. Observations on the Vitamin D state of pregnant Asian women in London. Br J Obstet Gynaecol. 1981;88:18–26. doi: 10.1111/j.1471-0528.1981.tb00931.x. [DOI] [PubMed] [Google Scholar]
- 19.Kovacs CS. Calcium and bone metabolism in pregnancy and lactation. J Clin Endocrinol Metab. 2001;86:2344–8. doi: 10.1210/jcem.86.6.7575. [DOI] [PubMed] [Google Scholar]
- 20.Altman DG, Chitty LS. New charts for ultrasound dating of pregnancy. Ultrasound Obstet Gynecol. 1997;10:174–91. doi: 10.1046/j.1469-0705.1997.10030174.x. [DOI] [PubMed] [Google Scholar]
- 21.Goldstein I, Lockwood C, Belanger K, Hobbins J. Ultrasonographic assessment of gestational age with the distal femoral and proximal tibial ossification centers in the third trimester. Am J Obstet Gynecol. 1988;158:127–30. doi: 10.1016/0002-9378(88)90793-4. [DOI] [PubMed] [Google Scholar]
- 22.Morley R, Carlin JB, Pasco JA, Wark JD. Maternal 25-hydroxyvitamin D and parathyroid hormone concentrations and offspring birth size. J Clin Endocrinol Metab. 2006;91:906–12. doi: 10.1210/jc.2005-1479. [DOI] [PubMed] [Google Scholar]
- 23.Viljakainen HT, Saarnio E, Hytinantti T, Miettinen M, Surcel H, Mäkitie O, et al. Maternal Vitamin D status determines bone variables in the newborn. J Clin Endocrinol Metab. 2010;95:1749–57. doi: 10.1210/jc.2009-1391. [DOI] [PubMed] [Google Scholar]
- 24.Wegienka G, Kaur H, Sangha R, Cassidy-Bushrow AE. Maternal-cord blood Vitamin D correlations vary by maternal levels. J Pregnancy 2016. 2016 doi: 10.1155/2016/7474192. 7474192. [DOI] [PMC free article] [PubMed] [Google Scholar]
- 25.Godang K, Frøslie KF, Henriksen T, Qvigstad E, Bollerslev J. Seasonal variation in maternal and umbilical cord 25(OH) Vitamin D and their associations with neonatal adiposity. Eur J Endocrinol. 2014;170:609–17. doi: 10.1530/EJE-13-0842. [DOI] [PubMed] [Google Scholar]


