Abstract
This paper introduces a non-invasive, quantitative technique to diagnose the progression of non-alcoholic fatty liver disease (NAFLD). The method is predicated on two fundamental principles: 1) the speed of sound in a fatty liver is lower than that in a healthy liver and 2) the quality of an ultrasound image is maximized when the beamformer’s speed of sound matches the true speed of sound in the tissue being examined. The proposed method uses the echogenicity of an ultrasound image as a quantitative measure to estimate the true speed of sound within the liver parenchyma and capture its correlation with the underlying fat content. The proposed technique was evaluated in simulations and then tested ex vivo on sheep liver, mice liver (healthy and fatty) and tissue-mimicking phantoms. In the case of the phantom and sheep liver, the method was able to estimate the true speed of sound with errors of less than 0.5%; in the case of the mice livers, the method was able to accurately estimate the speed of sound within the livers (less than 1% error) and capture the correlation between fat content and speed of sound. Thereby, demonstrating the capability of ultrasound technology to non-invasively, quantitatively, and accurately diagnose NAFLD at point of care.
I. Introduction
Non-alcoholic fatty liver disease (NAFLD) is a chronic disease defined as the presence of hepatic steatosis in the absence of any known cause and minimal alcohol use [1]. As of today, it has an estimated worldwide prevalence of 25% to 45% [1, 2]. In the United States, NAFLD afflicts roughly 30% of the population, and by 2020, NAFLD is projected to be the leading indicator, and cause, of liver transplantations in the world [3, 4]. Moreover, NAFLD has been recognized as an independent cardiovascular disease risk factor and has been associated with severe metabolic impairments such as insulin resistance, hypertension, obesity, and Type 2 diabetes. [5, 6, 7].
The spectrum of NAFLD is divided into two categories; (1) simple steatosis (NAFL), which is defined as excess liver fat without inflammation and (2) nonalcoholic steatohepatitis (NASH), which is defined as excess liver fat with inflammation and/or fibrosis [2, 8]. Historically, it was believed that NAFL is non-progressive, and does not result in liver fibrosis, whereas NASH results in chronic liver injury and progressive fibrosis [2]. However, recent longitudinal studies have shown that even patients with NAFL can progress [9]. In light of this data, the diagnosis and distinction of NAFL and NASH is highly relevant for effective prognosis and patient management.
A liver biopsy is the accepted reference standard for the diagnosis of NAFLD and distinction of NAFL and NASH. Biopsies are costly, invasive, associated with morbidity and uncommon mortality, and are subject to significant variability and sampling error. In a disease that affects roughly 30% of the population, it is impractical for diagnosis and risk stratification. As a result, clinicians prefer to use alternative tests such as serum biomarkers and radiological imaging tests [9, 10]. These techniques have been shown to have low sensitivity and specificity which is further exacerbated by the fact that as many as 50% of patients with NAFLD have normal liver chemistries [11].
There is a need for a methodology that allows for the quick and reliable quantification of liver fat at the point of care.
II. Quantitative ultrasound for the diagnosis of nafld
Fat has a relatively lower speed of sound than healthy liver tissue. Consequently, the expected speed of sound in a fatty liver will be lower than that in a healthy liver [12, 13, 14, 15]. Shifts in the expected speed of sound within the liver parenchyma can be used to quantify the associated fat content.
Estimating the speed of sound in vivo is a non-trivial task; commercial ultrasound machines use an assumed speed of sound (1540 m/s) in clinical settings. This assumption is limiting, because the speed of sound in human tissues is known to range from less than 1450 m/s to over 1600 m/s [13]. Various techniques have been used to estimate the true speed of sound; some of the commonly used parameters include backscatter coefficients, speckle size, echo amplitude, and attenuation coefficients, [13, 16, 17, 18]. All these methods exploit the fact that when the assumed speed of sound in the beamformer matches that in the tissue being examined, a resulting measure of the quality of the B-mode image is maximized. More narrowly, in speckle-dominated B-mode images (e.g. those of the liver parenchyma), speckle brightness around the focal zone is maximized when the appropriate speed of sound is used by the beamformer during image formation.
The use of speckle to assess quality of beamformation arises from the work of Smith and Wagner [19]. This concept was extended by Nock and Trahey who optimized speckle characteristics by adjusting beamformation delays until the brightness was the greatest at the desired focus [20]
In our work, we apply a universal speed of sound correction, as opposed to the individual channel-by-channel correction of Nock and Trahey, to obtain an estimate of the bulk speed of sound within the liver and use it to quantify the associated fat content.
III. Metrics and Methods
A. Echogenicity (Brightness) Metric
The rationale behind analyzing the echogenicity around the intended focal zone is as follows: in commercial ultrasound machines, beam steering is achieved by the application of appropriate time delays across the active aperture [20]. In order to determine the timing delays, most commercial ultrasound machines make an assumption about the speed of sound within the medium e.g. 1540 m/s. If this assumption is correct, the wavefronts from the individual elements will constructively interfere at the intended focal zone and maximize the corresponding echogenicity. More often than not, however, this assumption is faulty and the echogenicity at the intended focal zone is diminished due to inadvertent destructive interference.
The proposed method exploits this fact and computes the echogenicity or brightness metric. For a given speed of sound (beamformation), the envelopes of the RF data (RF) (or equivalently IQ data) data are determined by the Hilbert Transform. Then, the samples corresponding to a region around the expected focal zone (Bfz) are extracted and a spatial mean is determined across all available A-lines (Nal). This results in an estimate of the average brightness around the focal zone captured by the following equation:
The metric requires no calibration and can be performed at point of care. Moreover, the metric can be computed with minimal computational cost and does not necessitate any changes to the hardware of commercial ultrasound systems, making it an attractive alternative to current methods.
B. Simulations
A MATLAB-based, Fast Object-oriented C++ Ultrasound Simulation (FOCUS) was first utilized to validate the proposed technique. FOCUS utilizes the fast near-field method to solve the non-linear, wave equation in three-dimensional space.
A tissue-mimicking domain was constructed with the following dimensions: 5 cm x 1 cm x 6 cm (x, y and z); a scatterer density of 1.7 scatterers/cm3 was chosen and point scatterers were randomly distributed within the bulk of the phantom. Scatterers were designed to have randomly distributed reflection coefficients. Simulations were conducted with a 192-element, linear ultrasound transducer with a center frequency of 1 MHz; the pitch of the transducer was ¼ of the effective wavelength with an aperture of 36.5 mm. The sampling frequency was set to 200 MHz to eliminate aliasing effects. The axial and azimuthal focal depths were held constant at 3 cm (sound wave propagation was along the z direction). In order to simulate the effect of uncertainty in the speed of sound, the true speed of sound within the computational domain was held fixed at 1540 m/s while the assumed speed of sound for the beamforming process was swept from 1460 m/s to 1620 m/s in increments of 20 m/s. The outputs of the simulations were the resulting beamformed RF data for each of the 192 elements. All other parameters were held constant across all the simulations and care was taken to ensure that the intended focus was well within the near-field of all transducer configurations.
C. Experiments
The proposed method was tested in the following experimental configurations: i) CIRS liver phantom ii) sheep liver iii) fatty and control mice liver. The CIRS Liver phantom (true speed of sound = 1540 m/s) was a calibrated liver phantom manufactured by Computerized Imaging Reference Systems (CIRS). The sheep liver was obtained from a local butcher shop in Cambridge, Massachusetts under. The mice livers were obtained from the Laboratory for Lipid Medicine & Technology at Massachusetts General Hospital Charlestown, MA. All testing was performed in accordance with prior Institutional Review Board (IRB) approval and in collaboration with the Massachusetts General Hospital.
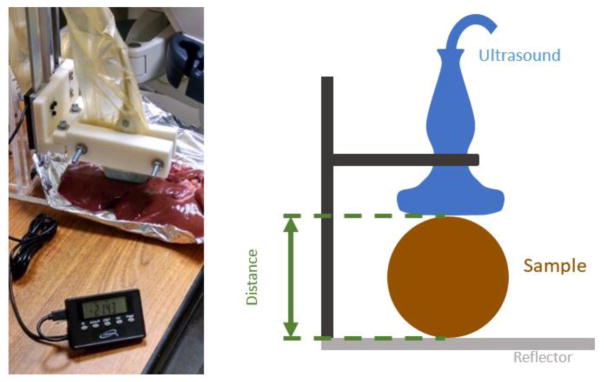
The imaging of all specimens was performed on a GE Logiq E9 System with a 9 L-D probe. RF and B-mode images were collected from the machine with differing assumed speeds of sound in the beamforming process ranging from 1400 to 1620 m/s (1400, 1420, 1480, 1500, 1540, 1580, 1620 m/s). Ground-truth speed of sound measurements were obtained using the experimental setup in Figure 1.
Figure 1.
Measured distance calibration on the GE Logiq E9 (9 MHz probe) for determination of ex vivo ground-truth speed of sound values.
Travel distance through the specimen was measured. A mechanical fixture firmly held the ultrasound probe at a known distance from a surface. The specimen was placed between a fixed surface and the ultrasound probe. The distance measurement was obtained using a digital micrometer accurate to 0.001 inches. A bulk speed of sound was estimated from the travel distance and travel time.
IV. Results
A. Simulations
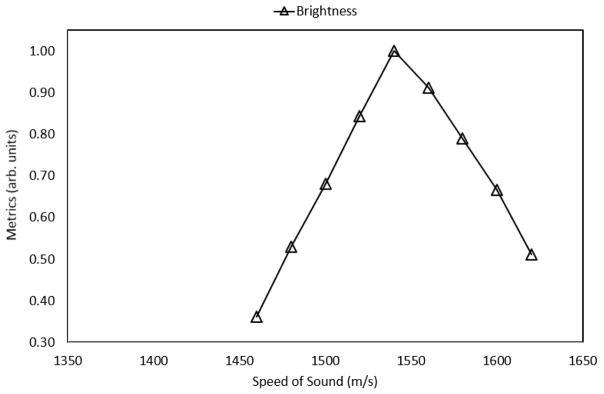
Figure 2 shows the predicted speed of sound within the medium that was obtained using the normalized, echogenicity metric; the values were normalized with respect to the maximum value. The assumed speed in the beamformer was varied from 1460 m/s to 1620 m/s; the center frequency of the transducer was held at 1 MHz and the true speed in the medium was held at 1540 m/s. The echogenicity metric was found to accurately predict the true speed of sound in the medium (error less than 0.1%); in the figure below, the predicted sound speed corresponds to a normalized value of 1.0 for the echogenicity metric.
Figure 2.
Predicted speed of sound in the CIRS liver phantom; the prediction coincides with the calibrated value of 1540 m/s, resulting in an error of less than 0.5%.
B. CIRS Liver Phantom
Figure 3 shows the normalized echogenicity metric as a function of the assumed beamforming speed of sound for the CIRS liver phantom.
Figure 3.
Pathology results of the sheep liver show a lack of large fat vacuoles within the parenchyma, thereby corroborating its leanness; hematoxylin and eosin stain (left) and oil-red-o stain (right) for staining lipids and triglycerides.
The metric accurately predicts the true speed of sound (1540 m/s) with less than 0.1% error. In the above plot, the predicted speed of sound has a corresponding normalized metric of 1.0 (maximum).
C. Sheep Liver (Ex-vivo)
Figure 3 shows the pathology results of the sheep liver; as seen below, the liver was found to be devoid of large fat vacuoles.
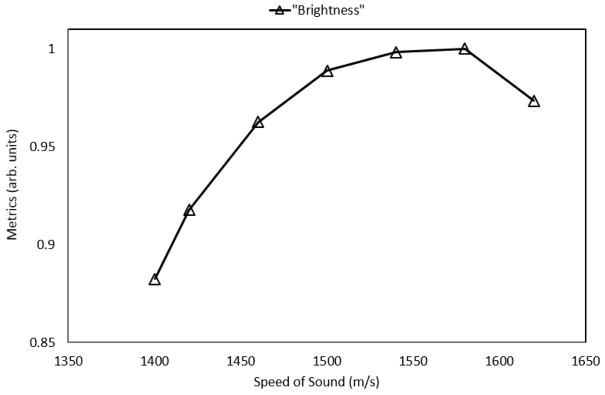
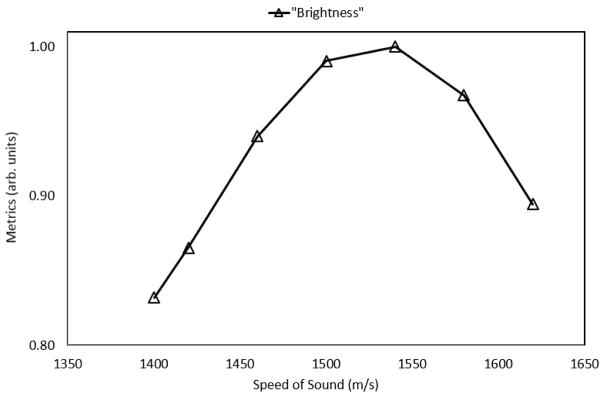
Figure 4 shows the normalized metric as a function of the assumed beamforming sound speed on the GE Logiq E9. The metric predicted a bulk sound speed of roughly 1540 m/s, corresponding to a maximum, normalized value of 1.0 in the figure below.
Figure 4.
Predicted speed of sound (1540 m/s) within the liver parenchyma using the normalized metric; ground truth measurements indicated that the speed of sound within the liver is roughly 1540 m/s, resulting in an error of less than 1%.
Ground truth measurements obtained using the setup in Figure 1 found the estimated bulk speed of sound within the liver to be 1540 m/s, thereby validating the accuracy of the proposed method.
D. Normal and Fatty Mice Liver (Ex-Vivo)
The proposed technique was utilized to predict the speed of sound in a healthy mouse liver and the liver of a mouse that was subjected to a high-fat diet for a prolonged duration of time.
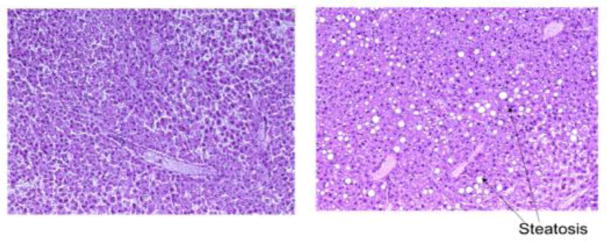
Figure 5 shows the pathology slides of the corresponding livers.
Figure 5.
Pathology results of the control specimen, indicating a lack of fat vacuoles (left) and fatty specimen with a large number of fat vacuoles (right).
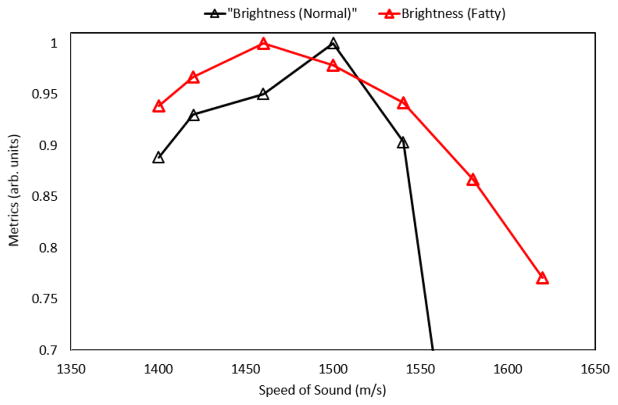
Shown in Figure 5, the control specimen (left) was found to be far leaner (< 5% fat) than the fatty liver (>15% fat) as rated by a professional pathologist. This is also evident from the presence of a large number of fat vacuoles within the fatty specimen. Shown in Figure 6, the less fatty liver was found to have an estimated speed of sound of 1500 m/s (normalized metric of 1.0) and the fatty liver was found to have an estimated speed of sound of 1460 m/s (normalized metric of 1.0), suggestive of the ability of the proposed metric to quantify the effects of fat infiltration into the liver.
Figure 6.
Predicted speed of sound in the control specimen (1500 m/s) and the fatty specimen (1460 m/s); the predictions are consistent with the pathology results from above.
V. Conclusion
The proposed method involves the iterative estimation of the bulk speed of sound within the liver parenchyma using the echogenicity of the ultrasound images around the expected focal zone. The algorithm’s capability to extract the true speed of sound was evaluated in tissue-mimicking phantoms, ex-vivo sheep and mice livers; comparison to ground truth measurements indicated that the proposed method was able to predict the speed of sound to within 0.5%. The algorithm’s future potential to non-invasively and quantitatively diagnose NAFLD was preliminarily evaluated by using it to predict the speed of sound in the livers of mice of two kinds: 1) lean and 2) those subjected to a high fat diet for a prolonged duration of time. The algorithm accurately predicted the true sound speeds in the livers (less than 0.5% error); it also illustrated decreased sound speeds in the liver parenchyma due to fatty infiltration.
Much work remains before this quantitative ultrasound approach can emerge as a viable clinical option for the diagnosis of NAFLD. The echogenicity of an ultrasound image is affected by compression and operating conditions (e.g. acousto-elastic effect. The use of such an approach will be complicated by the presence of layers of subcutaneous fat which will skew the predictions. Investigations are underway to tackle most, if not all, of these issues.
Figure 2.
Predicted speed of sound in the simulation medium using the echogenicity metric; the prediction coincides with the true of 1540 m/s, resulting in an error of less than 0.5%.
Acknowledgments
The authors would like to thank the members of the Device Realization and Computational Instrumentation Laboratory.
References
- 1.Williams CD, Stengel J, Asike MI, Torres DM, Shaw J, Contreras M, et al. Prevalence of nonalcoholic fatty liver disease and nonalcoholic steatohepatitis among a largely middle-aged population utilizing ultrasound and liver biopsy: a prospective study. Gastroenterology. 2011 Jan;140(1):124–31. doi: 10.1053/j.gastro.2010.09.038. [DOI] [PubMed] [Google Scholar]
- 2.Chalasani N, Younossi Z, Lavine JE, Diehl AM, Brunt EM, Cusi K, et al. The diagnosis and management of non-alcoholic fatty liver disease: practice guideline by the American Gastroenterological Association. American Association for the Study of Liver Diseases, and American College of Gastroenterology. 2012;142:1592–609. doi: 10.1053/j.gastro.2012.04.001. [DOI] [PubMed] [Google Scholar]
- 3.Rinella ME. Nonalcoholic fatty liver disease: a systematic review. Journal of American Medical Association. 2015 Jun;313(22):2263–73. doi: 10.1001/jama.2015.5370. [DOI] [PubMed] [Google Scholar]
- 4.Idowu MO, Chhatrala R, Siddiqui MB, Driscoll C, Stravitz RT, Sanyal AJ, et al. De novo hepatic steatosis drives atherogenic risk in liver transplantation recipients. Liver Transplantation. 2015 Oct;21(11):1395–402. doi: 10.1002/lt.24223. [DOI] [PubMed] [Google Scholar]
- 5.Athyros VG, Tziomalos K, Katsiki N, Doumas M, Karagiannis A, Mikhailidis DP. Cardiovascular risk across the histological spectrum and the clinical manifestations of non-alcoholic fatty liver disease: An update. World Journal of Gastroenterology. 2015 Jun;21(22):6820–34. doi: 10.3748/wjg.v21.i22.6820. [DOI] [PMC free article] [PubMed] [Google Scholar]
- 6.Schwimmer JB, Pardee PE, Lavine JE, Blumkin AK, Cook S. Cardiovascular Risk Factors and the Metabolic Syndrome in Pediatric Nonalcoholic Fatty Liver Disease. 2008 Jun;118(3):277–83. doi: 10.1161/CIRCULATIONAHA.107.739920. [DOI] [PMC free article] [PubMed] [Google Scholar]
- 7.Kelishadi R, Cook SR, Adibi A, Faghihimani Z, Ghatrehsamani S, Beihaghi A, et al. Association of the components of the metabolic syndrome with nonalcoholic fatty liver disease among normal-weight, overweight and obese children and adolescents. Diabetology and Metabolic Syndrome. 2009;1(1) doi: 10.1186/1758-5996-1-29. [DOI] [PMC free article] [PubMed] [Google Scholar]
- 8.McPherson S, Hardy T, Henderson E, Burt AD, Day CP, Anstee QM. Evidence of NAFLD progression from steatosis to fibrosing-steatohepatitis using paired biopsies: implications for prognosis and clinical management. Journal of Hepatology. 2015 May;62(5):1148–55. doi: 10.1016/j.jhep.2014.11.034. [DOI] [PubMed] [Google Scholar]
- 9.Chalasani N, Younossi Z, Lavine JE, Diehl AM, Brunt EM, Cusi K, et al. The diagnosis and management of non-alcoholic fatty liver disease: practice Guideline by the American Association for the Study of Liver Diseases, American College of Gastroenterology, and the American Gastroenterological Association. Hepatology (Baltimore, Md) 2012;55:2005–23. doi: 10.1002/hep.25762. [DOI] [PubMed] [Google Scholar]
- 10.Vajro P, Lenta S, Socha P, Dhawan A, McKiernan P, Baumann U, et al. Diagnosis of Nonalcoholic Fatty Liver Disease in Children and Adolescents. Journal of Pediatric Gastroenterology and Nutrition. 2012 May;54(5):700–13. doi: 10.1097/MPG.0b013e318252a13f. [DOI] [PubMed] [Google Scholar]
- 11.Yan E, Durazo F, Tong M, Hong K. Nonalcoholic fatty liver disease: pathogenesis, identification, progression, and management. Nutrition Reviews. 2007 Aug;65(8):376–84. doi: 10.1301/nr.2007.aug.376-384. [DOI] [PubMed] [Google Scholar]
- 12.Kumagai H, Yokoyama K, Katsuyama K, Hara S, Yamamoto H, Yamagata T, Taniguchi N, Hirota, Itoh K. A new method for measuring the speed of sound in rat liver ex vivo using an ultrasound system: correlation of sound speed with fat deposition. Ultrasound in Medical Biology. 2014;40:2499–3507. doi: 10.1016/j.ultrasmedbio.2014.03.019. [DOI] [PubMed] [Google Scholar]
- 13.Anderson ME, McKeag MS, Trahey GE. The impact of sound speed errors on medical ultrasound imaging. Journal of Acoustical Society of America. 2000;106:3540–48. doi: 10.1121/1.429422. [DOI] [PubMed] [Google Scholar]
- 14.Ghoshal G, Lavarello RJ, Kemmerer JP, Miller RJ, Oelze ML. Ex vivo study of quantitative ultrasound parameters in fatty rabbit livers. Ultrasound in Medical Biology. 2012;38:2238–48. doi: 10.1016/j.ultrasmedbio.2012.08.010. [DOI] [PMC free article] [PubMed] [Google Scholar]
- 15.Robinson DE, Ophir J, Wilson LS, Chen CF. Pulse-echo ultrasound speed measurements: progress and prospects. Ultrasound in Medical Biology. 1991;17:633–46. doi: 10.1016/0301-5629(91)90034-t. [DOI] [PubMed] [Google Scholar]
- 16.Weijers G, Starke A, Thijssen JM, Haudum A, Wohlsein P, Rehage J, de Korte CL. Transcutaneous vs. intraoperative quantitative ultrasound for staging bovine hepatic steatosis. Ultrasound in Medical Biology. 2012;38:1404–13. doi: 10.1016/j.ultrasmedbio.2012.04.009. [DOI] [PubMed] [Google Scholar]
- 17.Weijers G, Wanten G, Thijssen JM, van der Graaf M, de Korte CL. Quantitative ultrasound for staging of hepatic steatosis in patients on home parenteral nutrition validated with magnetic resonance spectroscopy: a feasibility study. Ultrasound in Medical Biology. 2016;42:637–44. doi: 10.1016/j.ultrasmedbio.2015.11.004. [DOI] [PubMed] [Google Scholar]
- 18.Lin SC, Heba E, Wolfson T, Ang B, Gamst A, Han A, Erdman JW, Jr, O’Brien WD, Jr, Andre MP, Sirlin CB, Loomba R. Noninvasive diagnosis of nonalcoholic fatty liver disease and quantification of liver fat using a new quantitative ultrasound technique. Clinical Gastroenterology and Hepatology. 2015;13:1337–45. doi: 10.1016/j.cgh.2014.11.027. [DOI] [PMC free article] [PubMed] [Google Scholar]
- 19.Wagner RF, Smith SW, Sandrik JM, Lopez H. Statistics of Speckle in Ultrasound B-Scans. IEEE Transactions on Sonics and Ultrasonics. 1983;30(3):156–163. [Google Scholar]
- 20.Allam ME, Greenleaf JF. Phase aberration correction for ultrasound imaging in temporal-spatial frequency domain. Icassp. 1995:2315–2318. [Google Scholar]


