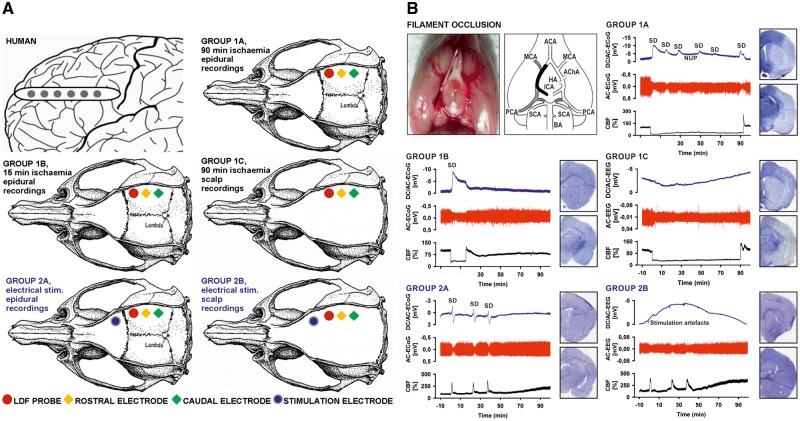
Figure 1.
Experimental set-ups and paradigms. (A) The top left panel shows a schematic of a single, linear, six-contact (platinum/iridium) ECoG recording strip placed on human cortex. The other five panels show the animal experimental set-ups, which are further explained in the Supplementary material. (B) The top left panel explains the intraluminal filament occlusion. After head surgery and placement of laser-Doppler flowmetry probe and electrodes, the filament was later advanced during the experiment until the laser-Doppler flowmetry probe indicated adequate MCAO by a sharp decrease in CBF. After either 15 min (Group 1B) or 90 min (Groups 1A and 1C) of occlusion the filament was gently withdrawn and the reperfusion was monitored. ACA = anterior cerebral artery; AChA = anterior choroidal artery; BA = basilar artery; CCA = common carotid artery; HA = hypothalamic artery; ICA = internal carotid artery; PCA = posterior cerebral artery; SCA = superior cerebellar artery. In the other five panels, representative example traces and histological outcomes of the animal-experimental groups are shown. Infarcts are macroscopically identified as pale areas using haematoxylin staining (cf. right hemispheres in Groups 1A and 1C). SDs are observed as slow potential changes in the DC/AC-ECoG (bandpass: 0–45 Hz) and depression of activity in the AC-ECoG (bandpass: 0.5–45 Hz) (Dreier et al., 2017). Whereas the first SD initiated the NUP in Group 1A, subsequent SDs typically occurred superimposed on the NUP. In the two control Groups 2A and 2B, no filament occlusion was performed but three SDs were electrically triggered at the same time intervals as measured on average in Group 1A between first, second and third SD during filament occlusion (second SD: 20.6 ± 14.9 min, third SD: 36.0 ± 15.8 min). Also in the scalp EEG recordings of Groups 1C and 2B, DC drifts were seen, as exemplified in the figure, but they were not consistent within or between the groups and may thus represent complex summary potentials of different generators. For example, changes in sympathetic tone can produce scalp DC-EEG drifts through activation/deactivation of cutaneous sweat glands. Additional contributors could be DC potential deflections generated at the blood–brain barrier, e.g. by changes in partial pressures of CO2 or O2 (Lehmenkühler et al., 1999; Voipio et al., 2003).

