

Abstract
Background
This study developed, validated, and disseminated a generalizable informatics algorithm for detecting breast cancer recurrence and timing using a gold standard measure of recurrence coupled with data derived from a readily available common data model that pools health insurance claims and electronic health records data.
Methods
The algorithm has two parts: to detect the presence of recurrence and to estimate the timing of recurrence. The primary data source was the Cancer Research Network Virtual Data Warehouse (VDW). Sixteen potential indicators of recurrence were considered for model development. The final recurrence detection and timing models were determined, respectively, by maximizing the area under the ROC curve (AUROC) and minimizing average absolute error. Detection and timing algorithms were validated using VDW data in comparison with a gold standard recurrence capture from a third site in which recurrences were validated through chart review. Performance of this algorithm, stratified by stage at diagnosis, was compared with other published algorithms. All statistical tests were two-sided.
Results
Detection model AUROCs were 0.939 (95% confidence interval [CI] = 0.917 to 0.955) in the training data set (n = 3370) and 0.956 (95% CI = 0.944 to 0.971) and 0.900 (95% CI = 0.872 to 0.928), respectively, in the two validation data sets (n = 3370 and 3961, respectively). Timing models yielded average absolute prediction errors of 12.6% (95% CI = 10.5% to 14.5%) in the training data and 11.7% (95% CI = 9.9% to 13.5%) and 10.8% (95% CI = 9.6% to 12.2%) in the validation data sets, respectively, and were statistically significantly lower by 12.6% (95% CI = 8.8% to 16.5%, P < .001) than those estimated using previously reported timing algorithms. Similar covariates were included in both detection and timing algorithms but differed substantially from previous studies.
Conclusions
Valid and reliable detection of recurrence using data derived from electronic medical records and insurance claims is feasible. These tools will enable extensive, novel research on quality, effectiveness, and outcomes for breast cancer patients and those who develop recurrence.
In contrast to newly diagnosed breast cancer (BC), little is known about the treatment and outcomes of recurrent BC in community-based settings. While nearly all BC deaths are attributable to metastatic disease, recent estimates suggest that less than 30% of incident BC cases are diagnosed at an advanced stage (1,2), suggesting that the majority of BC mortality is caused by metastatic disease that develops after treatment for earlier-stage disease. Care of patients with recurrent breast cancer might differ from that of patients with advanced disease at diagnosis. In contrast to patients with newly diagnosed stage IV breast cancer, those with a recurrence have been previously treated with surgery, chemotherapy, and/or radiotherapy and may be ineligible for or relatively resistant to specific treatment modalities. Therefore, their treatment patterns and costs may differ substantially (2). They may have comorbid conditions resulting from their prior disease and treatment, the location and extent of their disease may differ from patients with de novo advanced disease, and finally, the experience of having recurrent disease after an attempt at curative therapy may lead to a shift in patients’ treatment goals and values (3).
In addition, assessing the effectiveness and value of new, costly therapies among community-based patients with metastatic disease is critically important, especially considering that patterns of care and costs vary substantially across patients with metastatic BC (4–7). Unfortunately, most population-based data sets (including the Surveillance, Epidemiology, and End Results [SEER] and state-based tumor registries) cannot identify recurrent cancers, limiting our current knowledge to patients with advanced disease at diagnosis (8,9). While statistical estimates of the prevalence of women experiencing a recurrence now exist, accurate identification of individual patients with recurrent BC would allow for innovative and rigorous research on treatments, outcomes, and costs for this common, costly, and lethal condition (2).
Recognizing the importance of cancer recurrence as a critical outcome, several studies, including those from investigators from the Cancer Research Network (CRN), have developed programming rules, text-mining techniques, and algorithms for detecting BC recurrence, or, more frequently, second BC events (SBCEs) (10–17). These studies have varied with respect to cohort specification criteria, for example, patient age, stage of incident diagnosis, receipt of specific first-course treatment (11,13,14,16), lag time between end of definitive treatment and observation of new events (11,13), use of manual chart abstraction (16), operational definitions of recurrence (10,13), and inclusion of a gold standard measure of recurrence (18–20). Only Chubak and colleagues estimated the timing of detected events and conducted external validity analyses; but their focus in creating the BRAVA algorithms was on identifying any SBCE, including new primaries, local recurrences, and distant recurrences (11,12). Outside the CRN, other large data sets have been used to identify metastatic BC, but efforts have failed to differentiate between recurrent vs newly diagnosed stage IV disease (8,17,19). We contend that the care provided to and outcomes experienced by these patient groups may differ. Further, most cancer event detection algorithms employ structured data, clinical notes from electronic health records (EHRs) (11–14), or administrative claims (17–20), so uncertainty exists as to whether or not these algorithms could be implemented using data derived from multiple sources.
Our goal was to develop an algorithm that detects and determines the timing of recurrent BC using an “open-sourced” common data model consistent with 1) the Virtual Data Warehouse (VDW) that was originally established by the NCI-funded CRN (21,22); 2) the US Food and Drug Administration (FDA)–funded Mini-Sentinel Common Data Model (23); and 3) the Patient Centered Outcomes Research Institute–funded PCORnet Common Data Model (24). These data models are characterized by common data structures, variable definitions, and formats. We also wanted to leverage the methods and innovations developed during the creation of our lung and colorectal cancer recurrence detection and timing algorithms (25), which have been implemented and validated using both the VDW and SEER-Medicare data models. Our focus was not on detecting incident disease or SBCEs, but rather on detecting BC recurrence and determining its timing using methods agnostic with respect to the source of the legacy data.
Methods
Data Sources
Our primary data source was the CRN’s (http://crn.cancer.gov/) VDW (21,22). The CRN is a National Cancer Institute (NCI)–funded initiative that supports cancer research based in nonprofit integrated health care delivery settings (26). The VDW is populated with patient-level data extracted from electronic health records, administrative/claims, and tumor registries (TRs). Three CRN sites—the Kaiser Permanente regions of Colorado (KPCO), Northwest (KPNW), and Northern California (KPNC)—contributed data to this study. KPCO and KPNW data were used for model development and internal validation. KPNC data from the Pathways Study (27,28) were used for external validation. The Pathways Study is an ongoing prospective NCI-funded cohort study of women diagnosed with invasive BC that is conducting detailed chart review to ascertain recurrence status. Institutional review boards from the participating CRN sites and Dana-Farber/Harvard Cancer Center approved this study.
Study Cohort and Recurrence Status
All patients were diagnosed with stage I–III BC at age 21 years or older. Similar to a previous study (25), we used TR data at the three sites to identify patients who 1) had no previous cancer; 2) completed definitive local-regional therapy for their incident BC; and 3) survived and were followed for at least 30 days after definitive therapy. Censoring occurred if the TR identified a second primary cancer because codes generated from these events could have suggested recurrence. All patients were diagnosed between January 1, 2000, and December 31, 2011, and followed through death, disenrollment, or study end date (December 31, 2012). Gold standard recurrence and date of first recurrence were obtained by manual chart review, performed by trained abstractors (25,29), at all three sites. Categorization of recurrence, including distant vs nondistant site, was derived from TR data using North American Association of Central Cancer Registries (NAACCR) items 1880 and 1860 (30,31). Unfortunately, our data sources did not capture sequential or multiple recurrent (loco-regional to distant) events for the same patient. Patients noted as “never disease free” (NAACCR item 1861) were excluded from the study.
Potential Indicators of Recurrence
Potential indicators of recurrence included standardized diagnosis, procedure, and pharmacy codes associated with secondary malignant neoplasm (SMN), chemotherapy, radiation therapy, hormonal therapy, breast conserving surgery, mastectomy, laboratory tests for tumor markers (CEA, CA-15-3, CA-27-29), hospice care, advanced imaging, hospital encounters (admission, observation, or emergency department), any medical or surgical procedure, symptom of cancer, pain, and stage and follow-up time (see Supplementary Table 1, available online). These codes were identified from our previous research (29), our clinical experience, and studies conducted by others (12,13,15,19,32,33); they represented several commonly used data standards (ICD-9-CM, ICD-10, CPT-4, HCPCS, NDC, and DRGs). Codes and their corresponding event dates were extracted from the VDW procedure, diagnosis, encounter, pharmacy, and infusion files (21,22).
Statistical Analysis
Algorithm Development and Evaluation
Details of the RECUR algorithm development and evaluation methods have been described previously (25). Briefly, we divided our detection algorithm into two phases: Phase 1 assigns a probability of recurrence in a given time period to each patient, and phase 2 assigns a date of recurrence among patients classified as having had recurrence by phase I. We divided the development and testing of the phase I and II RECUR-BC algorithms into three steps: 1) training, 2) internal validation, and 3) external validation via dissemination of the algorithm SAS program to KPNC for use with the Pathways cohort (27). Data from two health systems (KPCO and KPNW) were combined and then randomly split into two equally sized subsets, so half could be used for training and the other half for internal validation. The proportion of patients from each site, the years of diagnosis, and the duration of follow-up were balanced across these subsets.
For phase I, we first assessed the bivariate association between each candidate indicator and recurrence (Supplementary Table 2, available online). A strong association between having an SMN ICD9-CM code and recurrence was observed, so we identified the threshold count of SMN codes above which the probability of recurrence was 100%. Among remaining patients, we developed a multivariable logistic regression model to differentiate between those who did vs did not have recurrence. We used the least absolute shrinkage and selection operator (LASSO) regularized method (34) to derive the model in order to avoid selection of an overfitting model. The best and most accurate phase I model was considered the one that maximized the area under the receiver operating characteristics curve (AUROC). When multiple models yielded AUROC values that were almost identical, we selected the model with the fewest indicator covariates to enhance user efficacy and ease of implementation. To classify each patient as having recurrence or not, a threshold probability value was identified. Acknowledging that different threshold probabilities would yield different sensitivities and specificities, we highlighted the two threshold probabilities that maximized accuracy (35) and the Youden-Index (sensitivity+specificity-1) (32). For these two threshold probabilities, we reported the sensitivity, specificity, and positive and negative predictive values (PPV and NPV, respectively) for the development, internal validation, and external validation data sets (see the Supplementary Methods, available online) (33,36).
The phase II algorithm, which determined the timing of recurrence among patients who recurred according to the gold standard, was developed consistent with methods previously described (25). Our goal was to identify the algorithm that minimized the absolute detection error (AE), defined as the mean of the absolute difference between the predicted and actual recurrence dates across all true positives. Consistent with Figure 1, and as described in detail in our Supplementary Methods (available online), we first extracted the estimated time of recurrence from each of the administrative code groups for each patient by identifying when the code count peaked and deriving an adjustment factor to account for systematic differences between the peak time and code counts and the true recurrence time. As with phase I, we developed a range of candidate models, calculated Monte-Carlo cross-validation estimates of the AEs, and selected a final model based on parsimony from among the candidates that offered similarly high performance using half of the KPCO/KPNW cohort. The correct classification rate (CCR) was calculated to measure overall algorithm performance.
Figure 1.
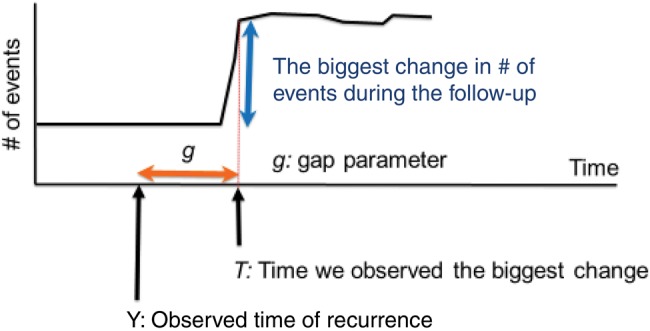
Phase II timing algorithm: trajectory of events and predicted time of recurrence. The chart shows an example of the trajectory of the number of events in one patient. Y on the x-axis denotes the time of the true recurrence we would like to identify. T indicates the time point where we observe the biggest change in the trajectory of the number of events during the follow-up. Note that both Y and T are observable in the gold standard data, which allows us to estimate the gap parameter “g” that indicates the difference between Y and T. Let g* be an estimate for the “g” parameter. The predicted time of recurrence, Y*, is then given by T-g*.
Algorithm Validation and Comparative Efficiency
In addition to dissemination of phases I and II of the algorithm SAS code to KPNC for external validation with the Pathways data, we compared the relative efficiency and accuracy of our phase II algorithm with the SBCE BRAVA algorithm (11). Using KPCO and KPNW data from 208 patients identified as having gold standard recurrence and classified as having recurrence by the BRAVA algorithm, we compared the mean and standardized mean AEs derived from the two algorithms using the paired nonparametric Wilcoxon test. Statistical analyses were conducted using SAS version 9.2 (SAS Institute Inc., Cary, NC), Stata version 13.1 (StataCorp LP, College Station, TX), and R version 3.0 (R Foundation for Statistical Computing, Vienna, Austria). All tests of statistical significance were two-sided. A two-sided P value of less than .05 was considered statistically significant.
Results
Phase I
The patient, tumor, and data characteristics associated with the KPCO/KPNW training (n = 3370) and test (n = 3370) data sets and the KPNC test (n = 3961) data set are described in Table 1. Stage at primary diagnosis and type of recurrence were similar across all data sets. Consistent with its longer median follow-up, 7.6% of the KPNC test cohort was identified has having a recurrence (vs 7.2% in KPCO/KPNW) during the observation period. Because of differences in local coding practices, the proportion of patients with two or more mastectomy procedure codes was greater in KPNC compared with KPCO/KPNW (Table 1).
Table 1.
Patient characteristics and the distribution of indicators of recurrence for the training data set and two independent test data sets
| Patient characteristics | KPCO/KPNW training data | KPCO/KPNW independent test data | KPNC independent test data |
|---|---|---|---|
| No. (%) | No. (%) | No. (%) | |
| Cohort assembly | |||
| Eligible patients | 3370 | 3370 | 3961 |
| Recurrences | 241 (7.2) | 242 (7.2) | 300 (7.6) |
| Median follow-up* (range), mo | 52 (1–155) | 53 (1–156) | 75 (1–112) |
| Patient characteristics | |||
| Age ≥ 65 y | 1230 (36.5) | 1185 (35.2) | 1324 (33.4) |
| Nonwhite | 514 (152) | 559 (16.5) | 1138 (28.7) |
| Stage at diagnosis | |||
| I | 1875 (55.6) | 1957 (58.1) | 2256 (57.0) |
| II | 1175 (34.9) | 1107 (32.8) | 1350 (34.1) |
| III | 320 (9.5) | 306 (9.1) | 375 (9.5) |
| Type of recurrence† | |||
| Local or regional | 75 (31.1) | 76 (31.4) | 93 (31.0) |
| Distant | 166 (68.9) | 166 (68.6) | 207 (69.0) |
| Indicators of recurrence‡ | |||
| No. of secondary malignancy neoplasm excluding lymph node diagnosis codes | |||
| 0 | 3141 (93.2) | 3152 (93.5) | 3685 (93.0) |
| 1 | 44 (1.3) | 42 (1.2) | 35 (0.9) |
| 2+ | 185 (5.5) | 176 (5.3) | 241 (6.1) |
| No. of chemotherapy codes§ | |||
| 0 | 2652 (78.7) | 2657 (78.8) | 3102 (78.3) |
| 1+ | 718 (21.3) | 713 (21.2) | 859 (21.7) |
| No. of radiation therapy codes§ | |||
| 0 | 2991 (88.8) | 2975 (88.3) | 3702 (93.5) |
| 1+ | 379 (11.1) | 395 (11.7) | 259 (6.5) |
| No. of mastectomy codes‖ | |||
| 0–1 | 2986 (88.6) | 2946 (87.4) | 2694 (68.0) |
| 2+ | 384 (11.4) | 424 (12.6) | 1267 (32.0)‖ |
| No. of hospice codes | |||
| 0 | 3220 (95.5) | 3206 (95.1) | 3803 (96.1) |
| 1+ | 150 (4.5) | 164 (4.9) | 158 (3.9) |
| Advanced imaging¶, mean per year (SD) | 0.91 (1.49) | 0.91 (1.39) | 0.32 (0.32) |
| Observation, mean per year (SD) | 0.05 (0.29) | 0.05 (0.21) | 0.01 (0.06) |
From date of definitive local therapy to the earlier of study end date (December 31, 2012), date of death, date of disenrollment, or date of secondary primary cancer diagnosis. KPCO = Kaiser Permanente Colorado; KPNC = Kaiser Permanente Northern California; KPNW = Kaiser Permanente Northwest.
Percentage calculated among patients with recurrence.
Indicators of recurrence represent the categorized count of codes occurring after definitive therapy and before the end of follow-up, or the mean number of days with the indicator per year of follow-up.
Chemotherapy, radiation therapy, and mastectomy events occurring within 12 months after the initial breast cancer diagnosis were excluded when deriving indicators of recurrence because they were considered therapy for the primary cancer.
The proportion of KPNC patients with 2+ mastectomy codes was greater than the proportion of KPCO or KPNW patients because of differences in local coding practices. Specifically, KPNW often records both an ICD-9 and a CPT code for mastectomy on each encounter. If one of these two mastectomy codes were removed from the encounter, the proportion of KPNC patients with 2+ mastectomy codes would have been 13%—in line with KPCO and KPNW. We did not adjust the KPNC data because they reflect real-world differences in coding practices/system-level organization of care and represent the spectrum of data available from the real world.
Advanced imaging includes all encounters/events associated with magnetic resonance imaging, computed tomography scans, and nuclear medicine imaging such as positron emission tomography.
Variable specifications and odds ratios associated with the best performing RECUR-BC phase I model are reported in Figure 2. This model incorporated six of the 16 candidate indicators: SMN diagnosis codes, chemotherapy, radiation therapy, hospice care, mastectomy, and advanced imaging. Patients with more than 34 SMN-coded events were assigned 100% probability of recurrence (51 patients). For the 3319 patients with 0 to 34 SMN codes, a model distinguished between those with and without recurrence. In the training data set, this model yielded an AUROC of 0.939 (95% confidence interval [CI] = 0.917 to 0.955). Performance in the independent KPCO/KPNW and KPNC validation data sets was similar, with AUROCs of 0.956 (95% CI = 0.944 to 0.971) and 0.900 (95% CI = 0.872 to 0.928), respectively (Table 2). The probability cutoffs that maximized accuracy and the Youden Index were 34.1% and 9.6%, respectively. Applying the probability cutoff that maximized accuracy to the two independent data sets, the sensitivities were 69.8% and 74.7%, and the specificities were 99.3% and 99.1% for KPCO/KPNW and KPNC, respectively. PPVs were 88.9% using the KPCO/KPNW data set and 86.8% using the KPNC data set. The NPVs were 97.7% and 97.9%, respectively. Corresponding statistics when applying the probability cutoff that maximized the Youden index are shown in Table 2. Specifically, the sensitivities were higher: 79.8% and 80.0% for KPCO/KPNW and KPNC, respectively.
Figure 2.

HMO–Cancer Research Network Virtual Data Warehouse breast cancer RECUR algorithm. This figure shows components of the phase I and II breast cancer RECUR algorithm. For the phase I algorithm, there are two stages. First, we identified patients who had more than 34 secondary malignant neoplasm codes and classified these patients as having recurrence. Then, for the remaining patients, we created a logistic regression model that generated a probability of having recurrence. The figure lists each of the variables contributing to the logistic regression model with their categories, and the corresponding odds ratios with their 95% confidence intervals. The secondary malignancy codes included ICD-9 codes for 197.x–198.x, but not 196.x (lymph node metastases). For the phase I logistic regression model, the probability threshold that maximized accuracy was 34.2%, and the probability threshold that maximized the Youden index was 9.6%. The phase II algorithm estimates the timing of the recurrence event. Each variable in the timing estimation algorithm is listed with its offset (the average of the difference between the time when the component variable count peaked and the time of the gold standard recurrence) and weight (the amount a component variable’s estimated recurrence date contributed to final estimated date of recurrence). CI = confidence interval; OR = odds ratio.
Table 2.
RECUR algorithm performance in two independent test data sets compared with the training data set*
| Performance measures | Training data |
Independent test data |
|||||
|---|---|---|---|---|---|---|---|
| KPCO/KPNW | KPCO/KPNW | KPNC | |||||
| Phase I (recurrence status) | |||||||
| AUROC (95% CI) | 0.939 (0.917 to 0.955) | 0.956 (0.944 to 0.971) | 0.900 (0.872 to 0.928) | ||||
| Performance | To maximize accuracy | To maximize Youden index | To maximize accuracy | To maximize Youden index | To maximize accuracy | To maximize Youden index | |
| Participant counts | |||||||
| True positives | 171 | 194 | 169 | 193 | 224 | 240 | |
| False negatives | 70 | 47 | 73 | 49 | 76 | 60 | |
| False positives | 17 | 83 | 21 | 91 | 34 | 126 | |
| True negatives | 3112 | 3046 | 3107 | 3037 | 3627 | 3535 | |
| Sensitivity (95% CI), % | 71.0 | 80.5 | 69.8 | 79.8 | 74.7 | 80.0 | |
| (66.4 to 80.2) | (77.5 to 87.1) | (64.1 to 75.6) | (74.7 to 84.8) | (69.7 to 79.6) | (75.5 to 84.5) | ||
| Specificity (95% CI), % | 99.5 | 97.3 | 99.3 | 97.1 | 99.1 | 96.6 | |
| (98.9 to 99.6) | (91.9 to 98.1) | (99.0 to 99.6) | (96.5 to 97.7) | (98.8 to 99.4) | (96.0 to 97.1) | ||
| Positive predictive value (95% CI), % | 91.0 | 70.0 | 88.9 | 68.0 | 86.8 | 65.6 | |
| (84.0 to 93.1) | (44.2 to 77.7) | (84.5 to 93.4) | (62.5 to 73.4) | (82.7 to 90.9) | (60.7 to 70.4) | ||
| Negative predictive value (95% CI), % | 97.8 | 98.5 | 97.7 | 98.4 | 97.9 | 98.3 | |
| (97.5 to 98.4) | (98.2 to 99.0) | (97.2 to 98.2) | (98.0 to 98.9) | (97.5 to 98.4) | (97.9 to 98.8) | ||
| Phase II (timing of recurrence)* | |||||||
| Absolute error, mo | |||||||
| Median (95% CI) | 2.1 (1.9 to 2.8) | 2.1 (1.9 to 2.9) | 2.9 (2.2 to 4.2) | 2.7 (2.2 to 4.0) | 4.2 (3.6 to 4.8) | 4.2 (3.6 to 4.9) | |
| Mean (95% CI) | 6.6 (5.1 to 7.9) | 6.6 (5.2 to 8.0) | 5.7 (4.7 to 6.8) | 6.0 (4.9 to 7.3) | 6.0 (5.2 to 6.9) | 6.3 (5.4 to 7.3) | |
| Mean standardized error (95% CI), % | 12.6 | 12.5 | 11.7 | 11.9 | 10.8 | 11.1 | |
| (10.5 to 14.5) | (10.7 to 14.5) | (9.9 to 13.5) | (10.2 to 13.7) | (9.6 to 12.2) | (9.8 to 12.4) | ||
| Correct classification rate [cumulative No.] (95% CI), % | |||||||
| ±1 mo | 23.4 [40] | 22.2 [43] | 20.1 [34] | 21.2 [41] | 14.3 [32] | 14.6 [35] | |
| (17.0 to 30.0) | (16.2 to 28.0) | (14.2 to 26.1) | (15.5 to 27.0) | (10.0 to 18.9) | (10.2 to 19.2) | ||
| ±2 mo | 46.2 [79] | 45.4 [88] | 39.1 [66] | 39.4 [76] | 29.0 [65] | 28.8 [69] | |
| (38.1 to 53.2) | (38.3 to 52.4) | (31.1 to 46.4) | (32.3 to 46.2) | (23.4 to 35.0) | (23.2 to 34.5) | ||
| ±3 mo | 60.8 [104] | 59.8 [116] | 50.3 [ 85] | 51.3 [99] | 37.1 [83] | 36.7 [88] | |
| (53.6 to 67.9) | (52.8 to 66.7) | (42.9 to 57.9) | (44.1 to 58.2) | (30.9 to 43.0) | (30.8 to 42.6) | ||
| ±4 mo | 61.4 [105] | 60.8 [118] | 55.6 [ 94] | 57.0 [110] | 47.3 [106] | 47.5 [114] | |
| (54.9 to 68.9) | (53.6 to 67.4) | (47.9 to 63.1) | (49.9 to 64.3) | (40.6 to 53.4) | (41.2 to 53.5) | ||
| ±5 mo | 64.3 [110] | 65.0 [126] | 66.3 [ 112] | 66.8 [129] | 57.1 [128] | 56.7 [136] | |
| (57.8 to 71.8) | (58.4 to 71.3) | (58.4 to 73.6) | (59.7 to 73.7) | (50.9 to 63.5) | (50.4 to 63.0) | ||
| ±6 mo | 67.3 [115] | 67.5 [131] | 68.6 [116] | 69.4 [134] | 64.7 [145] | 64.6 [155] | |
| (61.0 to 74.8) | (61.2 to 74.0) | (61.1 to 75.5) | (62.4 to 75.9) | (58.5 to 70.8) | (58.2 to 70.5) | ||
| Error > 6 mo | 32.8 [56] | 32.5 [63] | 31.4 [53] | 30.6 [59] | 35.3 [79] | 35.4 [85] | |
| (25.2 to 39.0) | (26.0 to 38.8) | (24.5 to 38.9) | (24.1 to 37.6) | (29.2 to 41.5) | (29.5 to 41.8) | ||
Estimates derived from patients classified as having recurred by the phase I algorithm (ie, true positives). CI = confidence interval; KPCO = Kaiser Permanente Colorado; KPNC = Kaiser Permanente Northern California; KPNW = Kaiser Permanente Northwest.
Phase II
Five of the six phase I indicator variables were used in the RECUR-BC phase II timing model. Hospital observation events were added, and imaging events were dropped. Figure 2 describes both the offset month adjustment and the component weight for each indicator variable. The phase II timing models yielded average absolute prediction errors of 12.6% (95% CI = 10.5% to 14.5%) in the KPCO/KPNW training data and 11.7% (95% CI = 9.9% to 13.5%) and 10.8% (95% CI = 9.6% to 12.2%) in the KPCO/KPNW and KPNC validation data sets, respectfully. The proportions of recurrences whose time intervals were correctly classified within six months were 67.3% in the training data set and 68.6% and 64.7% in the two independent validation data sets (Table 2).
For a given threshold probability to detect recurrence in phase I, sensitivity and PPV increased with higher stage, while specificity and NPV remained high (≥93%) (Supplementary Table 3, available online). Similarly, the phase II timing algorithm performed worse for stage I vs stages II and III (Table 3). The overall algorithm performance was robust in sensitivity analyses excluding patients with secondary primary cancer (AUROC = 0.960 for phase I, 68.9% correctly classified within six months for phase II).
Table 3.
Comparison of recurrence timing estimates using the RECUR phase II and BRAVA algorithms among 208* patients with recurrence from the KPCO and KPNW independent test data sets
| Stage at diagnosis | RECUR phase II timing algorithm | BRAVA timing algorithm |
|---|---|---|
| All stages (n = 208) | ||
| Absolute error | ||
| Median, mo | 3.3 | 7.2 |
| Mean, mo | 6.9† | 11.3 |
| Standardized error, % | 12.3‡ | 24.9 |
| Correct classification rate (cumulative No.), % | ||
| ±1 mo | 19.7 (41) | 10.1 (21) |
| ±2 mo | 35.6 (74) | 25.5 (53) |
| ±3 mo | 47.6 (99) | 32.7 (68) |
| ±4 mo | 54.3 (113) | 38.5 (80) |
| ±5 mo | 64.4 (134) | 42.3 (88) |
| ±6 mo | 67.3 (140) | 46.6 (97) |
| Error >6 mo | 32.7 (68) | 53.4 (111) |
| Stage I (n = 52) | ||
| Absolute error | ||
| Median, mo | 4.3 | 2.7 |
| Mean, mo | 10.7 | 8.9 |
| Standardized error, % | 12.2 | 13.7 |
| Correct classification rate (cumulative No.), % | ||
| ±1 mo | 17.3 (9) | 9.6 (5) |
| ±2 mo | 36.5 (19) | 42.3 (22) |
| ±3 mo | 42.3 (22) | 51.9 (27) |
| ±4 mo | 48.1 (25) | 57.7 (30) |
| ±5 mo | 51.9 (27) | 59.6 (31) |
| ±6 mo | 55.8 (29) | 61.5 (32) |
| Error >6 mo | 44.2 (23) | 38.5 (20) |
| Stage II (n = 84) | ||
| Absolute error | ||
| Median, mo | 2.8 | 8.1 |
| Mean, mo | 6.2 | 11.7 |
| Standardized error, % | 11.9 | 23.7 |
| Correct classification rate (cumulative No.), % | ||
| ±1 mo | 17.9 (15) | 10.7 (9) |
| ±2 mo | 35.7 (30) | 17.9 (15) |
| ±3 mo | 51.2 (43) | 26.2 (22) |
| ±4 mo | 56.0 (47) | 32.1 (27) |
| ±5 mo | 71.4 (60) | 36.9 (31) |
| ±6 mo | 72.6 (61) | 42.9 (36) |
| Error >6 mo | 27.4 (23) | 57.1 (48) |
| Stage III (n = 72) | ||
| Absolute error | ||
| Median, mo | 3.2 | 8.5 |
| Mean, mo | 5.0 | 12.9 |
| Standardized error, % | 12.7 | 34.5 |
| Correct classification rate (cumulative No.), % | ||
| ±1 mo | 23.6 (17) | 9.7 (7) |
| ±2 mo | 34.7 (25) | 22.2 (16) |
| ±3 mo | 47.2 (34) | 26.4 (19) |
| ±4 mo | 56.9 (41) | 31.9 (23) |
| ±5 mo | 65.3 (47) | 36.1 (26) |
| ±6 mo | 69.4 (50) | 40.3 (29) |
| Error >6 mo | 30.6 (22) | 59.7 (43) |
Two hundred and eight of 242 patients with “gold standard” recurrence were classified by BRAVA Figure 5 (“High specificity and high positive predictive value algorithm for a second breast cancer event [no Surveillance, Epidemiology, and End Results variables]”) as having a secondary breast cancer event (SBCE) and thus had an estimated timing of SBCE from the BRAVA algorithm. KPCO = Kaiser Permanente Colorado; KPNW = Kaiser Permanente Northwest.
Difference between RECUR and BRAVA methods = 4.4 (95% confidence interval [CI] = 2.1 to 6.5). Two-sided Wilcoxon test P < .001.
Difference between RECUR and BRAVA methods = 12.6% (95% CI = 8.8% to 16.5%). Two-sided Wilcoxon test P < .001.
Positive differences indicate that performance was better for the RECUR phase II timing algorithm compared with the BRAVA timing algorithm.
Comparisons of recurrence timing using the RECUR-BC phase II relative to BRAVA algorithms are described in Table 3 and Supplementary Figure 2 (available online). Overall, the median absolute errors for the RECUR-BC and BRAVA algorithms were 3.3 and 7.2 months, respectively. The difference in the mean absolute error was 4.4 months (95% CI = 2.3 to 6.5, P < .001; RECUR-BC = 6.9 months vs BRAVA = 11.3 months), and the difference in the mean absolute error standardized by follow-up was 12.6% (95% CI = 8.8% to 16.5%, P < .001; RECUR-BC = 12.3%, BRAVA = 24.9%). Stratified by stage at diagnosis (Supplementary Table 3, available online), the RECUR-BC model performed better in stage II and III patients, but not stage I patients.
Discussion
We developed a BC recurrence detection and timing algorithm that relies on standardized codes available in an open-source common data model that is currently being used by a number of collaborative research groups and networks (37–40). In contrast to other published cancer outcome detection algorithms (11,12,16,20), our algorithms were parameterized using gold standard–certified tumor registrar chart-abstracted data based on NAACCR-specified recurrence variables. Importantly, implementation of the algorithm only relies on tumor registry data for the purpose of identifying incident cancer diagnosis. Rather than providing a deterministic characterization of recurrence status for each patient (yes vs no), we used logistic regression models to generate a smooth continuous probability of having recurrence for each patient. With this approach, we can explicitly describe how changes in model covariates affect probability estimates, and we can easily compare the impact of specific covariates across data sets and cancer types. Rather than simply evaluating the performance of an a priori rule for classifying patients as recurrent or not, as earlier studies have done (11,12,16,20), we took a data-driven approach, assessing the value of a wide range of available diagnosis and procedure codes, and tens of thousands of potential combinations of these variables.
We chose a unique performance metric for our phase I detection algorithm—the AUROC—which was estimated to be 0.90 or more in all validation data sets. Recognizing that no rule will be perfectly sensitive and specific, our goal was to determine the probability of each patient having recurred rather than to classify patients into dichotomous categories. Using the recurrence probability cutoff point of 0.096, the estimated sensitivity of the RECUR-BC algorithm was lower than some previously reported models (8,11,12,16), but the specificity, NPV, and PPV were highly comparable. That said, a key advantage of the RECUR-BC algorithm is the ability to vary the recurrence probability threshold used to classify patients as with or without recurrence in order to maximize the metric (AUROC, sensitivity, specificity, etc.) that best aligns with the research question at hand. For example, if a researcher wanted high sensitivity (ie, 0.95) in a cohort of early-stage BC survivors for a comparative effectiveness research study, then one would set the threshold value for the detection algorithm to 0.0104 (Supplementary Material, available online). Conversely, if the research question required maximizing specificity, then the cohort of recurrent cases could be selected using a threshold of 0.096.
In addition to developing recurrence detection and timing algorithms, we also developed standardized programming code that uses variables specified under the VDW or CDM model (see Supplementary Algorithm Implementation in the Supplementary Materials, available online) (22) and demonstrated that these tools can be applied by other investigators from other sites using similarly structured data. For example, we used these tools to conduct validation of the RECUR-BC detection and timing algorithms with data from the Pathways Study. With respect to recurrence detection in the KPNC external validation data set, which was derived from a patient population similar to that used in a previous algorithm validation study (16), we generated recurrence detection statistics (Table 2) that were at least comparable with the validation performance statistics that were reported by Kroenke et al. (eg, a sensitivity of 76.7 and specificity of 85.6 for algorithm 10) (16) that were derived using the BRAVA (11) detection algorithm. With respect to recurrence timing, the RECUR-BC algorithm generated favorable performance statistics compared with the BRAVA timing algorithm.
Our study highlights a number of challenges inherent to detecting clinical events, such as recurrence, using structured data. First, data limitations, coupled with the complicated natural history of patients with BC recurrence, inhibited our ability to discriminate between a local/regional and a distal recurrence. Second, overlap occurs with the codes that appear at the time of recurrence and those that occur during a patient’s initial cancer care (eg, adjuvant chemotherapy, regional lymph node involvement). To avoid the chance that codes associated with the initial diagnosis would be construed as indicative of recurrence, we excluded treatment codes if they occurred within 12 months after the index diagnosis. This “blackout” period was based on a review of the adjuvant therapy events for a subset of the patients. Third, consistent with our prior study (25), using only one or two code types (eg, secondary malignancy and chemotherapy) was insufficient to identify a majority of patients with recurrent disease. We expanded the set of recurrence indicators beyond these two codes, and the final model included radiation therapy, high-cost imaging, surgical procedures, and hospice. Fourth, we discovered that the types of codes that were most informative for assessing the probability of recurrence only partially overlap with those optimal for determining the timing of recurrence. We employed a two-phase algorithm that first assigned a probability of recurrence and then identified the date of recurrence based on cumulative events, rather than assuming that a single event (eg, rule-out procedure) could be used to estimate recurrence timing. Lastly, our observation period (up to 12 years) limited our ability to detect many late recurrences.
While the RECUR-BC algorithm was developed, validated, and compared with alternative algorithms using CRN VDW data, we previously developed and validated RECUR algorithms for lung and colorectal cancer using both CRN-VDW and SEER-Medicare data, and we are currently studying the utility of the RECUR-BC algorithm in SEER-Medicare data as well (41). This limitation notwithstanding, the underlying data structure required for broader dissemination of the RECUR algorithm is very commonplace and relies on standard data elements that can be derived using various data sources (EHR vs claims) (23,24,42).
Given the large demand for valid, population-based measures of cancer outcomes from professional, governmental, and research entities, robust recurrence detection algorithms represent an important advance. To foster adoption of the RECUR algorithms, we have created extensible documentation and code for the VDW platform (see the Supplementary Algorithm Implementation in the Supplementary Materials, available online) and are working to translate the RECUR algorithms into a set of query tools for use via PopMedNet—an open-source distributed querying software application used by more than nine large, multisite initiatives to facilitate research) (43–45). PopMedNet is only one example of many “big data” initiatives striving to combine information from multiple sources to create broader and deeper platforms for discovery. These advances are essential because single-source data sets do not encompass all providers, have limited generalizability, and lack relevant cancer outcomes. The RECUR algorithms offer great potential to leverage the power of big data to improve health care and health care policy.
Funding
This work was supported by a grant from the National Cancer Institute (NCI; R01 CA172143), with additional support from NCI (U2 C171524 to the Cancer Research Network, LHK), R01 CA10527(LHK), U01 CA195565 (LHK); The American Society of Clinical Oncology (Career Development Award); and Susan G. Komen for the Cure (Career Catalyst Award) provided salary support to MJH.
Notes
The funders had no role in the design of the study; the collection, analysis, or interpretation of the data; the writing of the manuscript; or the decision to submit the manuscript for publication.
The authors would like to thank Dr. Jessica Chubak for her assistance in implementing the BRAVA alogorithm for our phase II validation. We would also like to thank Cecile A. Laurent and Isaac J. Ergas, who prepared the Pathways Study data sets, excuted the SAS code associated with the BC Recurr algorithms, and provided analytic support in preparing the summary data tables presented here. The authors would also like to acknowlege the ongoing analytic and programming support provided by Erin M. Keast at Kaiser Permanente Northwest.
Supplementary Material
References
- 1. Siegel RL, Miller KD, Jemal A.. Cancer statistics, 2016. CA Cancer J Clin. 2016;661:7–30. [DOI] [PubMed] [Google Scholar]
- 2. Mariotto AB, Etzioni R, Hurlbert M, Penberthy L, Mayer M.. Estimation of the number of women living with metastatic breast cancer in the United States. Cancer Epidemiol Biomarkers Prev. 2017;266:809–815. [DOI] [PMC free article] [PubMed] [Google Scholar]
- 3. Yang HC, Thornton LM, Shapiro CL, Andersen BL.. Surviving recurrence: Psychological and quality-of-life recovery. Cancer. 2008;1125:1178–1187. [DOI] [PMC free article] [PubMed] [Google Scholar]
- 4. Bardia A, Iafrate JA, Sundaresan T, Younger J, Nardi V.. Metastatic breast cancer with ESR1 mutation: Clinical management considerations from the Molecular and Precision Medicine (MAP) tumor board at Massachusetts General Hospital. Oncologist. 2016;219:1035–1040. [DOI] [PMC free article] [PubMed] [Google Scholar]
- 5. Li J, Ren J, Sun W.. Systematic review of ixabepilone for treating metastatic breast cancer. Breast Cancer. 2016; in press. [DOI] [PubMed] [Google Scholar]
- 6. Jassem J, Carroll C, Ward SE, Simpson E, Hind D.. The clinical efficacy of cytotoxic agents in locally advanced or metastatic breast cancer patients pretreated with an anthracycline and a taxane: A systematic review. Eur J Cancer. 2009;4516:2749–2758. [DOI] [PubMed] [Google Scholar]
- 7. Roche H, Vahdat LT.. Treatment of metastatic breast cancer: Second line and beyond. Ann Oncol. 2011;225:1000–1010. [DOI] [PubMed] [Google Scholar]
- 8. Warren JL, Yabroff KR.. Challenges and opportunities in measuring cancer recurrence in the United States. J Natl Cancer Inst. 2015;1078:djv134. [DOI] [PMC free article] [PubMed] [Google Scholar]
- 9. Ray S, Bonthapally V, McMorrow D, Bonafede M, Landsman-Blumberg P.. Patterns of treatment, healthcare utilization and costs by lines of therapy in metastatic breast cancer in a large insured US population. J Comp Eff Res. 2013;22:195–206. [DOI] [PubMed] [Google Scholar]
- 10. Geiger AM, Thwin SS, Lash TL et al. , Recurrences and second primary breast cancers in older women with initial early-stage disease. Cancer. 2007;1095:966–974. [DOI] [PubMed] [Google Scholar]
- 11. Chubak J, Yu O, Pocobelli G et al. , Administrative data algorithms to identify second breast cancer events following early-stage invasive breast cancer. J Natl Cancer Inst. 2012;10412:931–940. [DOI] [PMC free article] [PubMed] [Google Scholar]
- 12. Chubak J, Onega T, Zhu W, Buist DS, Hubbard RA.. An electronic health record-based algorithm to ascertain the date of second breast cancer events. Med Care. 2015. [Epub ahead of print April 3, 2015]. doi: 10.1097/MLR.0000000000000352. [DOI] [PMC free article] [PubMed] [Google Scholar]
- 13. Haque R, Shi J, Schottinger JE et al. , A hybrid approach to identify subsequent breast cancer using pathology and automated health information data. Med Care. 2015;534:380–385. [DOI] [PubMed] [Google Scholar]
- 14. Carrell DS, Halgrim S, Tran DT et al. , Using natural language processing to improve efficiency of manual chart abstraction in research: The case of breast cancer recurrence. Am J Epidemiol. 2014;1796:749–758. [DOI] [PMC free article] [PubMed] [Google Scholar]
- 15. Lamont EB, Herndon JE, Weeks JC et al. , Measuring disease-free survival and cancer relapse using Medicare claims from CALGB breast cancer trial participants (companion to 9344). J Natl Cancer Inst. 2006;9818:1335–1338. [DOI] [PMC free article] [PubMed] [Google Scholar]
- 16. Kroenke CH, Chubak J, Johnson L, Castillo A, Weltzien E, Caan BJ.. Enhancing breast cancer recurrence algorithms through selective use of medical record data. J Natl Cancer Inst. 2015;1083:pii. [DOI] [PMC free article] [PubMed] [Google Scholar]
- 17. Strauss JA, Chao CR, Kwan ML, Ahmed SA, Schottinger JE, Quinn VP.. Identifying primary and recurrent cancers using a SAS-based natural language processing algorithm. J Am Med Inform Assoc. 2013;202:349–355. [DOI] [PMC free article] [PubMed] [Google Scholar]
- 18. Nordstrom BL, Whyte JL, Stolar M, Mercaldi C, Kallich JD.. Identification of metastatic cancer in claims data. Pharmacoepidemiol Drug Saf. 2012;21(suppl 2):21–28. [DOI] [PubMed] [Google Scholar]
- 19. Whyte JL, Engel-Nitz NM, Teitelbaum A, Gomez Rey G, Kallich JD.. An evaluation of algorithms for identifying metastatic breast, lung, or colorectal cancer in administrative claims data. Med Care. 2015;537:e49–e57. [DOI] [PubMed] [Google Scholar]
- 20. Warren JL, Mariotto A, Melbert D et al. , Sensitivity of Medicare claims to identify cancer recurrence in elderly colorectal and breast cancer patients. Med Care. 2016;548:e47–e54. [DOI] [PMC free article] [PubMed] [Google Scholar]
- 21. Hornbrook MC, Hart G, Ellis JL et al. , Building a virtual cancer research organization. J Natl Cancer Inst Monogr. 200535:12–25. [DOI] [PubMed] [Google Scholar]
- 22. Ross TR, Ng DJ, Brown JS et al. , The HMO Research Network Virtual Data Warehouse: A public data model to support collaboration. eGEMS. 2014;21: Article 2. [DOI] [PMC free article] [PubMed] [Google Scholar]
- 23. US Food and Drug Administration. Distributed Database and Common Data Model (Mini-Sentinel). Washington, DC: Mini-Sentinel; 2014. [Google Scholar]
- 24.PCORNET DS, Security and Network Infrastructure (DSSNI) Task Force. The National Patient-Centered Clinical Research Network, Common Data Model. 2014. http://www.pcornet.org/pcornet-common-data-model/ (Guidance added in v3.0.). Accessed April 28, 2017.
- 25. Hassett MJ, Uno H, Cronin AM, Carroll NM, Hornbrook MC, Ritzwoller D.. Detecting lung and colorectal cancer recurrence using structured clinical/administrative data to enable outcomes research and population health management. Med Care. 2015. [Epub ahead of print July 29, 2015]. doi: 10.1097/MLR.0000000000000404. [DOI] [PMC free article] [PubMed] [Google Scholar]
- 26. Health Care Systems Research Network (HCSRN). 2015. http://www.hcsrn.org. Accessed February 28, 2017.
- 27. Kwan ML, Ambrosone CB, Lee MM et al. , The Pathways Study: A prospective study of breast cancer survivorship within Kaiser Permanente Northern California. Cancer Causes Control. 2008;1910:1065–1076. [DOI] [PMC free article] [PubMed] [Google Scholar]
- 28. Kwan ML, Ergas IJ, Somkin CP et al. , Quality of life among women recently diagnosed with invasive breast cancer: The Pathways Study. Breast Cancer Res Treat. 2010;1232:507–524. [DOI] [PMC free article] [PubMed] [Google Scholar]
- 29. Hassett MJ, Ritzwoller DP, Taback N et al. , Validating billing/encounter codes as indicators of lung, colorectal, breast, and prostate cancer recurrence using 2 large contemporary cohorts. Med Care. 2014;5210:e65–e73. [DOI] [PMC free article] [PubMed] [Google Scholar]
- 30.American College of Surgeons. Registry Manuals, Current Data Standards, Historic Data Standards Chicago, IL: the American College of Surgeons; 2016.
- 31.The North American Association of Central Cancer Registries (NAACR). 2016. http://www.naaccr.org/. Accessed February 28, 2017. https://www.facs.org/quality%20programs/cancer/ncdb/registrymanuals/cocmanuals. Accessed February 28, 2017.
- 32. Earle CC, Nattinger AB, Potosky AL et al. , Identifying cancer relapse using SEER-Medicare data. Med Care. 2002;40(8 suppl):IV–81. [DOI] [PubMed] [Google Scholar]
- 33. Huang YQ, Liang CH, He L et al. , Development and validation of a radiomics nomogram for preoperative prediction of lymph node metastasis in colorectal cancer. J Clin Oncol. 2016;3418:2157–2164. [DOI] [PubMed] [Google Scholar]
- 34. Tibshirani R. Regression shrinkage and selection via the lasso. J Royal Stat Soc Series B Stat Methodol .1996:267–288. [Google Scholar]
- 35. Powers DM. Evaluation: From precision, recall and F-measure to ROC, informedness, markedness and correlation. J Mach Learn Technol. 2011;21:37–63. [Google Scholar]
- 36. Molinaro AM, Simon R, Pfeiffer RM.. Prediction error estimation: A comparison of resampling methods. Bioinformatics. 2005;2115:3301–3307. [DOI] [PubMed] [Google Scholar]
- 37. National Cancer Institute. The HMO Cancer Research Network: Capacity, collaboration, and investigation. Washington, DC: US Department of Health and Human Services, National Institutes of Health; 2010. [Google Scholar]
- 38. Patient-Centered Outcomes Research Institute (PCORI). 2017. http://www.pcori.org/. Accessed February 28, 2017.
- 39. US Food and Drug Administration. Min-Sentinel. Washington, DC; US Food and Drug Administration; 2016. [Google Scholar]
- 40. National Cancer Institute, Divison of Cancer Control & Population Sciences. SEER_Medicare Linked Database. 2016; http://healthcaredelivery.cancer.gov/seermedicare/. Accessed February 28, 2017.
- 41. Hassett MJ, Banegas MP, Uno H et al. , Determinants of spending for metastatic breast, lung, and colorectal cancer in SEER-Medicare. Paper presented at: ASCO Annual Meeting; 2017; Chicago, IL.
- 42. Hsiao C-J, Hing E.. Use and characteristics of electronic health record systems among office-based physician practices: United States, 2001–2013. NCHS Data Brief. 2014; Jan143:1–8. Hyattsville, MD: National Center for Health Statistics. [PubMed] [Google Scholar]
- 43. Davies M, Erickson K, Wyner Z, Malenfant J, Rosen R, Brown J.. Software-enabled distributed network governance: The PopMedNet experience. EGEMS (Wash DC). 2016;42:1213. [DOI] [PMC free article] [PubMed] [Google Scholar]
- 44. PopMedNet™: Overview. 2017. http://www.popmednet.org/?page_id=23. Accessed January 17, 2017.
- 45. PopMedNet: Initiatives and Networks. 2017. http://www.popmednet.org/?page_id=41. Accessed June 8, 2017.
Associated Data
This section collects any data citations, data availability statements, or supplementary materials included in this article.