

ABSTRACT
Background
Observational studies find associations between maternal docosahexaenoic acid (DHA) and greater fat-free mass and lower percentage of body fat, but randomized trials of prenatal DHA supplementation have not found significant intent-to-treat effects on childhood body composition.
Objective
This study sought to explore associations between intrauterine DHA exposure and body composition and size at 5 y in the offspring of women who participated in a randomized trial of prenatal DHA supplementation (corn and soybean oil placebo or 600 mg/d).
Design
At 5 y, body composition was measured by air displacement plethysmography in 154 offspring of women who had participated in the Kansas University DHA Outcomes Study and who had red blood cell (RBC) phospholipid (PL) fatty acids assessed at enrollment and delivery. We used linear regression models to analyze the relation among 3 indicators of intrauterine DHA exposure—1) intent-to-treat (placebo or DHA), 2) maternal RBC PL DHA status at delivery, and 3) change in maternal DHA (delivery minus enrollment)—and 6 outcomes of interest: 5-y fat mass, fat-free mass, percentage of body fat, height, weight, and body mass index z score.
Results
Change in maternal RBC PL DHA correlated with higher fat-free mass (r = 0.21, P = 0.0088); the association was unchanged after adjustment for maternal, perinatal, and childhood dietary factors. Intent-to-treat and DHA status at delivery showed positive trends with fat-free mass that were not statistically significant. There was no evidence relating intrauterine DHA exposure to any other body composition measure.
Conclusions
Change in maternal DHA status during pregnancy was related to higher offspring 5-y fat-free mass. The other 2 indicators of intrauterine exposure to DHA suggested a trend for higher offspring 5-y fat-free mass. Our findings agree with an earlier observational study from the United Kingdom. This trial was registered at clinicaltrials.gov as NCT00266825.
INTRODUCTION
DHA and arachidonic acid (ARA) are key nutrients and the principal long-chain PUFAs in cell membranes. Both DHA and ARA have important roles in inflammation and stem cell differentiation (1, 2), but DHA is poorly synthesized from α-linolenic acid, and dietary intake is variable within and among populations (3). During fetal development, mesenchymal stem cells commit to different lineages, including adipocytic and myogenic lineages, in a competitive process that influences postnatal body composition. This critical window in fetal development has long-term implications for healthy aging (4), because the number of muscle fibers is set by term birth (5). As DHA inhibits adipocyte differentiation (6) we postulated that reducing the maternal ARA to DHA ratio by increasing DHA intake during late gestation would influence childhood body composition.
Groh-Wargo et al. (7) reported that an infant formula containing DHA and ARA increased lean mass and reduced fat mass at 1 y corrected age in preterm infants born early in the last trimester of pregnancy; their results are the earliest evidence that providing DHA at this very early stage of development could influence body composition. More recently, 3 observational studies found an association between intrauterine exposure to DHA (maternal or cord blood plasma DHA) and offspring body composition in childhood. One found higher lean mass but no difference in fat mass in 4- and 6-y-old children (8); the other 2 found evidence of lower adiposity at 3 or 6 y of age (9, 10). In contrast, 2 randomized trials that provided a fish oil source of DHA and EPA during pregnancy found no effect of supplementation on offspring body composition by intent-to-treat analysis (11, 12).
The randomized trials may have been biased toward null findings because they measured body composition by skinfold thickness and bioelectrical impedance, which tend to be less accurate than dual-energy X-ray absorptiometry (DXA) or air displacement plethysmography. Additionally, compliance varies and a measure of intrauterine exposure was not ascertained. We are not aware of any study that has evaluated body composition in children via air displacement plethysmography following in utero exposure to a wide range of DHA.
The Kansas DHA Outcomes Study (KUDOS), a randomized, double-blind, placebo-controlled trial, provided pregnant women with capsules that contained a corn oil and soybean oil mixture (placebo) or 600 mg/d of DHA during pregnancy in a 1:1 allocation (13). We have been following this cohort of children to measure their growth and cognitive development. In this post-hoc, exploratory analysis of body composition at age 5 y, we evaluated 3 separate, but correlated, measures of intrauterine DHA exposure: 1) maternal group assignment (intent-to-treat), 2) maternal red blood cell (RBC) phospholipid (PL) DHA at delivery, and 3) change in maternal RBC PL DHA from enrollment to delivery.
SUBJECTS AND METHODS
Subjects
From March 2006 through September 2009, pregnant women in the Kanas City Metropolitan area were enrolled into the KUDOS study (NCT00266825). Both the research protocol and informed consent adhered to the Declaration of Helsinki and ethical approval was obtained from the University of Kansas Institutional Review Board (HSC #11406). Recruitment was restricted to low-risk pregnancies. Details of the recruiting process and eligibility criteria are available in the report of the primary pregnancy outcomes (13). The primary aims of the study were to evaluate the effect of providing a prenatal DHA supplement of 600 mg compared to placebo on pregnancy outcomes and infant cognitive development to 18 mo. When children were 18 mo old, parents of 190 children gave permission for continued semiannual assessments ≤6 y (see Figure 1 for subject flow). These visits measured diet (described below), height, weight, cognitive development, and (beginning at age 4 y) blood pressure. An amended consent gave permission to obtain body composition when children were 5 y of age.
FIGURE 1.

CONSORT showing subject flow from the original randomized controlled trial of DHA supplementation. Children were previously randomly assigned as part of the parent trial and reconsented at age 2 y into the follow up study. Semiannual assessments of diet and cognitive development were obtained at 2, 2.5, 3, 3.5, 4, 4.5, 5, 5.5, and 6 y of age. The Bod Pod was first attempted at 5 y of age, and again at 5.5 y of age for children who refused at 5 y of age. CONSORT, Consolidated Standards of Reporting Trials; Ht, height; Wt, weight.
Both staff and parents were blinded to assignment at the time of assessment. Parents were told their child's allocation when the children completed the 6-y assessments. All visits throughout the study were conducted in the Maternal and Child Nutrition and Development Laboratory at the University of Kansas Medical Center.
Data collection methods
Data on both the mother and child were collected over the course of this longitudinal project. Maternal characteristics included self-reported smoking history, educational attainment, race and ethnicity, prenatal weight gain (difference in weight from study enrollment to last prenatal clinic visit), measured height, and estimated income (median income of residence zip code at the time of enrollment). To evaluate the possible influence of socioeconomic status (SES), we used a continuous SES score calculated from maternal age, race and ethnicity, income, and education (14).
Body composition was assessed by air displacement plethysmography (Bod Pod software version 5.4.3; COSMED) that includes the pediatric software options for testing children between 2 and 6 y. We did not use the seat option as the manufacturer recommends its use only for subjects who are smaller (2–3 y old) or who need to be restrained during the test. None of our subjects met either criterion. Testing procedures followed a standardized testing protocol uniform to our Body Composition Laboratory. Standardized procedures include wearing a tight-fitting one-piece swimsuit and a swim cap provided by the Laboratory. Height was measured without shoes to the nearest 0.1 cm using a wall-mounted stadiometer (PORTROD; Health o meter). Body weight was obtained to the nearest 0.01-kg using the system integrated electronic scale. Body volume was corrected for predicted thoracic gas volume and surface area artifact (15). Body density was calculated as body mass/body volume and converted to percentage body fat using the Lohman equation (16). Twenty-three of 154 children refused the body composition assessment at age 5 y and thus had their body composition assessment at 5.5 y. Anthropometric data were converted to percentiles using the CDC's Epi InfoTM version 3.5.4.
Child sex, weight, and gestational age at birth were obtained from the medical record, and human milk and formula feeding were collected prospectively at regular intervals during infancy as part of the parent trial. Food and beverage intake was measured by a registered dietitian semiannually from 2 to 4.5 y by 24-h recall. Each child's dietary pattern was categorized as “Prudent” or “Western” by hierarchical cluster analysis of average, age-adjusted daily intake of 24 food and beverage groups (14). The report demonstrates the feasibility of our use of an average dietary recall taken semiannually from 2 to 4.5 y as an assessment of individual intake.
Maternal blood was sampled at enrollment and delivery by venipuncture. The fatty acid composition of RBC PL (weight percent of fatty acids) was determined by a sequential process of lipid extraction, phospholipid isolation, trans-methylation, and fatty acid analysis, as detailed previously (13).
Statistical analysis
We first assessed for evidence of bias from loss-to-follow-up by testing for differences between mother-child dyads with and without missing data. Pearson's chi-square was used for categorical variables, and Student's t test was used for continuous variables.
The dependent variables for this study were 5-y fat mass, fat-free mass, body fat percent, weight, height, and BMI z score (BMI z score was selected over BMI percentile due to skew of the latter). Fat mass, fat-free mass, and weight were log transformed to attain a normal distribution, as assessed by the Shapiro-Wilk test. Body fat percent, height, and BMI z score were normally distributed and did not require transformation. Percent fat-free mass was not modeled separately, because it is the opposite of body fat percent.
Intrauterine DHA exposure was the independent variable, and was coded in 3 different ways; each of these was separately assessed for associations with the 6 measures of 5-y body size and composition. The first DHA variable was group assignment (i.e., the intent-to-treat analysis) regardless of initial maternal status or compliance. The second DHA variable was maternal RBC PL DHA at the time of delivery, a quantitative measure of maternal DHA status after the supplementation period for both placebo and supplemented groups; this variable allows direct comparison of results from several observational studies that used this as a proxy for in utero exposure to DHA. The third DHA variable was the change in maternal RBC PL DHA during pregnancy (delivery minus enrollment); this represents the quantitative effect of supplementation on an individual mother's DHA status. A greater increase in maternal RBC PL DHA during pregnancy is related to lower DHA at enrollment, assignment to the DHA group, and compliance with study protocol.
The linear regression models of fat mass, fat-free mass, and body fat percent (body fat-free mass percent is the reciprocal) included child sex and age (range: 4.94–5.60 y) at the time of body composition assessment as a continuous covariate. The linear regression models of height, weight, and BMI z score were constructed with child sex (male compared with female) as a covariate. We checked whether the results changed when including all maternal, dietary, and perinatal factors. The 6 maternal factors were SES score, parity (primagravida compared with multiparous), maternal height, maternal BMI at enrollment, maternal smoking (ever compared with never), and study weight gain. Parity was dichotomized due to high skew of number of previous term pregnancies (median: 0; range: 0–6) and the desire to limit the variable to one degree of freedom; there is evidence that first-borns tend to be taller than siblings (17). Smoking was included as a covariate, because it is associated with many health behaviors (18). The 2 early-childhood dietary factors were breastfeeding (any compared with none) and dietary pattern of early childhood (Prudent compared with Western). Breastfeeding duration was dichotomized due to high skew (median: 123 d; range: 0–1236 d) and the desire to limit the variable to one degree of freedom. Perinatal factors included gestational age at delivery (weeks), birthweight (grams), and birth length (centimeters).
This exploratory study applied a type I error rate of 5.0% without adjustment for multiple comparisons, and results should therefore be interpreted cautiously. This prospective study was not powered to detect differences between groups in body composition. Significant bivariate associations between independent and dependent variables are reported to replicate previously identified predictors of early child growth. Bivariate associations between dependent and independent variables were assessed by Pearson's correlation, Student's t test, or Pearson's chi-square test. All statistical analyses were performed with JMP 13.0 (SAS Institute).
RESULTS
Of the 171 children who had height and weight measured at 5 y of age, 154 (90%) had their body composition assessed at 5 (n = 131) or 5.5 y of age (n = 23). Five of these 154 children were born to women missing maternal RBC DHA at delivery. Seventeen children did not complete a body composition assessment at either age due to child or parental refusal. Birth length and breastfeeding variables were missing data for 1 child each. Complete data was available for 149 mother-offspring pairs. The characteristics and categories of mothers and offspring are described in Table 1 and Table 2. Only one variable differed significantly (P < 0.05) between the 17 children who did not complete a body composition assessment due to child or parental refusal and those whose body composition was analyzed; mothers of children missing body composition measurement were more likely to be multiparous than nulliparous [OR: 3.20 (95% CI: 1.28, 10.5)].
TABLE 1.
Sample characteristics of 171 mother-child dyads followed from pregnancy to age 5 y by group1
| Placebo | DHA | |
|---|---|---|
| SES score (0–4)2 | 1.94 ± 1.04 | 2.12 ± 0.94 |
| Maternal age, y | 26.1 ± 4.9 | 26.4 ± 4.7 |
| Maternal education, y | 14.5 ± 2.6 | 14.8 ± 2.4 |
| Maternal median zip code annual income ($1000) | 47.0 ± 21.6 | 49.7 ± 18.4 |
| Previous term pregnancies, n | 0.71 ± 1.07 | 0.70 ± 0.87 |
| Maternal weight at enrollment, kg | 71.1 ± 14.0 | 74.7 ± 13.3 |
| Maternal height, cm | 163.5 ± 6.7 | 164.1 ± 6.8 |
| BMI at enrollment, kg/m2 | 26.6 ± 5.0 | 27.9 ± 5.2 |
| Gestational weight gain, kg | 13.2 ± 5.7 | 12.9 ± 5.9 |
| Pregnancy duration, wk | 39.2 ± 2.0 | 39.6 ± 1.3 |
| Infant birthweight, g | 3264 ± 529 | 3450 ± 490 |
| Infant birth length, cm | 49.3 ± 3.0 | 49.9 ± 2.5 |
| RBC PL DHA at enrollment, weight % of total FAs | 4.4 ± 1.2 | 4.4 ± 1.1 |
| RBP PL DHA at delivery, weight % of total FAs | 4.7 ± 1.1 | 7.7 ± 2.0 |
| RBC PL DHA change, % | 0.3 ± 1.5 | 3.3 ± 2.0 |
| 5-y fat mass, kg | 4.9 ± 1.6 | 5.2 ± 1.7 |
| 5-y fat-free mass, kg | 14.6 ± 2.3 | 15.2 ± 2.1 |
| 5-y body fat,3 % of total weight | 24.9 ± 6.5 | 25.1 ± 4.9 |
| 5-y weight, kg | 19.8 ± 2.9 | 20.8 ± 3.1 |
| 5-y height, cm | 110.0 ± 4.3 | 110.6 ± 4.2 |
| 5-y BMI z score | 0.51 ± 1.0 | 0.70 ± 0.9 |
Values are means ± SDs. Placebo: n = 83 except for 5-y fat mass, fat-free mass, and body fat (percentage) where n = 76; DHA: n = 88 except for 5-y fat mass, fat-free mass, and body fat (percentage) where n = 78. PL, phospholipid; RBC, red blood cell; SES, socioeconomic status.
SES score is a multivariate measure of SES from maternal race and ethnicity, maternal age, maternal education, and zip code income (see reference 14).
Fat-free mass (percentage of total weight) is the reciprocal of 5-y body fat percentage.
TABLE 2.
Maternal and child categories by group assignment1
| Placebo | DHA | ||
|---|---|---|---|
| Maternal race/ethnicity | White | 50 (60) | 59 (67) |
| Black | 27 (33) | 23 (26) | |
| Hispanic | 5 (6) | 4 (5) | |
| Other | 1 (1) | 2 (2) | |
| Parity | Nulliparous | 36 (43) | 42 (48) |
| Multiparous | 47 (57) | 46 (52) | |
| Maternal BMI category at enrollment | Underweight | 2 (2) | 1 (1) |
| Normal | 32 (39) | 27 (30) | |
| Overweight | 28 (34) | 34 (39) | |
| Obese | 21 (25) | 26 (30) | |
| Maternal smoking history | Never | 38 (46) | 51 (58) |
| Ever | 45 (54) | 37 (42) | |
| Human milk feeding | None | 13 (16) | 22 (25) |
| Some | 69 (84) | 66 (75) | |
| Dietary pattern2 | Prudent | 37 (45) | 40 (45) |
| Western | 46 (55) | 48 (55) |
Values are n (%). Placebo: n = 83 except for 5-y fat mass, fat-free mass, and body fat (percentage) where n = 76; DHA: n = 88 except for 5-y fat mass, fat-free mass, and body fat (percentage) where n = 78.
Dietary pattern is a multivariate measure of mother-reported daily dietary intake from age 2–4.5 y (see reference 14).
DHA supplementation had a strong effect on circulating DHA at delivery: in the placebo group, the median maternal RBC PL DHA increased 6% from enrollment to delivery compared to a median relative increase of 81% in the intervention group.
There were no significant differences between males and females (P > 0.09) and no interaction between child sex and intrauterine DHA exposure (P > 0.024).
Fat mass and percent body fat
There was no evidence that supplementation group, RBC PL DHA at delivery, or change in RBC PL DHA was associated with absolute fat mass or body fat percent at 5 y of age (all P > 0.05) (Table 3).
Table 3.
Associations between DHA variables and 5-y body size and composition in linear regression models1
| Dependent variable | Independent variable | β | 95% CI | P value |
|---|---|---|---|---|
| Fat mass, kg | DHA group (vs. placebo)2 | 7.14 | –3.28, 17.6 | 0.18 |
| Maternal RBC PL DHA at Delivery (%)3 | 0.92 | –1.42, 3.27 | 0.44 | |
| Change in Maternal RBC PL DHA (%)3 | 1.02 | –1.22, 3.27 | 0.37 | |
| Fat-free mass, kg | DHA group (vs. placebo)2 | 4.14 | –0.29, 8.58 | 0.067 |
| Maternal RBC PL DHA at Delivery (%)3 | 1.00 | –0.00, 2.00 | 0.052 | |
| Change in Maternal RBC PL DHA (%)3 | 1.28 | 0.33, 2.23 | 0.0088 | |
| Body fat,6 % | DHA group (vs. placebo)2 | 0.25 | –1.56, 2.05 | 0.27 |
| Maternal RBC PL DHA at Delivery (%)3 | –0.08 | –0.48, 0.33 | 0.71 | |
| Change in Maternal RBC PL DHA (%)3 | –0.13 | –0.51, 0.26 | 0.53 | |
| Height, cm | DHA group (vs. placebo)4 | 0.65 | –0.64,1.95 | 0.32 |
| Maternal RBC PL DHA at delivery (%)5 | 0.17 | –0.12, 0.47 | 0.25 | |
| Change in maternal RBC PL DHA (%)5 | 0.24 | –0.04, 0.52 | 0.097 | |
| Weight, kg | DHA group (vs. placebo)4 | 3.29 | –0.97, 7.56 | 0.13 |
| Maternal RBC PL DHA at delivery (%)5 | 0.69 | –0.30, 1.67 | 0.17 | |
| Change in maternal RBC PL DHA (%)5 | 0.92 | –0.02, 1.86 | 0.055 | |
| BMI z score | DHA group (vs. placebo)5 | 0.21 | –0.09, 0.51 | 0.17 |
| Maternal RBC PL DHA at delivery (%)5 | 0.04 | –0.029, 0.11 | 0.26 | |
| Change in maternal RBC PL DHA (%)5 | 0.05 | –0.015, 0.12 | 0.13 |
The table presents the regression coefficient and 95% CI of prenatal DHA variables in a linear regression model including child sex and, for the first 3 dependent variables, age at body composition assessment by air displacement plethysmography (Bod Pod). Due to log transformation of weight, fat mass, and fat-free mass, the regression coefficients for these models represent percent increase. PL, phospholipid; RBC, red blood cell.
n = 154.
n = 149;
n = 171;
n = 166.
Regression coefficients for percentage of fat-free mass are the opposite of the percentage of body fat.
Fat-free mass
Change in maternal RBC PL DHA from enrollment to delivery was associated with greater offspring fat-free mass at age 5 y (P = 0.0088) (Table 3 and Figure 2). The results in Table 3 are adjusted for child sex and age at body composition assessment for all body composition outcomes because we feel this minimal adjustment is necessary for validity as males and females have different growth trajectories in childhood and the body composition of some infants was measured 6 mo later than the majority. The totally unadjusted analysis for fat-free mass and change in maternal RBC PL DHA is very similar (Pearson's r = 0.208, P = 0.01). Without adjustment, both change in maternal RBC PL DHA from enrollment to delivery and higher maternal RBC PL DHA at delivery were associated with offspring fat-free mass at age 5 y (P = 0.011 and P = 0.047, respectively, Supplemental Table 1). The relation between change in RBC PL DHA and fat-free mass was essentially unchanged after inclusion of all maternal, perinatal, and dietary factors as covariates (fully adjusted model) (P = 0.011, Supplemental Table 2). There were nonsignificant trends for higher fat-free mass with higher maternal RBC PL DHA at delivery and DHA supplementation (intent-to-treat) (Table 3); however, fat-free mass as a percent of body weight was not associated with any of the 3 DHA exposure variables (all P > 0.50).
FIGURE 2.
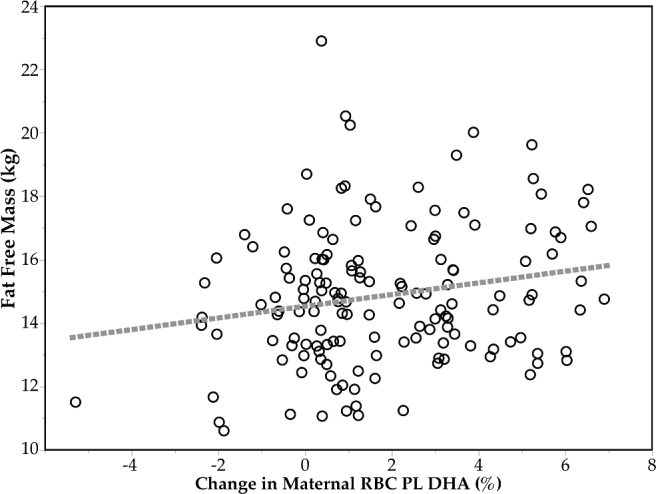
Association between 5-y fat-free mass and change in maternal DHA during pregnancy (n = 149). Absolute fat-free mass at 5 y, adjusted for child sex and age of body composition assessment, was directly correlated with change in maternal RBC DHA PL as weight percent of total FAs during pregnancy (r = 0.21, P = 0.0088). PL, phospholipid; RBC, red blood cell.
Height, weight and BMI z score
There was no evidence that supplementation group or RBC PL DHA at delivery was associated with height, weight, or BMI z score at 5 y (all P > 0.05); however, both height and weight trended positively with change in RBC PL DHA (Table 3).
Bivariate associations of dependent variables with maternal and child characteristics
Fat mass correlated with 2 independent variables: pregnancy duration and birthweight (both r = 0.17, P = 0.04).
Fat-free mass was positively correlated with birthweight (r = 0.23, P = 0.004, birth length (r = 0.22, P = 0.007) and maternal BMI at enrollment (r = 0.019, P = 0.02).
Height at 5 y correlated with birth length (r = 0.26, P = 0.0006), birthweight (r = 0.25, P = 0.0008), maternal gestational weight gain (r = 0.16, P = 0.03), maternal height (r = 0.37, P < 0.0001), and maternal SES (r = 0.20, P = 0.01). Each standard deviation in maternal SES was associated with 0.85 cm greater height (95% CI: 0.21, 1.49).
Weight at 5 y of age was positively associated with birth length (r = 0.21, P = 0.005), birthweight (r = 0.21, P = 0.007), and maternal BMI at enrollment (r = 0.20, P = 0.009).
BMI z score at 5 y of age was associated with maternal BMI at enrollment (r = 0.31, P < 0.0001) as was child dietary pattern (Student's t = 2.12, P = 0.04); compared to a Prudent dietary pattern, children with a Western dietary pattern had a higher average 5-y BMI z score; 0.32 (95% CI: 0.02, 0.61).
DISCUSSION
It seems possible that increasing in utero exposure to DHA promotes fat-free mass growth. An individual mother's response to DHA supplementation (percentage of RBC PL DHA at delivery minus enrollment) correlated with higher offspring fat-free mass at age 5 y. The association could not be attributed to confounding factors such as SES, which itself was predictive of change in maternal RBC DHA in the active treatment group (14). Maternal RBC PL DHA at delivery narrowly missed statistical significance as a predictor of higher fat-free mass. The intent-to-treat analysis also found a nonsignificant trend for higher fat-free mass in children of women assigned to the DHA group. The discrepancy in effects may be due to variable compliance.
Study change in DHA status may have shown the strongest statistical relation to child fat-free mass because the women studied had an overall poor DHA status when enrolled and the DHA status of many improved during the study. In prospective studies, maternal DHA status is presumed stable and maternal DHA status late in pregnancy or at delivery quantifies DHA exposure throughout pregnancy. Three cohort studies have reported a relation of maternal pregnancy DHA status to body composition. Our findings in 5-y-old children are analogous to those from the Southampton Women's Survey (8) in the United Kingdom, which found an association between maternal plasma DHA late in pregnancy and higher lean mass but no relation to fat mass in the offspring at 4 and 6 y. In contrast, 2 other observational studies associated higher maternal DHA status with lower fat mass but found no association with fat-free mass (9, 10).
Two randomized studies—one at 1 y (19), the other at 3 and 5 y of age (12)—of body composition in children born to mothers prenatally supplemented with DHA used intent-to-treat analyses and neither found an effect of the intervention on any measure of body composition. Intent-to-treat analyses are more prone to type 2 errors for several reasons, one of which is variability in compliance. Results from an intent-to-treat analysis are believed to reflect the outcome expected should an intervention become public health policy. In contrast, if a biomarker of nutrient status is available at enrollment and study end, the information can be used to explore the level of a biomarker that needs to be achieved for optimal outcome. If results from compliant subjects are effective even when intent-to-treat is not, individuals can make a more informed choice about the value of a supplement.
We observed no association between offspring body fat or body fat percent and prenatal DHA exposure, which differs from 2 observational studies that found evidence of lower offspring adiposity. Vidakovic et al. (9) measured maternal plasma DHA mid-pregnancy and offspring body fat percent at a mean of 6 y of age with DXA in participants in the Generation R Study. They found an inverse association between maternal DHA concentrations and offspring body fat percent before and after adjusting for pregnancy and childhood factors. Results from Donahue et al. (10) associated prenatal DHA exposure with reduced childhood adiposity at 3 y (sum of subscapular and triceps skinfolds).
The studies that find a relation between fat-free mass and DHA exposure (7, 8), like us, report higher absolute fat-free mass and not higher fat-free mass as a percent of total body weight. The reason may be that fat-free mass as a percentage of weight is more variable than absolute fat-free mass.
Differences in DHA status, timing of DHA exposure and child body fatness may influence the relation between intrauterine DHA exposure and childhood body composition. The 2 observational studies that associated higher intrauterine DHA exposure with lower body fat (9, 10) used cohorts with apparently higher DHA status than the cohort that found an association with higher fat-free mass (8). For example, women in the Generation R Study had exceptionally high DHA status compared to women in our study (we compared plasma PL DHA to RBC PL DHA and determined a conversion factor of 1.67; therefore, their reported mean of 4.8% plasma PL DHA is equivalent to a very high 8.0% RBC PL DHA). Mothers of the children in our study entered the study with a mean RBC PL DHA of 4.4%, and the placebo and DHA groups achieved means of 4.7% and 7.7% DHA, respectively, at delivery (13). Women in Project Viva, whose children were studied by Donahue et al. (10), also appear to have had better DHA status than the women in our cohort, because umbilical plasma DHA and EPA totaled 4.6%.
Like us, Moon et al. (8) studied women who appear to have a generally poor DHA status, and like us, they found a positive association of DHA with higher child fat-free mass. Only Groh-Wargo et al. (7) found both higher fat-free mass and lower body fat with DHA- and ARA-supplemented formula. The formulas were fed to preterm infants until 12 mo corrected age. In addition to the fact that the preterm infants are deprived of intrauterine DHA transfer, the control group likely had poor DHA status because the study was conducted prior to 2002, when prenatal supplements with DHA were not generally available in the United States and infant formulas in the United States did not provide these fatty acids. Variable DHA and ARA intake during infancy characterized the diets of children in all the studies mentioned, although the association of higher fat-free mass with higher DHA exposure in our cohort appears to be independent of postnatal DHA exposure as all children studied in this cohort received either human milk or an infant formula containing DHA and ARA during infancy.
Another possible explanation for a null finding for intrauterine DHA exposure and body fat by Moon et al. (8) and reported here is the generally high percent of body fat of children in both studies. The children studied by Vidakovic et al. (9) also had a very high mean body fat percent; however, the cohort was very large (n = 4830) and had greater power to detect an association between DHA and lower body fat in childhood. When compared to reference data from the United Kingdom in 1985, children from all 3 studies, representing the United States, the United Kingdom, and Germany, have a mean body fat percent close to the 98th percentile of the historical group (20). Body fat percent is highly correlated with fat mass; and fat mass in children is linked to maternal BMI (21–23) and excessive gestational weight gain (24–26). Currently most women in the United States enter pregnancy either overweight or obese, and many of those gain excessively as was true of women in this cohort (13).
In contrast to several other studies (9, 12, 19), we did not find a significant association of prenatal DHA exposure with childhood BMI z score. We did find weak evidence of an association between prenatal DHA exposure and offspring height in agreement with the Southampton Study, which showed a positive association between maternal plasma DHA and height at 6 y but not 4 y (8). We did find a positive association between maternal SES and offspring height, consistent with the correlation between income and height among adults (27). Children with a Prudent diet had a lower BMI z score than those with a Western diet. Associations between similar, empirically derived dietary patterns and risk of childhood overweight or obesity have come from China (28), Korea (29), France (30), and the United States (31).
The weaknesses of our study are as follows: 1) it is an exploratory analysis with a relatively small sample size; 2) sample bias from loss to follow-up may have occurred; 3) measurement of some determinants of child body composition, such as physical activity or screen time (32) and sleep (33) were not obtained; and 4) there is a risk of finding false-positive results from many statistical models. The strengths of our study include the following: 1) extensive characterization of mother-child dyads; 2) relatively high diversity of mothers; 3) quantification of maternal biomarker response to prenatal DHA supplementation compared with placebo; 4) a relatively robust two-compartment assessment of childhood body composition; 5) general agreement among all 3 indicators of intrauterine DHA exposure; 6) a check to see if the primary result was confounded by important covariates; and 7) little evidence of loss-to-follow-up bias.
To conclude, our findings suggest that increased intrauterine DHA exposure is associated with greater absolute child fat-free mass at age 5 y. Our results directly support those found in an observational study conducted in the United Kingdom and are reconcilable with null intent-to-treat effects from other randomized controlled trials. Our findings support the importance of obtaining a status biomarker in clinical trials of nutrients at study entry and completion. Further research is needed to replicate our main observation and to better understand how it may be applied clinically.
Supplementary Material
ACKNOWLEDGMENTS
The authors’ responsibilities were as follows—SEC and JC: designed the parent study; EHK and JMT: conducted the research; BHH: performed the statistical analysis with input from all other authors; HRH: trained EHK and JMT and oversaw body composition assessment in her Body Composition Laboratory; BHH, HRH, and SEC: wrote the paper; SEC and HRH: had primary responsibility for the final content; and all authors: approved the final version of the manuscript. SEC and JC have both consulted with or given talks for companies with a commercial interest in DHA; the remaining authors declare no conflicts of interest with the study.
Supported by a grant from the National Institutes of Health (R01 HD047315).
Supplemental Tables 1 and 2 are available from the “Supplementary data” link in the online posting of the article and from the same link in the online table of contents at https://academic.oup.com/ajcn/.
Abbreviations used
- ARA
arachidonic acid
- DXA
dual-energy X-ray absorptiometry
- PL
phospholipid
- RBC
red blood cell
- SES
socioeconomic status
REFERENCES
- 1. Calder PC. Mechanisms of action of (n-3) fatty acids. J Nutr 2012;142:S592–9. [DOI] [PubMed] [Google Scholar]
- 2. Das UN. Influence of polyunsaturated fatty acids and their metabolites on stem cell biology. Nutrition 2011;27:21–5. [DOI] [PubMed] [Google Scholar]
- 3. Hibbeln JR, Nieminen LR, Blasbalg TL, Riggs JA, Lands WE. Healthy intakes of n−3 and n−6 fatty acids: estimations considering worldwide diversity. Am J Clin Nutr 2006;83:S1483–93. [DOI] [PubMed] [Google Scholar]
- 4. Yan X, Zhu MJ, Dodson MV, Du M. Developmental programming of fetal skeletal muscle and adipose tissue development. J Genom 2013;1:29–38. [DOI] [PMC free article] [PubMed] [Google Scholar]
- 5. Du M, Yan X, Tong JF, Zhao J, Zhu MJ. Maternal obesity, inflammation, and fetal skeletal muscle development. Biol Reprod 2010;82:4–12. [DOI] [PMC free article] [PubMed] [Google Scholar]
- 6. Kim HK, Della-Fera M, Lin J, Baile CA. Docosahexaenoic acid inhibits adipocyte differentiation and induces apoptosis in 3T3-L1 preadipocytes. J Nutr 2006;136:2965–9. [DOI] [PubMed] [Google Scholar]
- 7. Groh-Wargo S, Jacobs J, Auestad N, O'Connor DL, Moore JJ, Lerner E. Body composition in preterm infants who are fed long-chain polyunsaturated fatty acids: a prospective, randomized, controlled trial. Pediat Res 2005;57:712–8. [DOI] [PubMed] [Google Scholar]
- 8. Moon RJ, Harvey NC, Robinson SM, Ntani G, Davies JH, Inskip HM, Godfrey KM, Dennison EM, Calder PC, Cooper C. Maternal plasma polyunsaturated fatty acid status in late pregnancy is associated with offspring body composition in childhood. J Clin Endocrinol Metab 2013;98:299–307. [DOI] [PMC free article] [PubMed] [Google Scholar]
- 9. Vidakovic AJ, Gishti O, Voortman T, Felix JF, Williams MA, Hofman A, Demmelmair H, Koletzko B, Tiemeier H, Jaddoe VW, et al. Maternal plasma PUFA concentrations during pregnancy and childhood adiposity: the Generation R Study. Am J Clin Nutr 2016;103:1017–25. [DOI] [PMC free article] [PubMed] [Google Scholar]
- 10. Donahue SM, Rifas-Shiman SL, Gold DR, Jouni ZE, Gillman MW, Oken E. Prenatal fatty acid status and child adiposity at age 3 y: results from a US pregnancy cohort. Am J Clin Nutr 2011;93:780–8. [DOI] [PMC free article] [PubMed] [Google Scholar]
- 11. Much D, Brunner S, Vollhardt C, Schmid D, Sedlmeier EM, Bruderl M, Heimberg E, Bartke N, Boehm G, Bader BL, et al. Effect of dietary intervention to reduce the n-6/n-3 fatty acid ratio on maternal and fetal fatty acid profile and its relation to offspring growth and body composition at 1 year of age. Eur J Clin Nutr 2013;67:282–8. [DOI] [PubMed] [Google Scholar]
- 12. Muhlhausler BS, Yelland LN, McDermott R, Tapsell L, McPhee A, Gibson RA, Makrides M. DHA supplementation during pregnancy does not reduce BMI or body fat mass in children: follow-up of the DHA to optimize mother infant outcome randomized controlled trial. Am J Clin Nutr 2016;103:1489–96. [DOI] [PubMed] [Google Scholar]
- 13. Carlson SE, Colombo J, Gajewski BJ, Gustafson KM, Mundy D, Yeast J, Georgieff MK, Markley LA, Kerling EH, Shaddy DJ. DHA supplementation and pregnancy outcomes. Am J Clin Nutr 2013;97:808–15. [DOI] [PMC free article] [PubMed] [Google Scholar]
- 14. Hidaka BH, Kerling EH, Thodosoff JM, Sullivan DK, Colombo J, Carlson SE. Dietary patterns of early childhood and maternal socioeconomic status in a unique prospective sample from a randomized controlled trial of prenatal DHA dupplementation. BMC Pediatr 2016;16:191. [DOI] [PMC free article] [PubMed] [Google Scholar]
- 15. Dempster P, Aitkens S. A new air displacement method for the determination of human body composition. Med Sci Sports Exerc 1995;27:1692–7. [PubMed] [Google Scholar]
- 16. Lohman TG. Assessment of body composition in children. Pediatr Exerc Sci 1989;1:19–30. [DOI] [PubMed] [Google Scholar]
- 17. Savage T, Derraik JG, Miles HL, Mouat F, Cutfield WS, Hofman PL. Birth order progressively affects childhood height. Clin Endocrinol 2013;79:379–85. [DOI] [PubMed] [Google Scholar]
- 18. Stringhini S, Sabia S, Shipley M, Brunner E, Nabi H, Kivimaki M, Singh-Manoux A. Association of socioeconomic position with health behaviors and mortality. JAMA 2010;303:1159–66. [DOI] [PMC free article] [PubMed] [Google Scholar]
- 19. Hauner H, Much D, Vollhardt C, Brunner S, Schmid D, Sedlmeier E-M, Heimberg E, Schuster T, Zimmermann A, Schneider K-TM, et al. Effect of reducing the n−6:n−3 long-chain PUFA ratio during pregnancy and lactation on infant adipose tissue growth within the first year of life: an open-label randomized controlled trial. Am J Clin Nutr 2012;95:383–94. [DOI] [PubMed] [Google Scholar]
- 20. McCarthy HD, Cole TJ, Fry T, Jebb SA, Prentice AM. Body fat reference curves for children. Int J Obes (Lond) 2006;30:598–602. [DOI] [PubMed] [Google Scholar]
- 21. Andres A, Hull HR, Shankar K, Casey PH, Cleves MA, Badger TM. Longitudinal body composition of children born to mothers with normal weight, overweight, and obesity. Obesity 2015;23:1252–8. [DOI] [PubMed] [Google Scholar]
- 22. Hull HR, Dinger MK, Knehans AW, Thompson DM, Fields DA. Impact of maternal body mass index on neonate birthweight and body composition. Am J Obstet Gynecol 2008;198:416.e1–e6. [DOI] [PubMed] [Google Scholar]
- 23. Sewell MF, Huston-Presley L, Super DM, Catalano P. Increased neonatal fat mass, not lean body mass, is associated with maternal obesity. Am J Obstet Gynecol 2006;195:1100–3. [DOI] [PubMed] [Google Scholar]
- 24. Hull HR, Thornton JC, Ji Y, Paley C, Rosenn B, Mathews P, Navder K, Yu A, Dorsey K, Gallagher D. Higher infant body fat with excessive gestational weight gain in overweight women. Am J Obstet Gynecol 2011;205:211.e1–e7. [DOI] [PMC free article] [PubMed] [Google Scholar]
- 25. Crozier SR, Inskip HM, Godfrey KM, Cooper C, Harvey NC, Cole ZA, Robinson SM, Group tSWsSS. Weight gain in pregnancy and childhood body composition: findings from the Southampton Women's Survey. Am J Clin Nutr 2010;91:1745–51. [DOI] [PMC free article] [PubMed] [Google Scholar]
- 26. Kaar JL, Crume T, Brinton JT, Bischoff KJ, McDuffie R, Dabelea D. Maternal obesity, gestational weight gain, and offspring adiposity: the Exploring Perinatal Outcomes among Children Study. J Pediatr 2014;165:509–15. [DOI] [PMC free article] [PubMed] [Google Scholar]
- 27. Meyer HE, Selmer R. Income, educational level and body height. Ann Hum Biol 1999;26:219–27. [DOI] [PubMed] [Google Scholar]
- 28. Shang X, Li Y, Liu A, Zhang Q, Hu X, Du S, Ma J, Xu G, Li Y, Guo H. Dietary pattern and its association with the prevalence of obesity and related cardiometabolic risk factors among Chinese children. PLoS One 2012;7:e43183. [DOI] [PMC free article] [PubMed] [Google Scholar]
- 29. Shin KO, Oh S-Y, Park HS. Empirically derived major dietary patterns and their associations with overweight in Korean preschool children. Br J Nutr 2007;98:416–21. [DOI] [PubMed] [Google Scholar]
- 30. Lioret S, Touvier M, Lafay L, Volatier J-L, Maire B. Dietary and physical activity patterns in French children are related to overweight and socioeconomic status. J Nutr 2008;138:101–7. [DOI] [PubMed] [Google Scholar]
- 31. Poti JM, Duffey KJ, Popkin BM. The association of fast food consumption with poor dietary outcomes and obesity among children: is it the fast food or the remainder of the diet? Am J Clin Nutr 2014;99:162–71. [DOI] [PMC free article] [PubMed] [Google Scholar]
- 32. Marshall SJ, Biddle SJ, Gorely T, Cameron N, Murdey I. Relationships between media use, body fatness and physical activity in children and youth: a meta-analysis. Int J Obes 2004;28:1238–46. [DOI] [PubMed] [Google Scholar]
- 33. Carter PJ, Taylor BJ, Williams SM, Taylor RW. Longitudinal analysis of sleep in relation to BMI and body fat in children: the FLAME study. BMJ (Clin Res Ed) 2011;342:d2712. [DOI] [PMC free article] [PubMed] [Google Scholar]
Associated Data
This section collects any data citations, data availability statements, or supplementary materials included in this article.